Simulink Model - Design of an Electric Vehicle
Objective:
- To create a MATLAB model of electric car which uses a battery and a DC motor.
Introduction:
- An electric car is a vehicle that is propelled by one or more electric motors, using energy stored in rechargeable battery packs.
- These have less carbon footprint and has higher efficiency compared to ICE cars.
- They use electric motors for propulsion. The most common types of motors used are Permanent Magnet Synchronous Motor (PMSM) and three phase induction motor.
- The main advantage of the electric motors is they provide instant and constant torque.
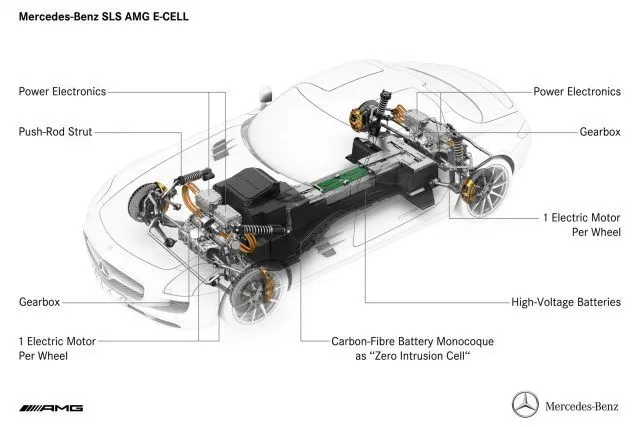
The following image shows a Mercedes SLS AMG electric version
Components in the model:
The main components of EV are
1.Batterries.
2.Power converters.
3.Motor/Generator controller.
4.Motor/Generator.
5.Transmission system.
6.Tyres/wheels.
Simulink Model:
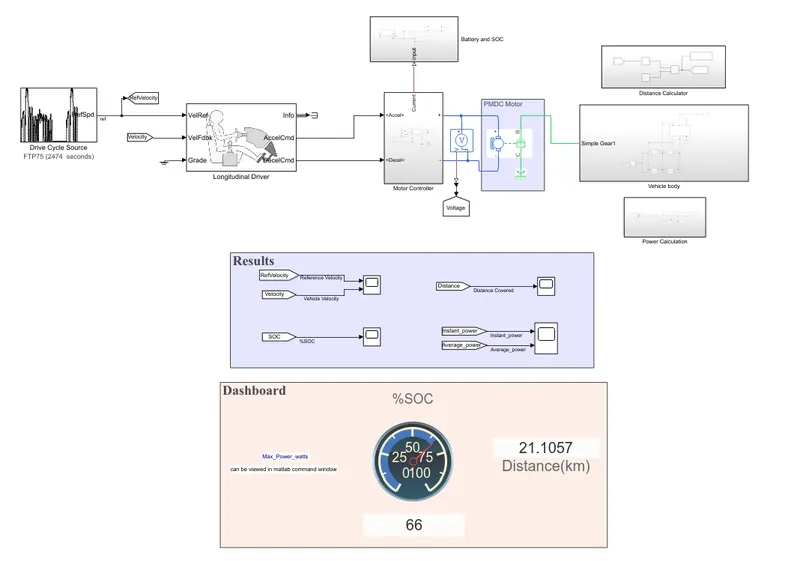
Explanation of Blocks:
- Drive Cycle:
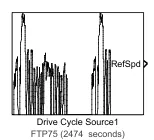
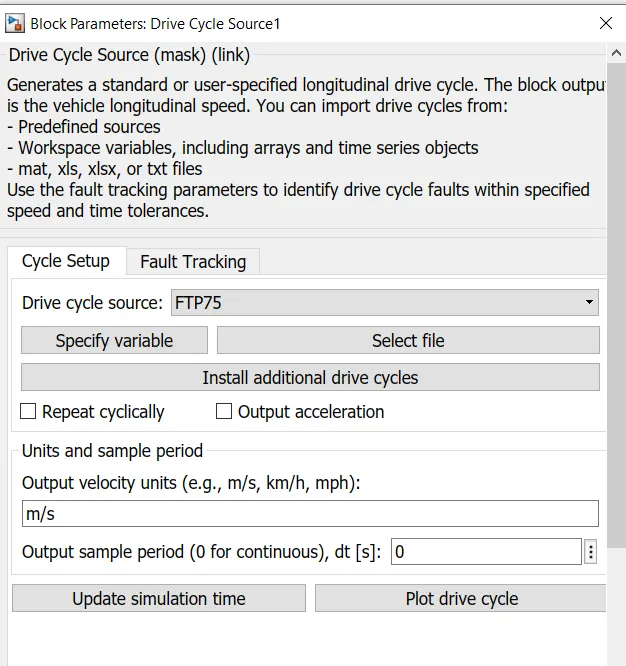
- This block will help us in inputting the drive cycle data, whether it is built in or custom made by the user. That is we can use custom made drive
- cycle data in excel sheet using this block.
- For this model we have used FTP 75 drive cycle, which is built-in in this block.
- Longitudnal Driver:
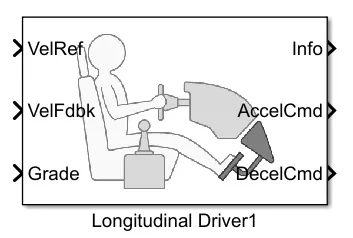
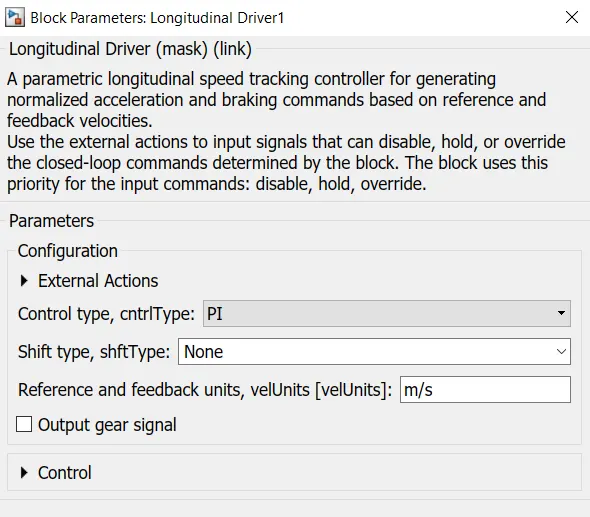
- The Longitudinal Driver block implements a longitudinal speed-tracking controller. Based on reference and feedback velocities.
- This block generates normalized acceleration and braking commands that can vary from 0 through 1.
- This block can be used to model the dynamic response of a driver or to generate the commands necessary to track a longitudinal drive cycle.
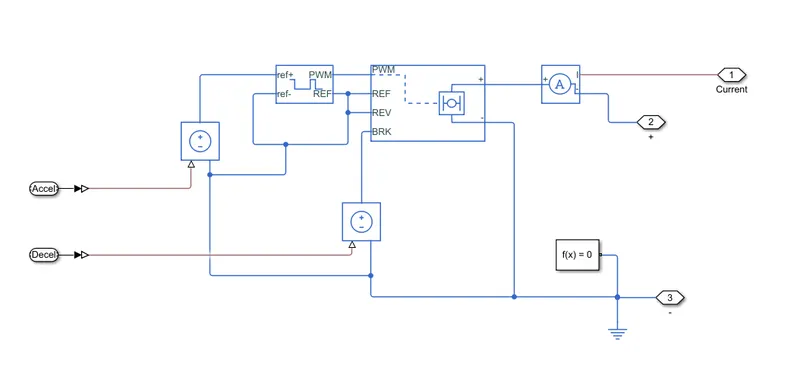
- Motor Controller Subsystem:
- Controlled Voltage Source:
-
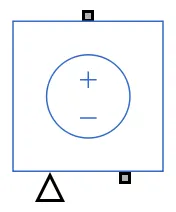
The Controlled Voltage Source block represents an ideal voltage source that is powerful enough to maintain the specified voltage at its output regardless of the current flowing through the source.
-
The output voltage is V = Vs, where Vs is the numerical value presented at the physical signal port.
-
- Controlled PWM Voltage:
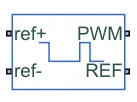
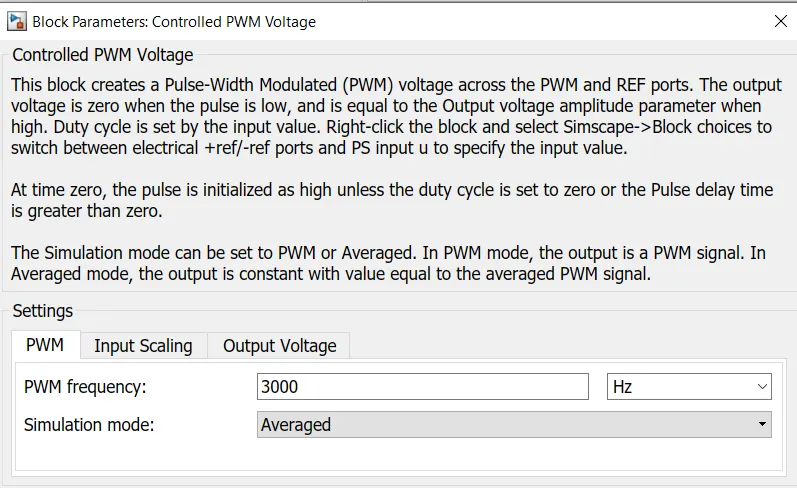
- The Controlled PWM Voltage block represents a pulse-width modulated (PWM) voltage source. The block has two modeling variants,
-
Electrical input ports — The block calculates the duty cycle based on the reference voltage across its ref+ and ref- ports. This modeling variant is the default.
-
PS input — Specify the duty cycle value directly by using an input physical signal port.
-
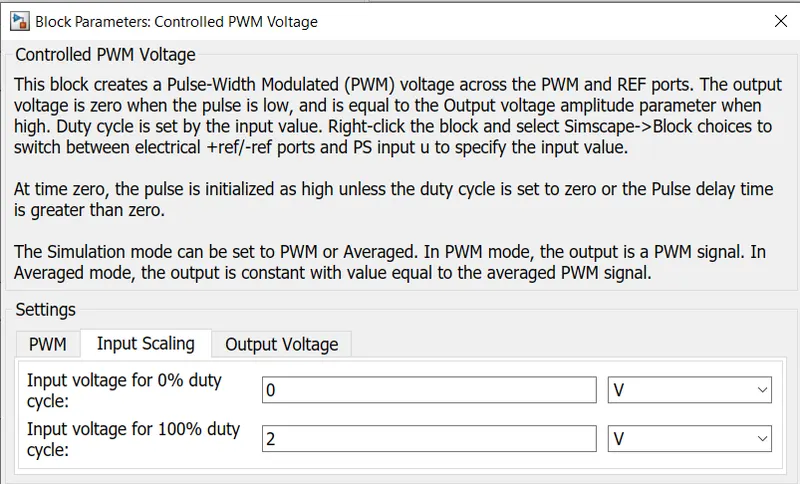
For the Electrical input ports variant of the block, the demanded duty cycle is
`100∗ {V_{ ref} −V_{min}}/ {V _{max} −V_{min}} %`
where:
-
Vref is the reference voltage across the ref+ and ref- ports.
-
Vmin is the minimum reference voltage.
-
Vmax is the maximum reference voltage.
-
- H-Bridge:
-
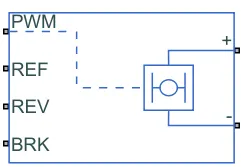
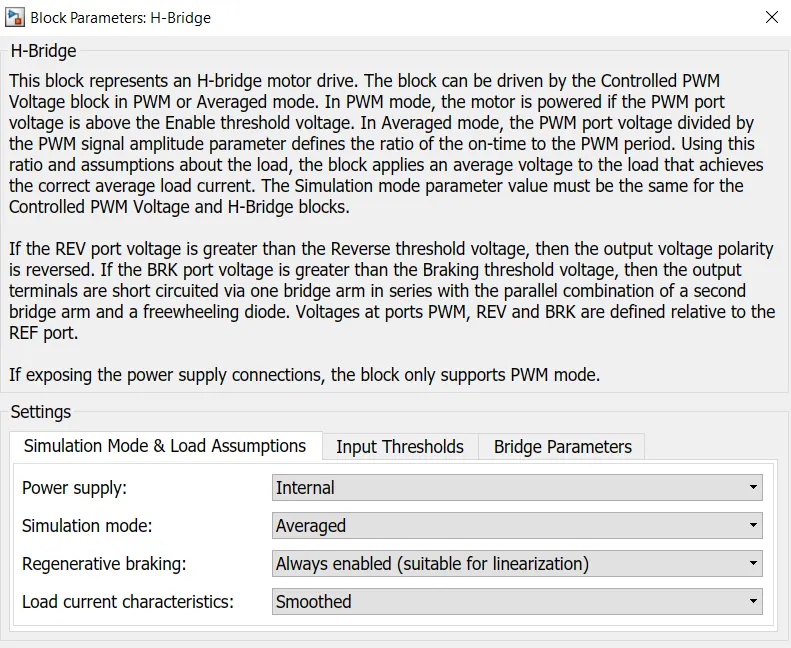
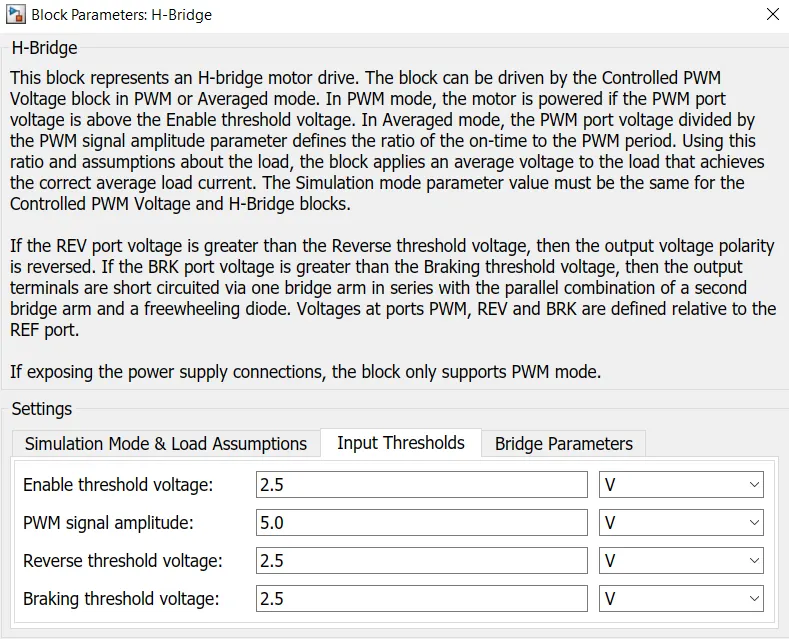
This block is used to change the polarity of the voltage applied across the DC motor so as to run the motor in forward and reverse direction as per the input command.
-
- Current Sensor:
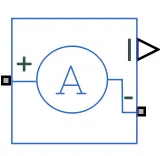
- This block is used to measure the flow of current through a circuit
- End of Subsystem
- Voltage Sensor:
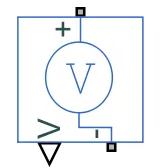
- This block is used to measure voltage across in a circuit.
- DC motor:
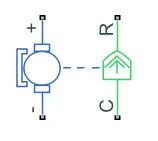
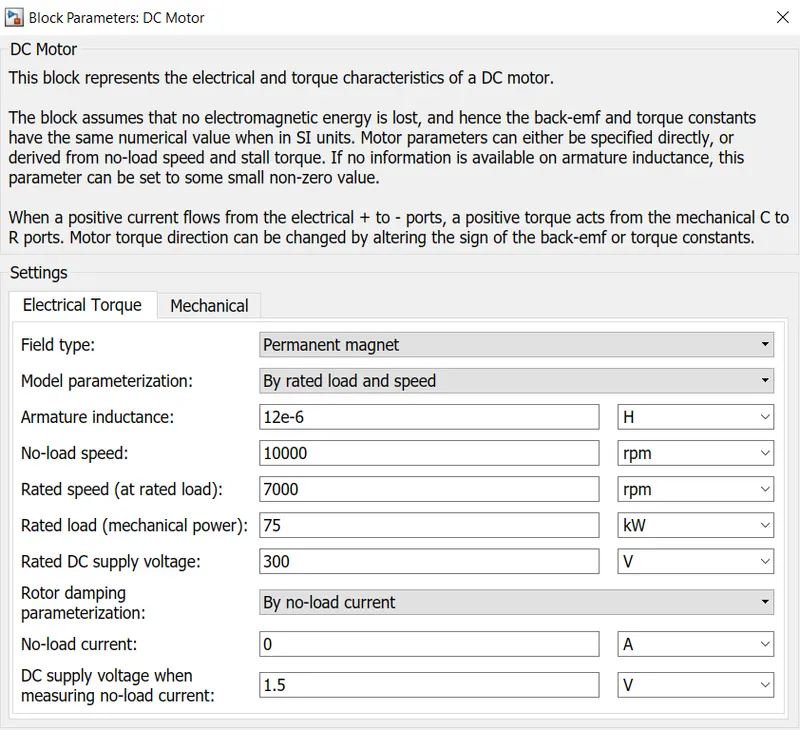
- To convert the electrical energy to mechanical energy we use motors. In this electric vehicle model we have used DC motor. This motor can act as a generator also in case of regenerative braking.
- Battery and SOC subsystem:
- Battery:
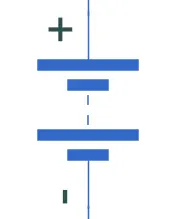
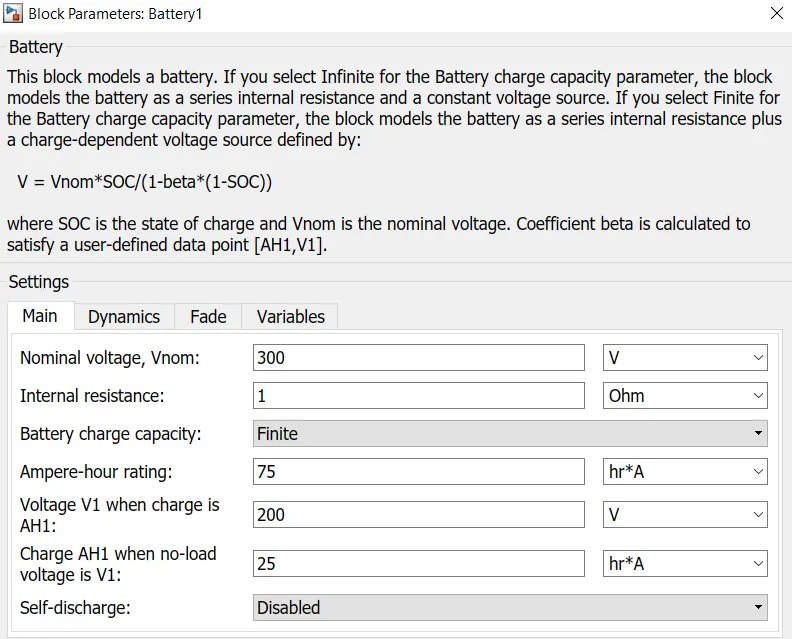
- The Battery block represents a simple battery model.
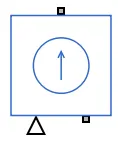
- Controlled Current Source:
-
The Controlled Current Source block represents an ideal current source that is powerful enough to maintain the specified current through it regardless of the voltage across the source.
-
The output current is I = Is, where Is is the numerical value presented at the physical signal port.
- The positive direction of the current flow is indicated by the arrow.
-
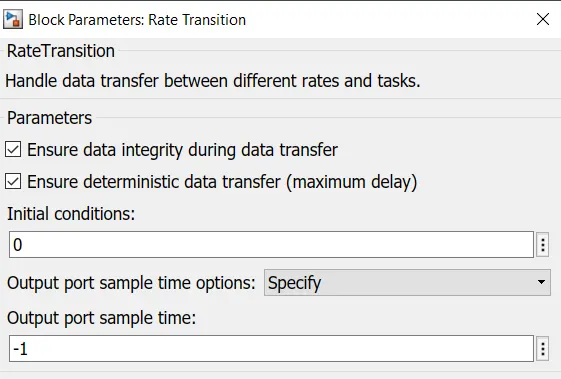
- Rate Transition:
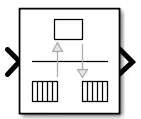
- The Rate Transition block transfers data from the output of a block operating at one rate to the input of a block operating at a different rate.
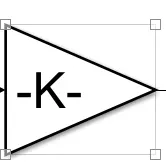
- Gain:
-
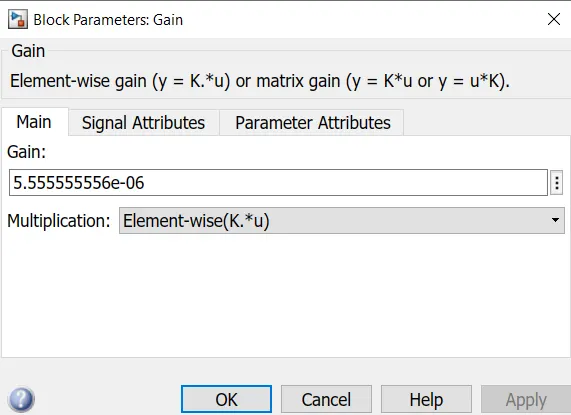
Then a gain block is connected to it. This gain will multiply the value of `k = 1/{A.sec}`In this case the battery capacity is in Ahr, which is ampere hour.
To convert: A sec = Ahr*(3600)
-
- Discrete Time Integrater:
-
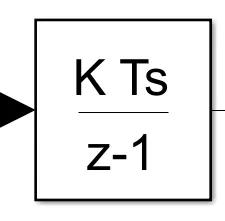
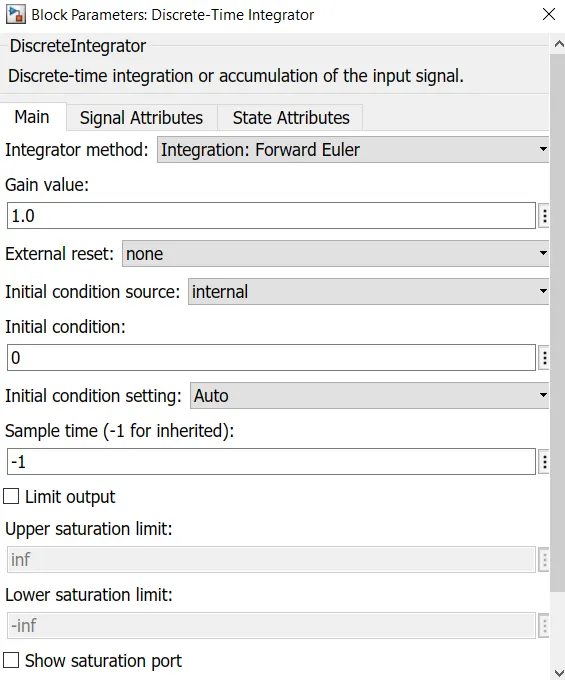
Then to add all these values with respect to time, we have used a Discrete-time integrator. This block will accumulate the input and its parameters are shown below,
-
- This value is then sybtracted from 1 and then multiplied by 100 to get the percentage SOC
- End of subsystem.
- Vehicle Body System:
- Fixed Gear:
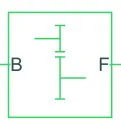
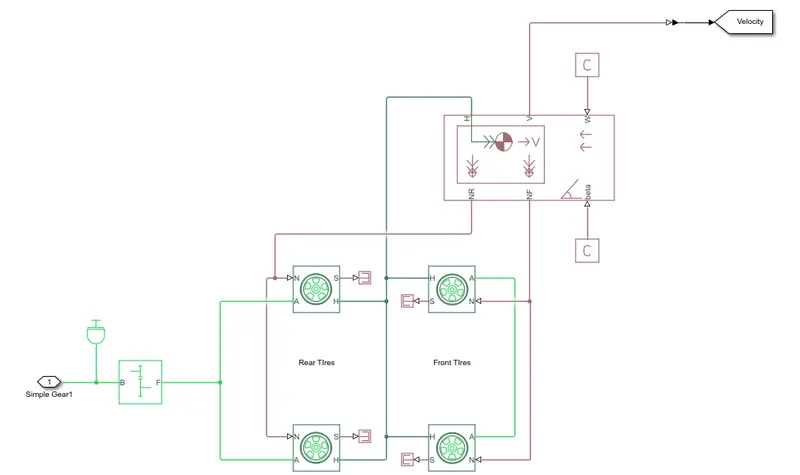
- The Simple Gear block represents a gearbox that constrains the connected driveline axes of the base gear, B, and the follower gear, F, to corotate with a fixed ratio that is specified.
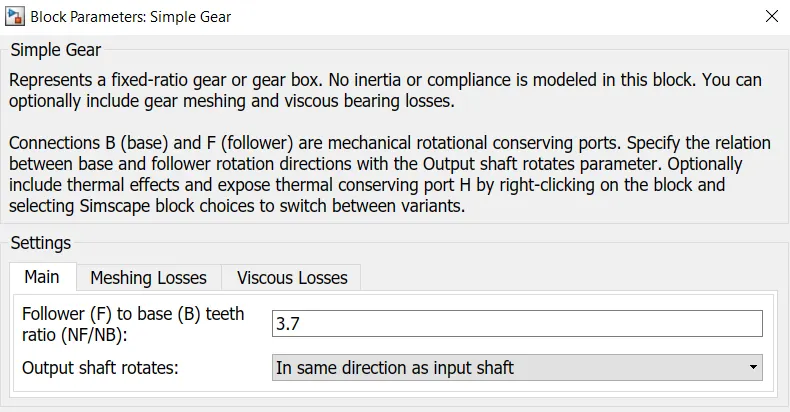
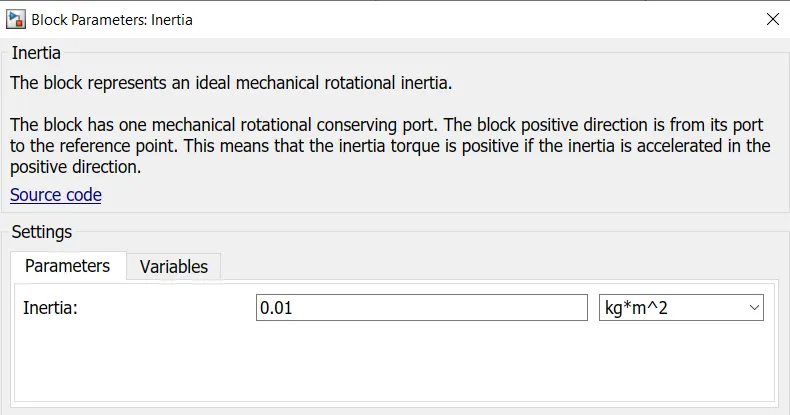
- Inertia:

- The Inertia block represents an ideal mechanical rotational inertia.
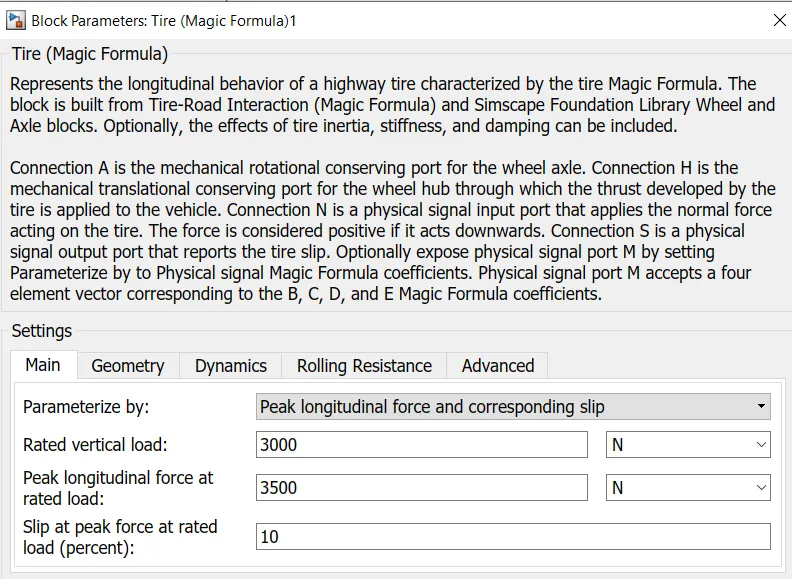
- Tire (Magic Formula):
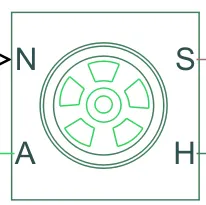
- The Tire (Magic Formula) block models a tire with longitudinal behavior given by the Magic Formula an empirical equation based on four fitting coefficients. The block can model tire dynamics under constant or variable pavement conditions.
- Vehicle Body:
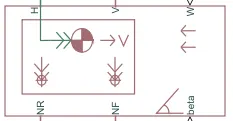
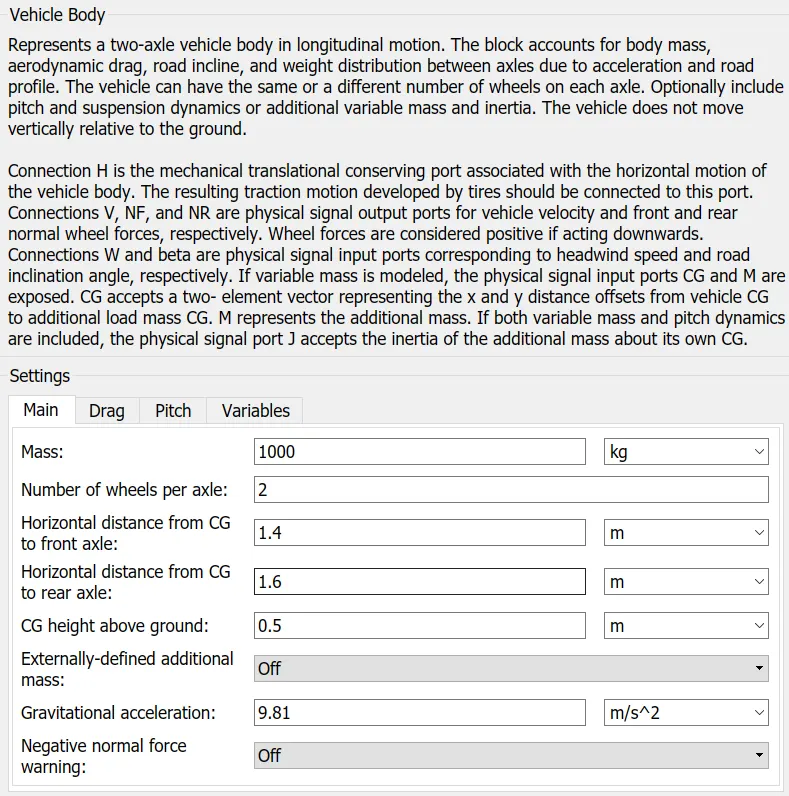
- The Vehicle Body block represents a two-axle vehicle body in longitudinal motion. The vehicle can have the same or a different number of wheels on each axle. For example, two wheels on the front axle and one wheel on the rear axle. The vehicle wheels are assumed identical in size. The vehicle can also have a center of gravity (CG) that is at or below the plane of travel.
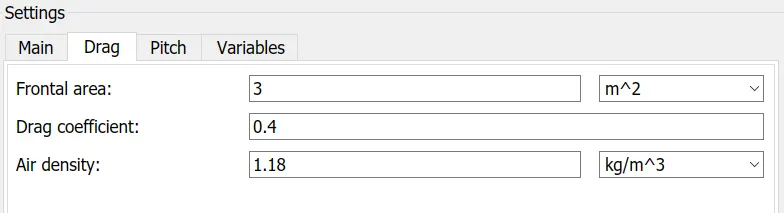
- The block accounts for body mass, aerodynamic drag, road incline, and weight distribution between axles due to acceleration and road profile. Optionally include pitch and suspension dynamics. The vehicle does not move vertically relative to the ground.
- The block has an option to include an externally-defined mass and an externally-defined inertia. The mass, inertia, and center of gravity of the vehicle body can vary over the course of simulation in response to system changes.
- Distance Calculation:
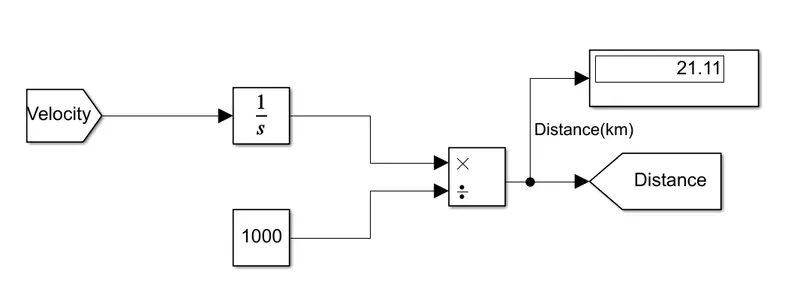
- The Velocity from the vehicle body is taken and integrated using integrator block,and then it is divided with 1000 to convert Meter to Km.
- Power Calculation:
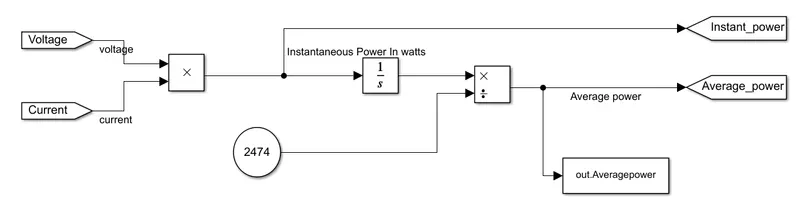
- Voltage and current are taken fron the supply to the motor, then they are multiplied together to get instantaneous power, the result is divided by time to get average power.
Result:
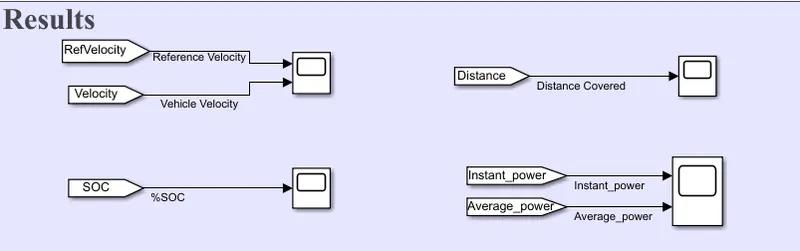
Dashboard:
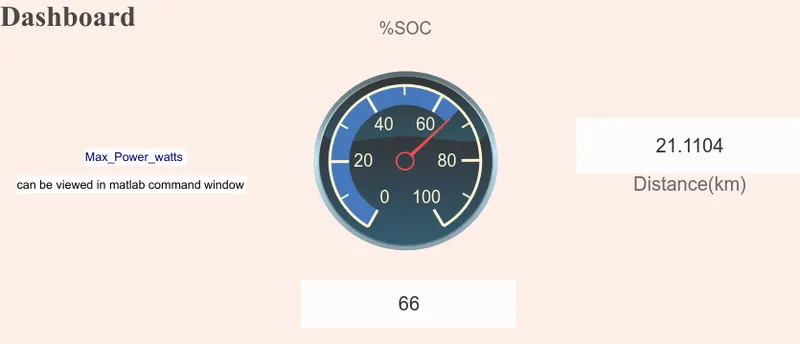
Result Plots:
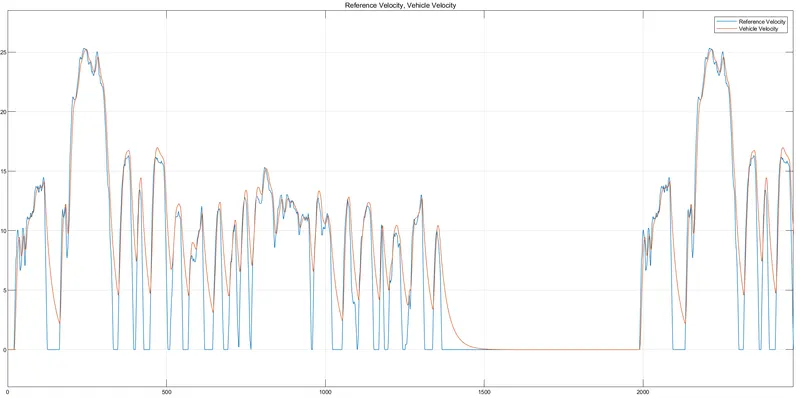
- Reference Velocity (Drive cycle) vs Vehicle velocity:
- %SOC:
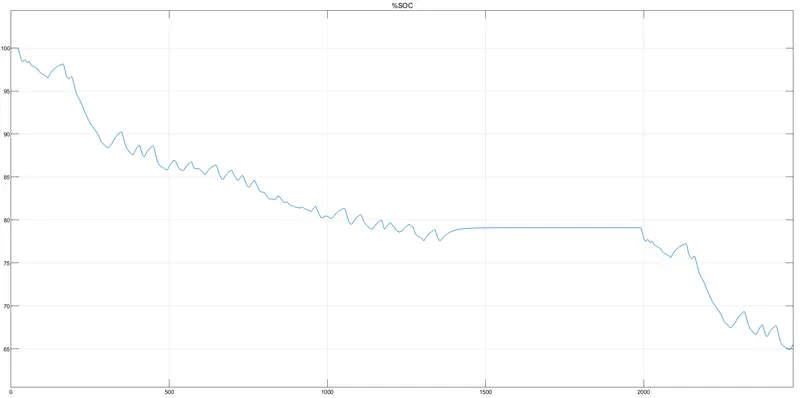
- By the end of the simulation the SOC is around 66%.
- Dristance Convered:
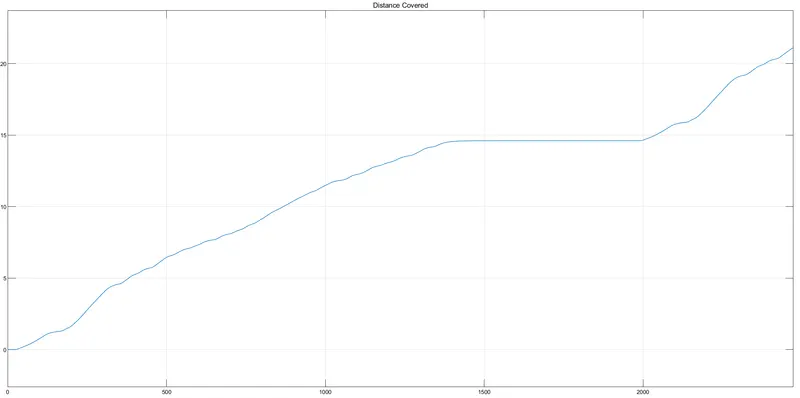
- By the end of the simulation the distance covered is 21.11 km
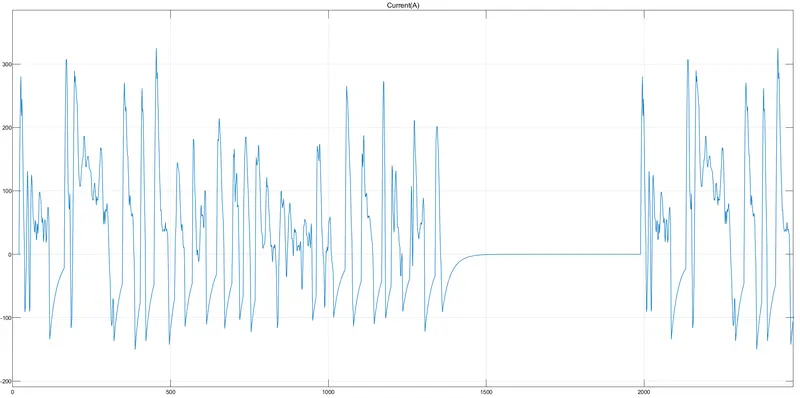
- Current (A):
- Instantaneous power and Average power:
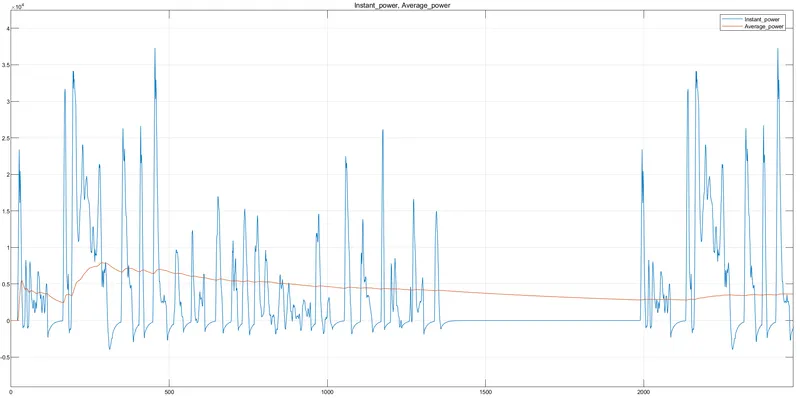
- Max Average power is 7.9kw.
Conclusion:
- From the input vs output velocity graph we can see that the EV model that is designed had traced the FTP 75 drive cycle very closely.
- Now looking at the SOC graph we can see that almost 50% of the battery capacity is used for completing this drive cycle. some spikes represents the regenerative braking region. During which the SOC value increases.
- And from the Current variation graph, we can see that the maximum current value during normal driving is around 300A and during regenerative braking the maximum current value reached is near to 150A, this might have limitations form the battery.