Final Project: Design of an Electric Vehicle
Design of an Electric Vehicle
AIM: To create a MATLAB model of an electric car which uses a battery and a DC motor
OBJECTIVE:
1. System-level configurations
2. Model parameters
3. Results
4. Conclusion
INTRODUCTION:
The electric vehicle (EV) is one that operates on an electric motor instead of an internal combustion engine (ICE) that generates power by burning a mix of fuel and gases. EVs use electricity to charge their batteries instead of using fossil fuels like petrol or diesel. They use an electric motor for propulsion. The most commonly used motors are three-phase induction motors and permanent magnet synchronous motors.
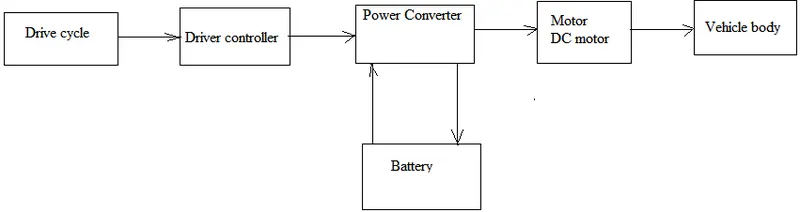
Fig. 1: Block diagram of EV components
The main components used in modelling EV are:
1. Drive cycle:
- It is the series of data points that represent the speed of a vehicle versus time.
- They are produced by different countries and organizations to assess the performance of vehicles in various ways, such as for instance fuel consumption, and polluting emissions.
2. Driver controller:
- This unit manages the flow of electrical energy delivered by the traction battery, controlling the speed of the electric traction motor and the torque it produces.
3. Power converter:
- It is used to process and control the flow of electric energy by supplying voltages and currents in a form that is optimally suited for the user loads.
4. Electric motor:
- Using power from the traction battery pack, this motor drives the vehicle's wheels.
- Some vehicles use motor generators that perform both the drive and regeneration functions.
5. Vehicle body:
- It accounts for body mass, aerodynamic drag, road incline, and weight distribution between axles due to acceleration and road profile.
- Optionally include pitch and suspension dynamics.
- The vehicle does not move vertically relative to the ground.
6. Battery:
- It stores electricity for use by the electric traction motor.
- In an electric drive vehicle, the auxiliary battery provides electricity to power vehicle accessories.
SIMULATION MODEL:
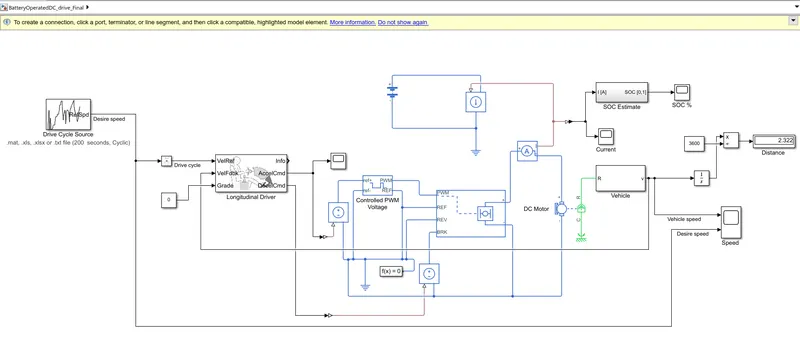
Fig. 2: A simulation model of an Electric car
The simulation uses the following blocks:
1. Drive cycle source:
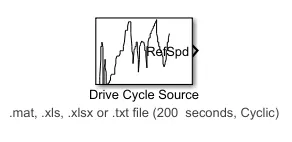
- The Drive Cycle Source block generates a standard or user-specified longitudinal drive cycle.
- Drive cycles from predefined sources. By default, the block includes the FTP-75 drive cycle.
- Drive cycle can also use workspace variables that define our own drive cycles.
- Drive cycle can also use .mat, .xls, .xlsx. or .txt files.
- It can also use Wide-open throttle (WOT) parameters, including initial and nominal reference speed, deceleration start time, and final reference speed.
- The drive cycle used in this model is https://docs.google.com/spreadsheets/d/1Ast6y5-n4vYD5JDEtUYKDnndeiMIQ2f0/edit?usp=sharing&ouid=118057706515678682705&rtpof=true&sd=true and is shown in Fig.3.
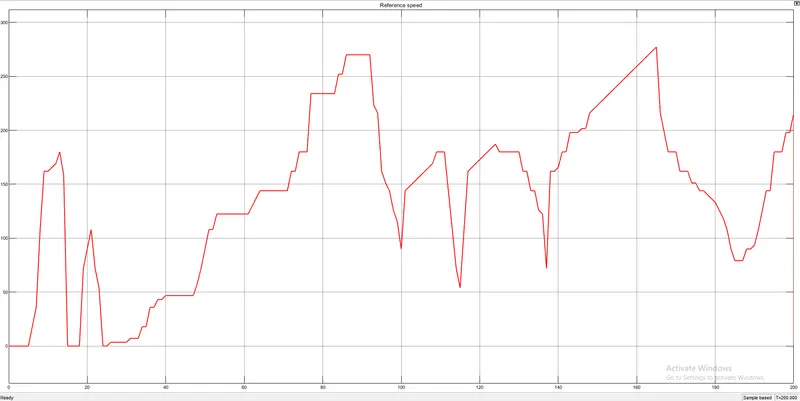
Fig. 3: Drive cycle plot
2. Longitudinal driver:
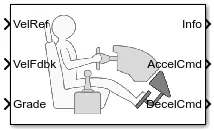
- The Longitudinal Driver block implements a longitudinal speed-tracking controller.
- Based on reference and feedback velocities, the block generates normalized acceleration and braking commands that can vary from 0 through 1.
- This block can be used to model the dynamic response of a driver or to generate the commands necessary to track a longitudinal drive cycle.
3. Controlled voltage source block:

- It represents an ideal voltage source that is powerful enough to maintain the specified voltage at its output regardless of the current flowing through the source.
- The output voltage is V = Vs, where Vs is the numerical value presented at the physical signal port.
- The block has one physical signal input port and two electrical conserving ports associated with its electrical terminals.
4. Controlled PWM voltage block:

- It represents a pulse-width modulated (PWM) voltage source.
- It calculates the duty cycle based on the reference voltage across its ref+ and ref- port.
- The output voltage is zero when the pulse is low and is equal to the output voltage amplitude parameter when high.
5. Simulink-PS Converter block:

- It converts the input Simulink signal into a physical signal.
- It is used to connect Simulink sources or other Simulink blocks to the inputs of a Physical Network diagram.
6. PS-Simulink Converter block:

- It converts a physical signal into a Simulink output signal.
- It is used to connect outputs of a Physical Network diagram to Simulink scopes or other Simulink blocks.
7. Controlled current source block:

- It represents an ideal current source that is powerful enough to maintain the specified current through it regardless of the voltage across the source.
- The output current is I = Is, where Is is the numerical value presented at the physical signal port.
- The positive direction of the current flow is indicated by the arrow.
8. DC motor block:

- It represents the electrical and torque characteristics of a DC motor.
- It is used to convert electrical energy to mechanical energy.
- This can act as a generator in the case of regenerative braking.
- This block assumes that no electromagnetic energy is lost and hence the back-emf and torque constants have the same numerical value when in SI units.
- Motor parameters can either be specified directly or derived from the no-load speed and stall torque.
9. Battery block:

- The Battery block represents a simple battery model.
- It models the battery as a series internal resistance and a constant voltage source.
10. Vehicle body block:
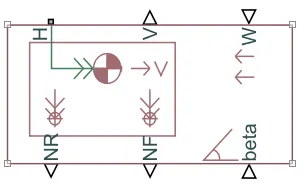
- It represents a two-axle vehicle body in longitudinal motion.
- The vehicle can have the same or a different number of wheels on each axle.
- For example, two wheels on the front axle and one wheel on the rear axle.
- The vehicle wheels are assumed identical in size.
- The vehicle can also have a center of gravity (CG) that is at or below the plane of travel.
- The mass, inertia, and center of gravity of the vehicle body can vary over the course of simulation in response to system changes.
11. H-Bridge block:
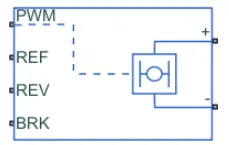
- The H-Bridge block represents an H-bridge motor driver.
- It is used to change the polarity of the voltage applied across the DC motor so as to run the motor in forward and reverse directions as per the input command.
12. State of charge (SOC) subsystem:
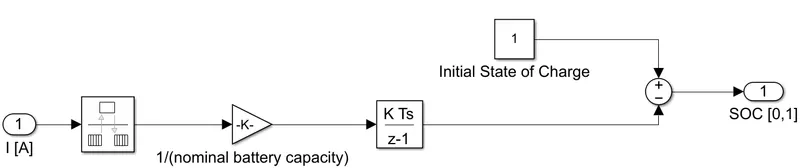
- The input to this subsystem is a current sensor and is connected to the rate transition block.
- A gain block is connected to the discrete integrator. This will accumulate the input signal.
- The output of the discrete integrator is subtracted from 1 to obtain the SOC and the plot of SOC is seen in the scope.
13. Gear block:
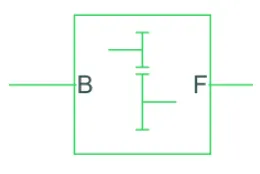
- It is a simple fixed-ratio gear or gearbox.
- The follow-to base teeth ratio is set as 3.7 and the output shaft rotates in the same direction as that of the input shaft.
14. Tire block:
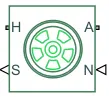
- Simple gear is connected to all 4-wheels representing an all-wheel-drive vehicle
- Consider 4 tires, where 2 act as rear wheels and 2 act as front wheels.
- 2-wheels are connected to the gearbox to which input power is coming from the motor shaft.
RESULTS:
1. Plot of reference speed and actual vehicle speed:
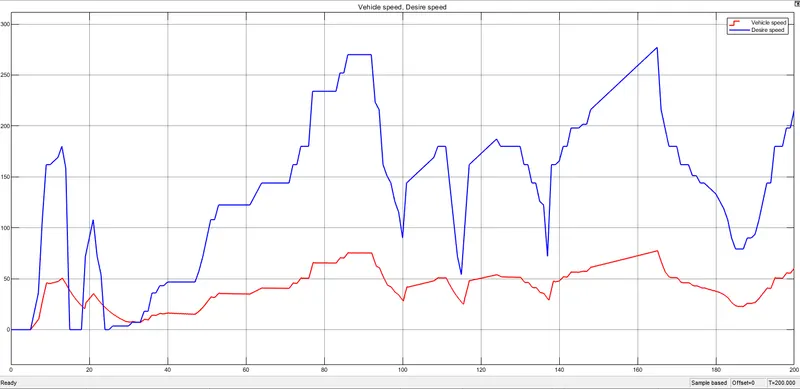
Fig. 4: Plot of reference speed and actual vehicle speed
- In Fig. 4 there is a difference between the reference speed and the actual vehicle speed graph.
- It is because the battery capacity and the motor do not meet the required propel.
- If the battery capacity is higher the actual speed may tend to match with reference speed.
- The maximum speed of the electric car is around 77 m/s.
2. Distance from scope:
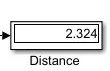
- The total distance covered by the electric car is 2.322 km as seen in the display block.
3. Current signal:
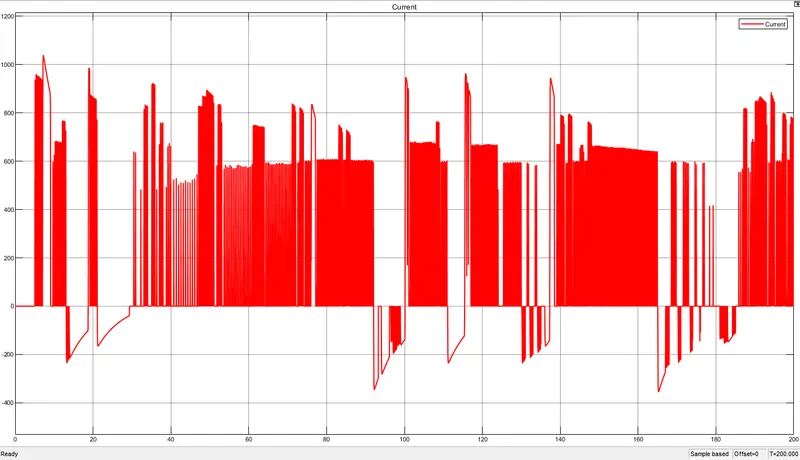
Fig. 5: Current Signal
- The current signal is varying from the battery to the motor for the drive cycle data as shown in Fig. 5.
- The spikes on the upper side are due to the acceleration of the vehicle and the spikes on the downward are due to deceleration.
4. Plot of SOC of battery:
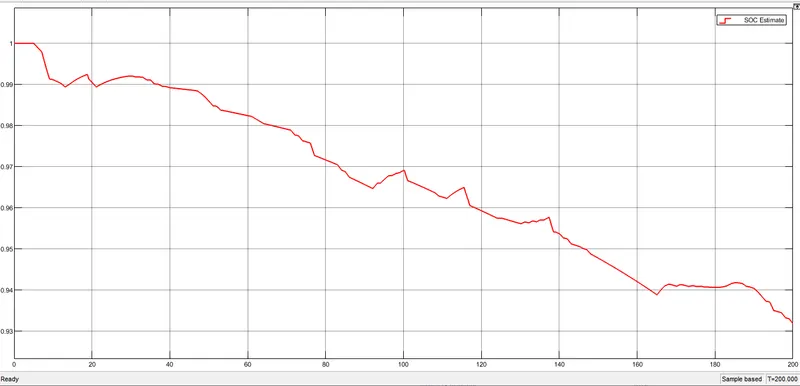
Fig. 6: Plot of SOC of battery
- Fig. 6 shows the state of charge of the battery.
- Battery capacity is 100% at the starting and to complete the drive cycle data it is discharged by 7% in 200s.
- At the end of the simulation, the SOC of the battery is 93%.
- This means that the battery is not completely drained and the vehicle can still run on the same drive cycle a few more times.
CONCLUSION:
The Simulink model is created using a new drive cycle in an excel file. The distance travelled is 2.322 km. By changing the parameters like battery capacity and model, vehicle body etc. we get different results and distance covered. The model is depending upon many parameters such as drive cycle, nominal speed, battery model, rated speed, output voltage amplitude etc. The maximum current value during normal driving is 1040A and during regenerative braking, it reaches 355A. Battery capacity is 100% at the starting and to complete the drive cycle data it is discharged by 7% in 200s.