Final Project: Design of an Electric Vehicle
Design of an Electric Vehicle
Electric Vehicle Model:
This model and project pertains to the modeling of a working Electric vehicle in simulink and with the help of parameterization in MATLAB.
The main aim of the project is to understand the working of Electric vehicle with the help of a DC motor and various parts the electric vehicle would use for it to run perfectly.
LITERATURE:
An electric vehicle (EV) is a vehicle that uses one or more electric motors or traction motors for propulsion. An electric vehicle may be powered through a collector system by electricity from off-vehicle sources, or may be self-contained with a battery, solar panel or a generator to convert fuel to electricity. EVs include, but are not limited to, road and rail vehicles, surface and underwater vessels, electric aircraft and electric space craft.
When electricity was among the preferred methods for motor vehicle propulsion, providing a level of comfort and ease of operation that could not be achieved by the gasoline cars of the time. Modern internal compulsion engines have been the dominant propulsion method for motor vehicles for almost 100yeras, but electric power has remained commonplace in other vehicle types, such as trains and smaller vehicles of all types.
There are many ways to generate electricity, of varying costs, efficiency and ecological desirability.
- Connection to generator plants
- Onboard generator and Hybrid EVs
- Onboard storage: Fuel Electric vehicles and batteries.
Lithium Ion Battery:
Most Electric Vehicles use Lithium Ion Batteries (LIB’s), Lithium Ion Batteries have higher energy density, longer life span and higher power density than most other practical batteries. Complicating factors include safety, durability, thermal breakdown and cost. Li-ion batteries should be used within safe temperature and voltage ranges in order to operate safely and efficiently. Increasing Battery lifespan decreases effective costs. One technique is to operate a subset of battery cells at a time and switching these subsets. These battery types are considered out-sated due to their tendencies to self discharge in the heat. Also batteries patent was held by chevron which created a problem for their widespread development. These detractors coupled with their high cost have led to Lithium-ion (LI-ion) batteries leading as the predominant battery for EVs.
Electric Motor:
The power of a vehicle’s electric motor, as in other vehicles, is measured in kilowatts (KW). 100Kw is roughly equal to 134Hp, but electric motors can deliver their maximum torque over a wide RPM range, this means that the performance of a vehicle with a 100kw internal compulsion engine, which can Only delivers its maximum torque within a limited range of engine speed. Energy is lost during the process of converting the electrical energy into mechanical energy. The energy from the battery is converted to mechanical energy, the losses being in the motor and drive train.
Usually, direct current (DC) electricity is fed in to a DC/AC inverter where it is converted to alternating current (AC) , electricity and this AC electricity is connected to a 3-phase AC motor. For electric trains, and some electric cars, DC motors are often used, in some cases, universal motors are used, and then AC or DC may be employed. In recent production vehicles, various motor types have been implemented, for instance induction motors with in Tesla motor vehicles and permanent magnet machines in the Nissan leaf and Chevrolet bolt.
Configuration and Block Used:
There are numerous blocks used in this model. Some of the blocks are joined together to make a subsystem as well. These blocks are either or simscape or physical system blocks.
- Vehicle Body Block
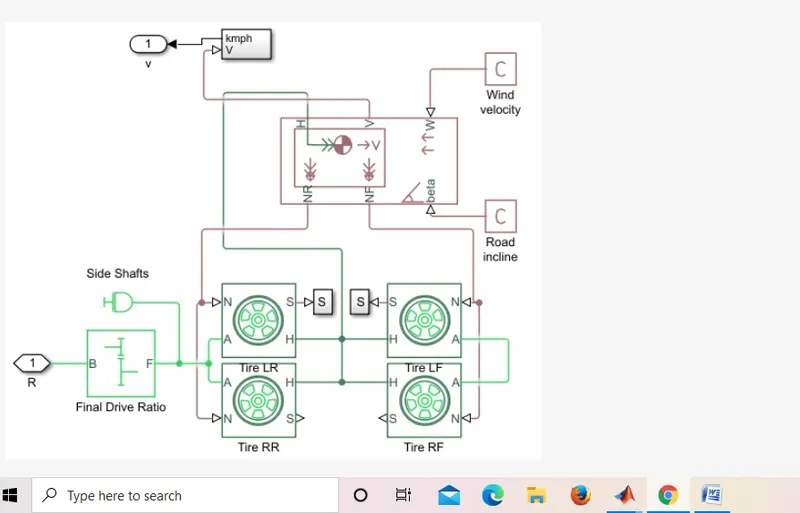
This is the basic block that we have used in the Model. This block is consists of 4 tires of the electric vehicle and vehicle body
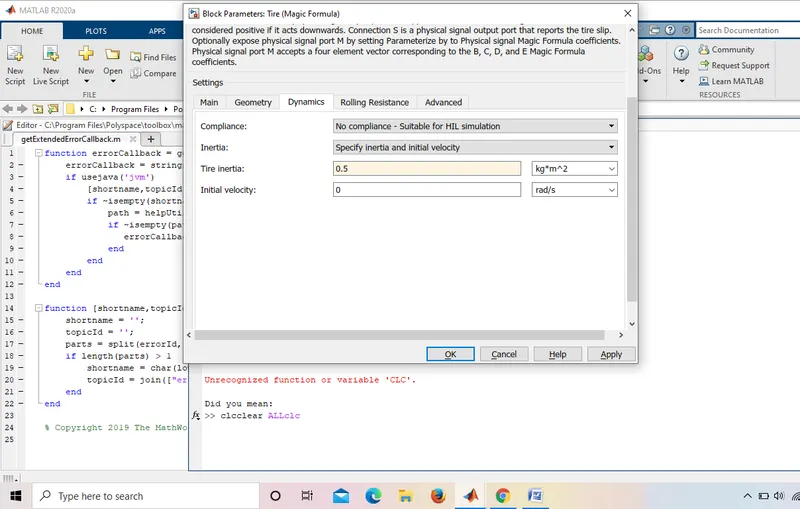
In this model we have used a simple gear to connect with the Axles. The tire has 4 input for them, these are
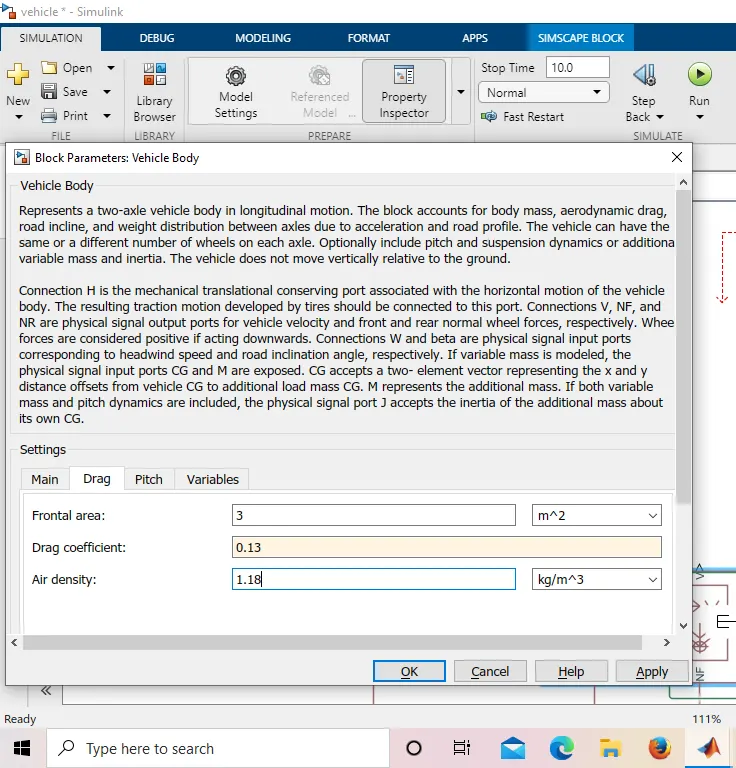
A – Axles
S –Slip
H- Hub
N- Normal Face
These tires are then connected to the vehicle body.
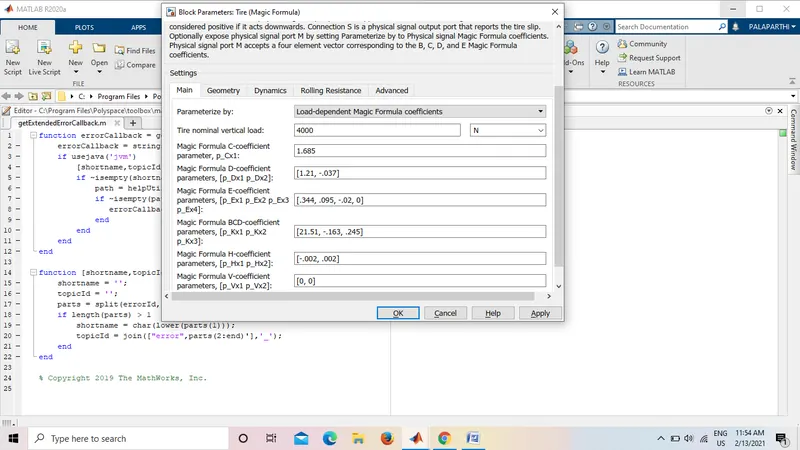
The Vehicle as we can see in figure 2 has various inputs that can be modeled for the vehicle to have a basic step. It consists of
- NR – Normal Force Rear
- NF – Normal Force Front
- H – Hub connection
- v- Speed of vehicle body
- Beta – The grade if the vehicle has
In this model I have put a wind velocity at a constant of 2m/s and the grade to be constant zero throughout the cycle.
In the vehicle body model we have to connect simple gear system to transmit the power from the motor to wheels, this gear has specific gear ratio that is predefined.
- Motor:
For this model I have used simple Brushed DC Motor.
- a) Armature Inductance:
The inductance of armature is the reason why the power of a motor can be smaller than the products of RMS voltage and RMS current, and a power factor need to be applied. Basically means that the armature inductance measures the amount of power required by the motor to be delivered to the wheels. This power may be very small as to move a vehicle or very high as to move the vehicle at top speed. Basically armature is the moving part of the motor produces the EMF which turns power to the motor.
- b) Torque Constant:
This is basically the torque of motor is limited to produce in a hour.
- PWM Averaged Model:
For any motor to run we need a controller the voltage and current supply from the battery. For this model i have used a PWM averaged model that takes the input from the duty cycle and feedback from the longitudinal driver.
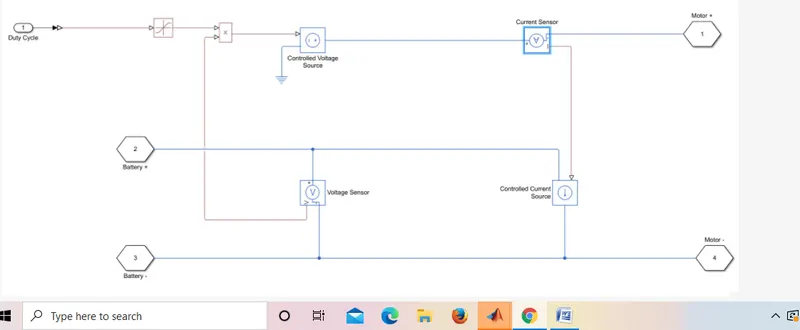
This average model also consists of parts for connections of the battery pack and the motor.
In the block we have used controlled voltage and current source for the motor output. A voltage sensor has also been used here for sensing the battery voltage at any given pint of time, One of the connection port leads to an output to the duty cycle through the driver model.
- Longitudinal Driver:
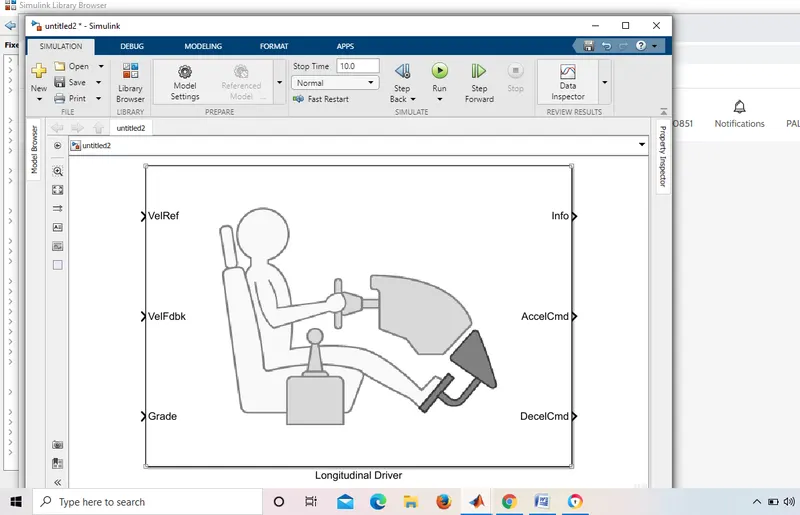
This model consists of the commands that a drive will give to the vehicle and based on those commands the various scopes are added to monitor output from the driver. This block is called as longitudinal driver.
This block takes various parameters as reference to the vehicle, like Velfdbk and Velref.
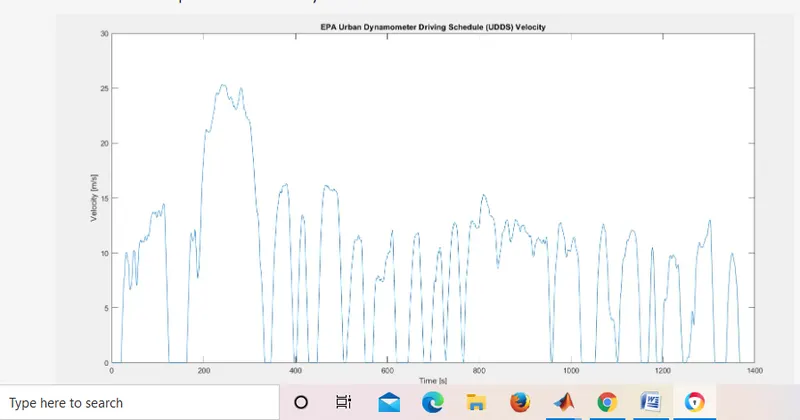
The VelRef takes the input from the drive cycle that we use of the simulation. For this simulation of electric vehicle we have used as UDDS Cycle.
- Battery Pack:
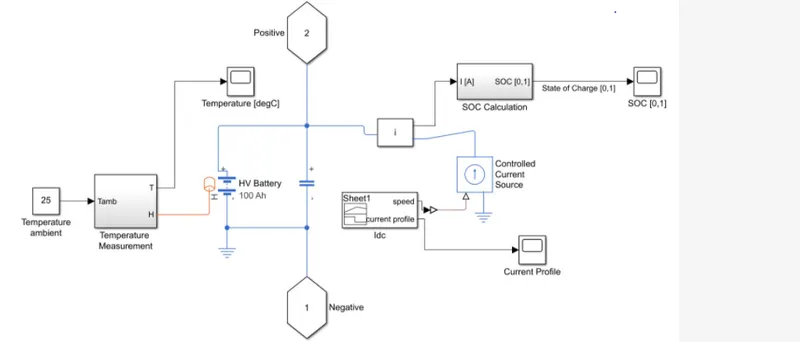
For this Electric Vehicle model i have used lithium ion discharge charge battery. This battery has many sensors such as temperature sensor SOC condition etc.
For this battery pack we have also some parameters that make this battery pack suitable for Electric Vehicle.
Results:
- For the results we have attached so many output capturing scopes in the model. For these outputs we need to make sure that we have proper connections.
We have used a normal body subsystem that has two outputs connecting to the motor and to a feedback scope.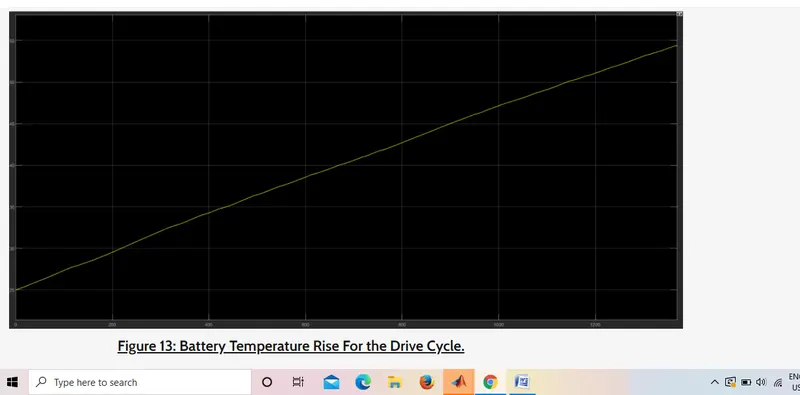
In the above figure we can seen that the body is connected to the motor via the rotor output. This R output is connected to the simple gear we have used in the body subsystem. The case is connected to a mechanical reference so as to show stationary nature of the motor. The speed connection of the motor is then connected to a scope and to a integrator and divider block that gives us the distance output that the vehicle will run for the given drive cycle.
- When we move onto the battery, there are a lot of areas where we can analyze the battery for better results. Some of the areas I have covered in the results of this analysis. I have used temperature measurement block that takes the input of ambient temperatures of the battery, and applied a scope to the output. Check the thermal management of the battery.
For an average battery under constant operation it should heat up to a maximum of 45degrees for charging and 60 degrees for discharging. For this battery pack the discharging temperature reached up to maximum for 52degrees.Pertaining to the fact that this result is more than sufficient for the analysis we need to consider the result for particular drive cycle and a normal speed.
We can check the varying discharge temperature using other drive cycle or using a signal builder battery to the high speeds.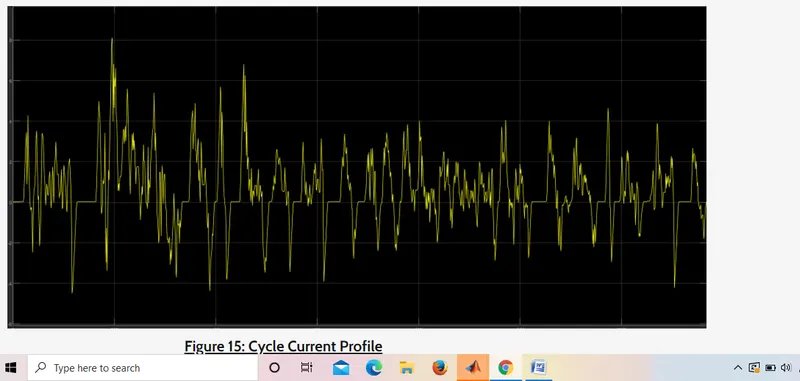
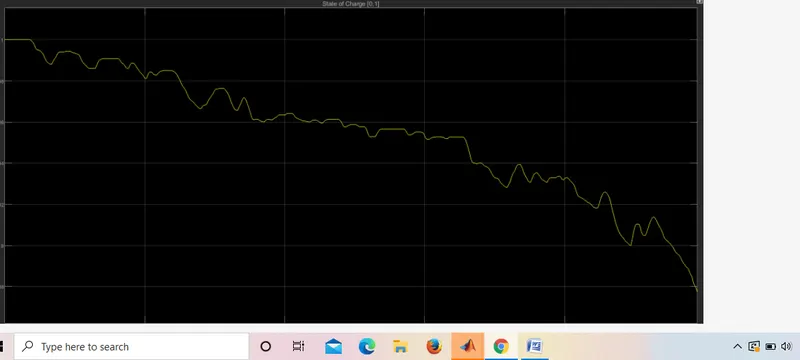
- For the state of the charge, we can observe some dips and some constant regions. These dips are mainly observed on acceleration feedback the longitudinal driver to the PWM averaged block and to the battery. The constant regions in the SOC graph we are the areas where the battery is in regenerative braking or in the deceleration feedback mode. The ups in the graphs are due to charging of the battery.
Regenerative Braking is an energy recovery mechanism that slows down a moving vehicle or object by converting its kinetic energy into form can be either used immediately or stored until needed. In this mechanism, the electric traction uses the vehicle’s momentum to recover energy that would otherwise be lost to brake discs as heat. This contracts with conventional braking system, where the excess kinetic energy converted to unwanted and wasted heat due to friction in the brakes, where the energy is recovered by using electric motors as generators but it is life of braking system as mechanical parts will not out very quickly.
From the battery block we can also observe the current profile for UDDS cycle.
- For the acceleration and deceleration of the graph cycle we know that the vehicle has accelerated or decelerated at many time stamps. Basically the driver has pressed the accelerator and decelerator many times during the driver cycle. May be the traffic situations where they needed to brake and move forward on simulation occasions.
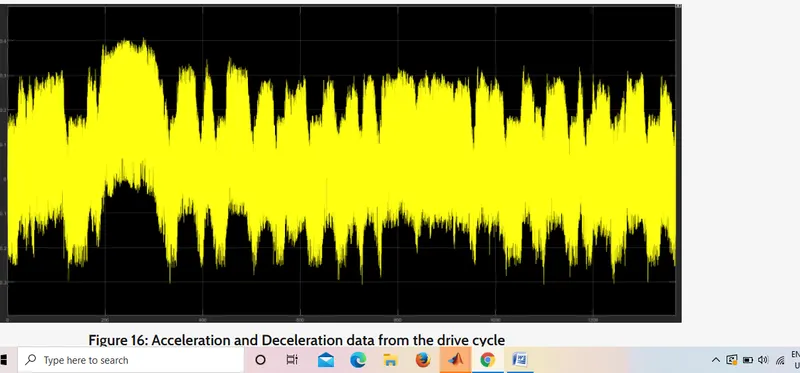
We can observe that the data is scattered due to the multiple uses of throttle and brake.
- For the main output we have put a scope with two inputs. One input is vehicle feedback and another one is speed of the vehicle. For the simulation of the vehicle to run perfectly we need a match on the drive cycle for the position and speed.
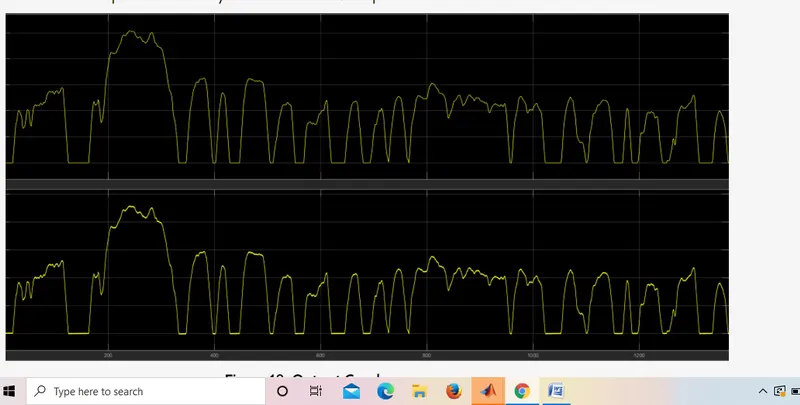
The maximum speed the drive cycle can attain is 93kmph.
From the graph we can seen that the Drive cycle (Upper Window) is almost identical to the speed output we get from the simulation.
We can also observe some noise in the speed gr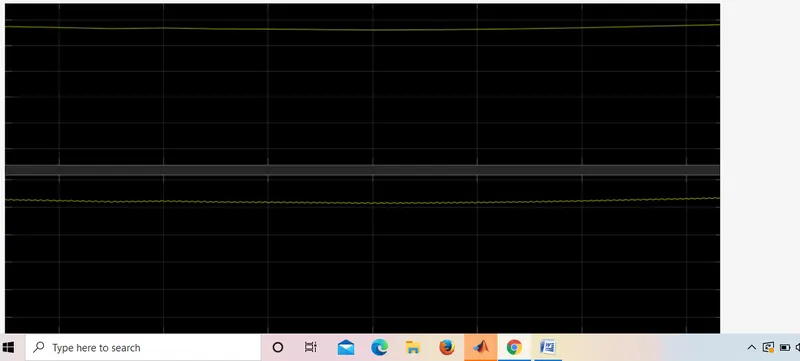 aph.
aph.
The noise is observed due to the wind speed we have mentioned in the vehicle body system. For a normal drive cycle the wind velocity is neglected but we have taken in to account a 2m/s wind velocity to our simulation. Due to the hindrance caused by the wind in the motion, our vehicles try to keep the graph at a constant with compliances of the drive cycle.
The model has been analyzed in the simulation and the results have been mentioned.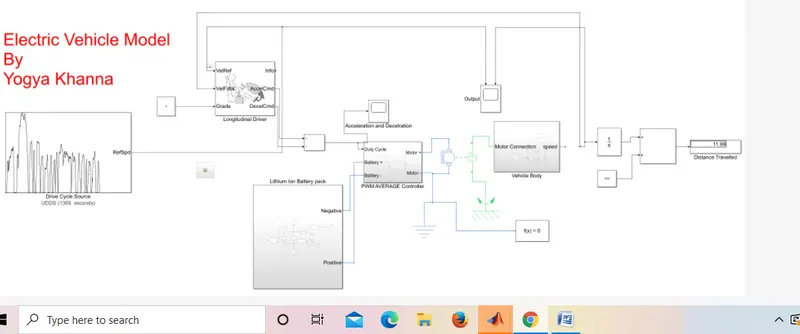
Conclusions:
The model has been made and the simulation has also been run. We can conclude that the model is depended on many factors like drive cycle, Battery modeling, vehicle parameters etc.
These factors can be altered in the future to make a even more efficient electric vehicle that would run or more complex cycles with better battery management systems and even more powerful motor.