Final Project: Design of an Electric Vehicle
Final Project: Design of an Electric Vehicle
Aim:-
- To create a Simulink model of electric car which uses a battery and a DC motor.
- To check for which motor rating value, the actual drive cycle will match with loaded drive cycle.
Explanation:-
Actually, we can say that there are mainly 4 types of vehicles are used in today's world. such as:-
- BEV (Battery Electric Vehicle)
- HEV ( Hybrid Electric Vehicle)
- PHEV (Plug-in Hybrid Electric Vehicle)
- ICEV (Internal Combustion Engine Vehicle)
- for detail explanation, we can simply say that BEV is the Pure Electric Vehicle, but HEV is the Hybrid electric vehicle which run by the combination of both Electric battery & Conventional energy sources such as petrol, diesel, gasoline etc.
- Plug-in Hybrid electric vehicle is also simillar as HEV but the main difference between these two vehicles are PHEV consists of charging port for the recharge process of battery pack where as the HEV doesn't consists.
- ICEV are the Internal combustion engine vehicles which are operated by the combustion of Conventional energy sources such as Petrol, diesel, gasoline etc.
- The main advantages of BEV over all vehicles are it gives high efficiency,zero CO2 emission on road & the main disadvantage is it has lower energy density of battery pack.
- For this project, we have create an Battery Electric Vehicle (BEV) by using simulink.
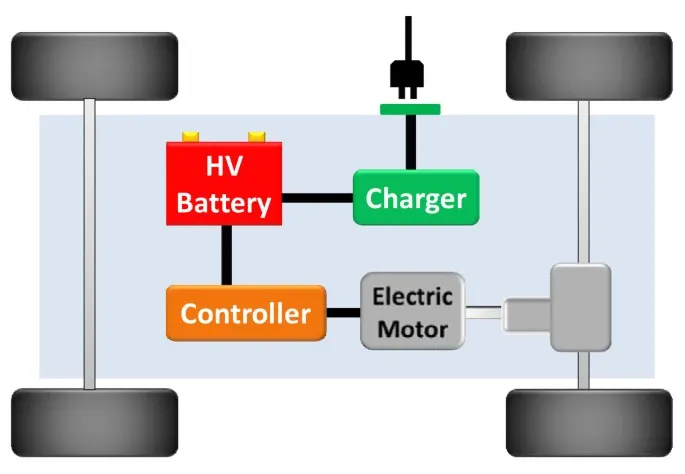
- before that, we have to understand the architechture of BEV which is given as follows:-
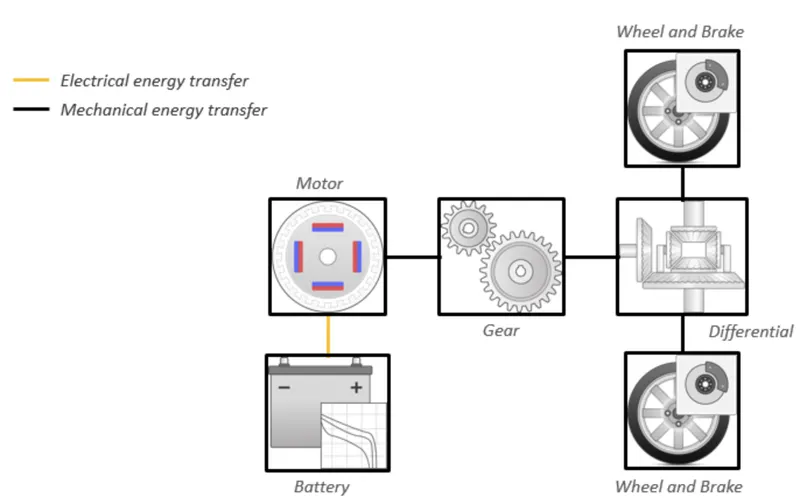
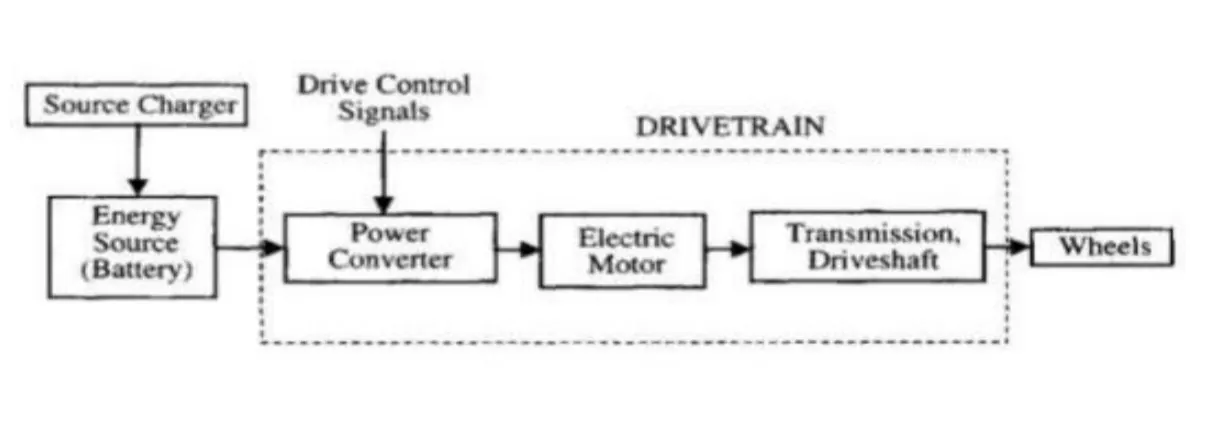
- From the above architechture, we can simply say that, BEV is consisting of Electric battery pack, Electric Motor, Simple gear box & transmission system which consists of the wheels.
- here Yellow line shows the electrical connection between two parts & the black line shows the mechanical connection between two parts.
- which means that, the motor is connected with the battery by yellow lines which indicates that, the battery is providing the electric power supply to the motor & the gear box is connected with the motor by a black line which indicates that,there is no electric supply between motor & gear box.
- Battery can be charged either by the chrager connected in the charging station or by the regenerative braking process.
- Motor reverse it's direction of rotation when regenerative braking process takes place i.e:- at that time motor acts as generator.
- All electrical process & the conversion of motor into generator is controlled by Controller.
System level Configuration:-
There are some major components are used in the creation of BEV such as:-
- Drive cycle
- Longitudinal Driver
- Controlled PWM Voltage
- H-Bridge
- DC motor
- Vehicle Body
- Tire (Magic Formula) & others
Block Diagram:-
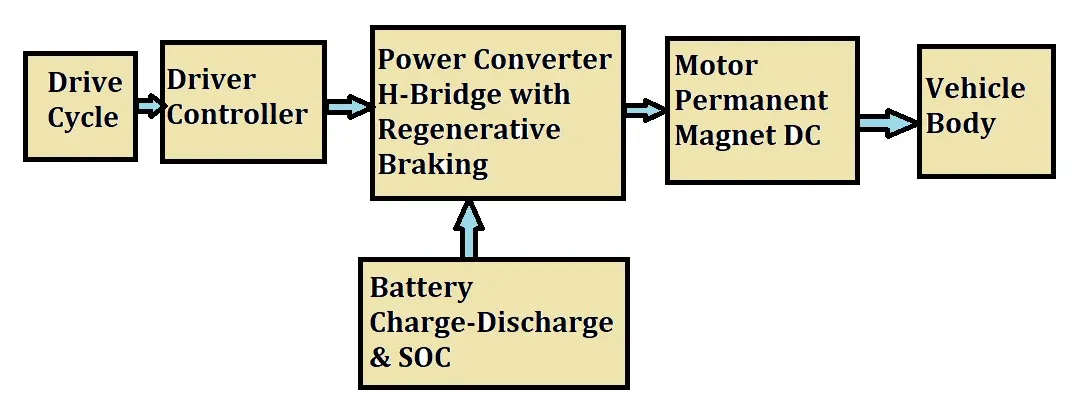
- By considering the above block diagram of BEV we have craeted a simulink model as follows:-
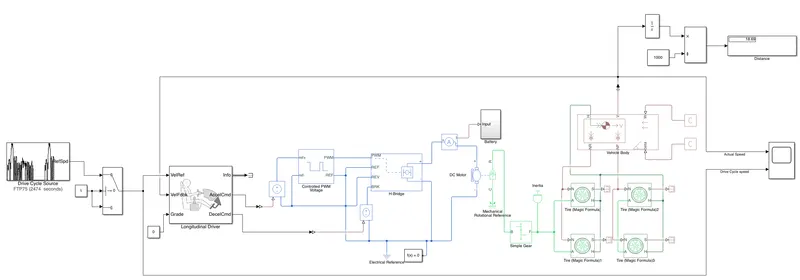
- 1st we have to choose a drive cycle which is controlled by driver controller (Longitudinal driver).
- Acoording to the command of the driver the Controlled PWM Voltage & H-Bridge will controll the electrical operations like the how much supply should be flow from battery to the DC motor & the regenerative braking process. bacically we have used the Controlled PWM voltage block & H-Bridge block in the place of controller.
- Then the DC motor is connected with the H-brige & the vehicle is connectrd with the DC motor through Simple gear.
- The vehicle is consisting of Vehicle body, 4 no. of Tire (magic Formula).
Simulink Model Explanation:-
- In order to explain the Simulink model connections, we have to explain the different parameters.
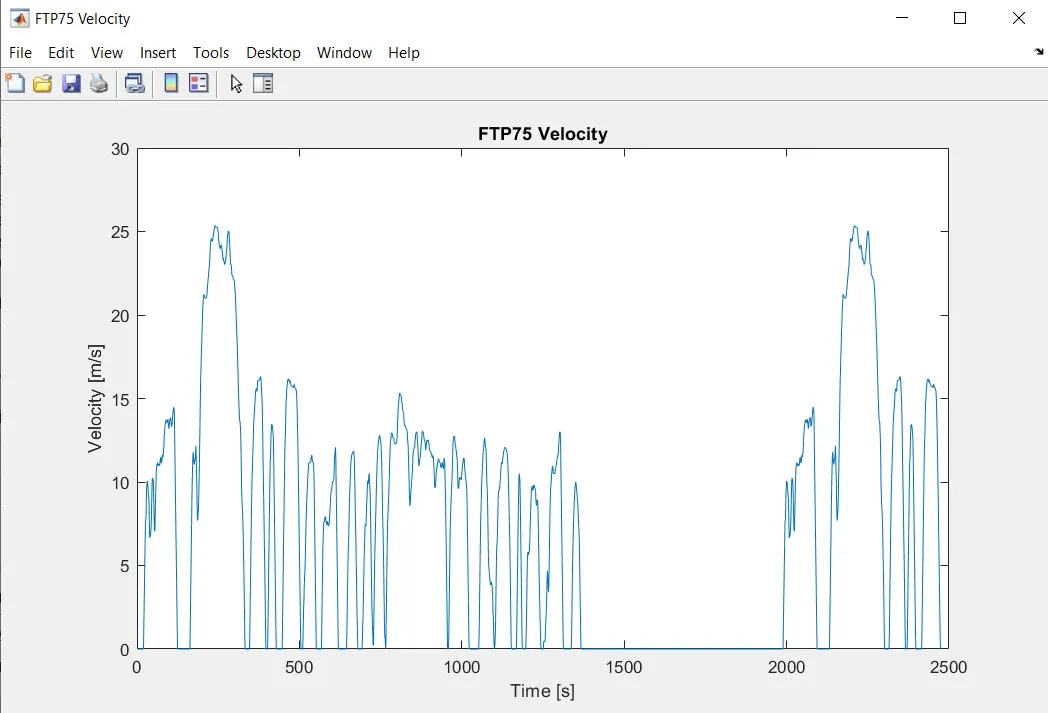
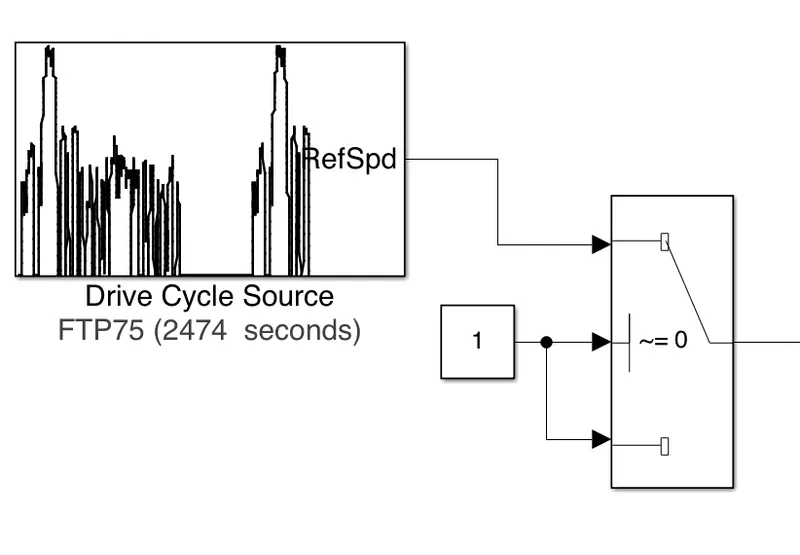
- Starting with Drive Cycle, here we have used the FTP75 Drive Cycle.
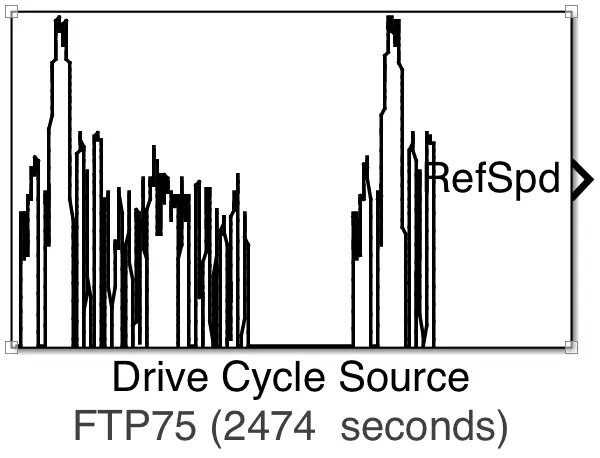
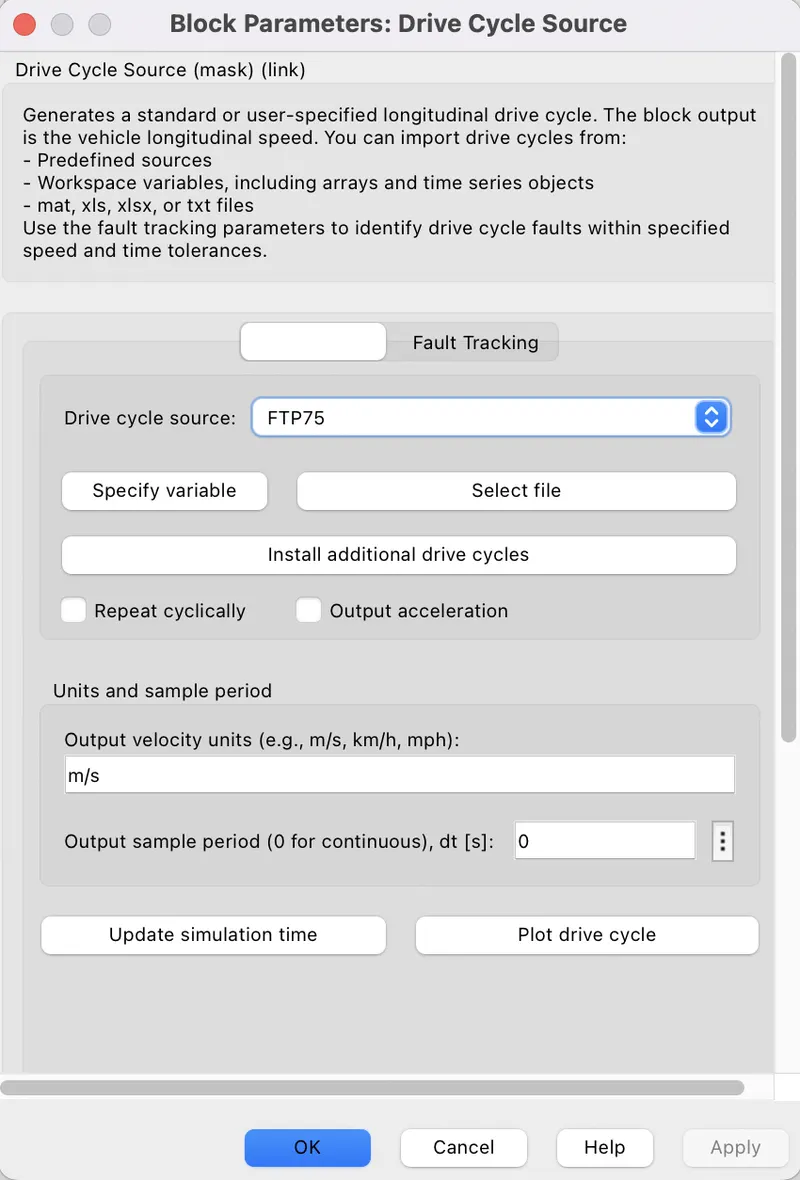
- Here FTP75 Drive Cycle consists of test duration time of 2474 Sec.
(2) Switch Block:-
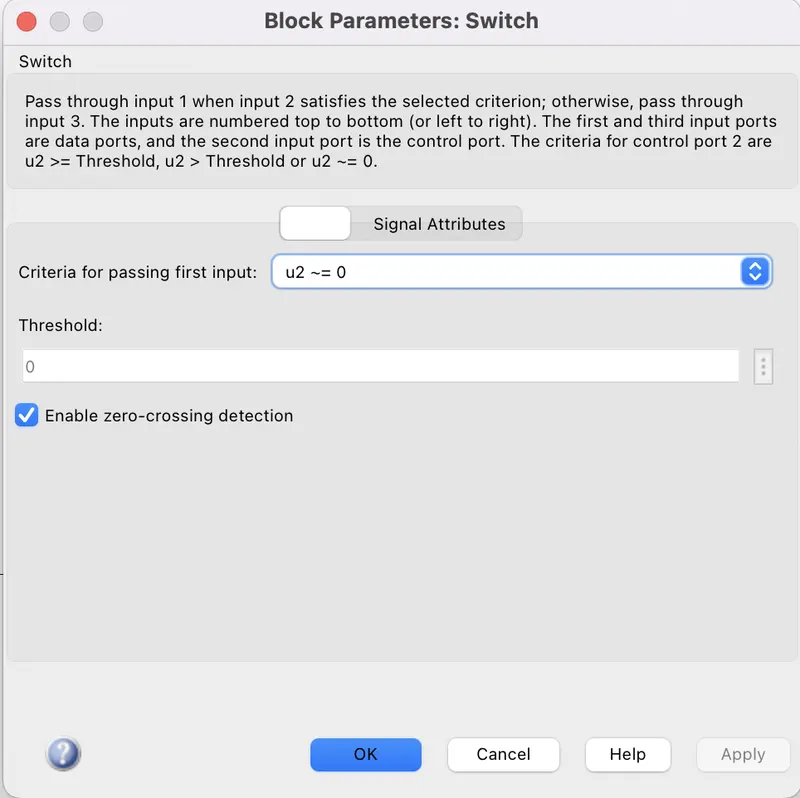
- Here we have connected drive cycle with the input 1 & input 2, input 3 are connected with constant block having value 1.
- we have choosed the Criteria for passing of 1st input is Threshold ~=0 so that the switch block will give input 1 as output.
(3) Longitudinal Driver:-
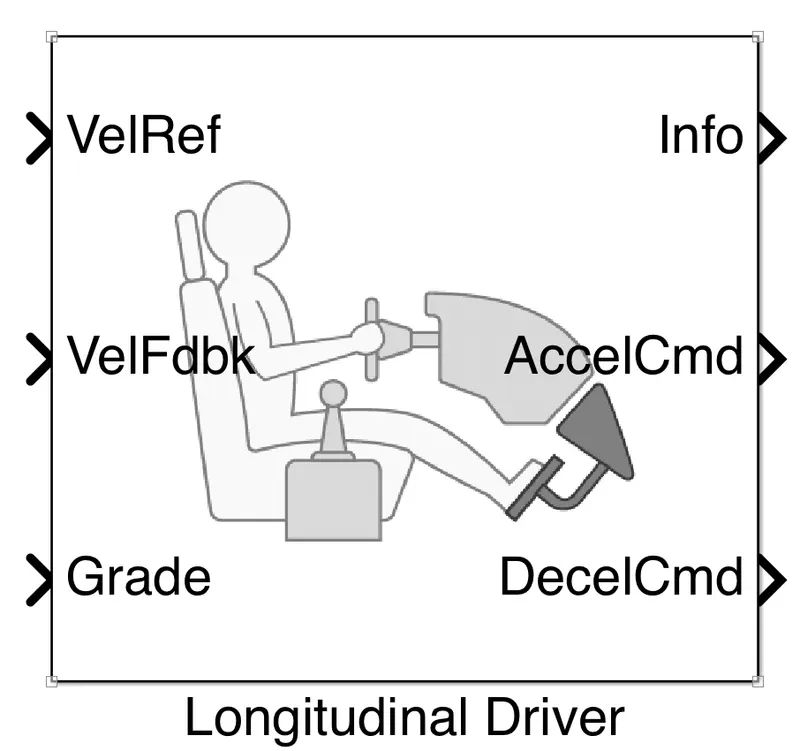
Here we have connected the different inputs & outputs of longitudinal driver with different parameters as follows:-
- Velocity Reference (VelRef) is connected with the Drive Cycle FTP75 (Output of the switch Block)
- Velocity feedback (VelFdbk) is connected with V terminal of vehicle body.
- Grade is connected with constant block having value 0.
- Info is connected with Terminator.
- Acceleration Command (AccelCmd) is connected with Simulink to PS converter which is followed by Controlled voltage Source.
- Deacceleration Command (DecelCmd) is connected with Simulink to PS converter which is folled by another Controlled voltage source.
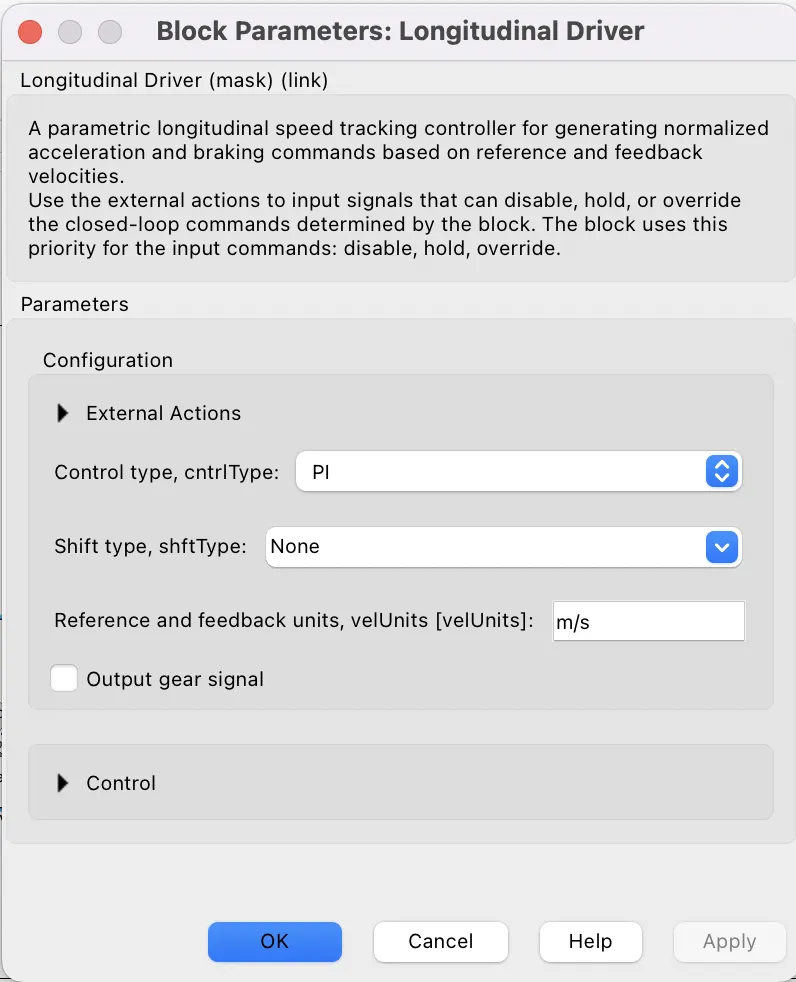
- Here we have choosed the control type as PI (Propertional Integral).
(4) Controlled PWM Voltage:-
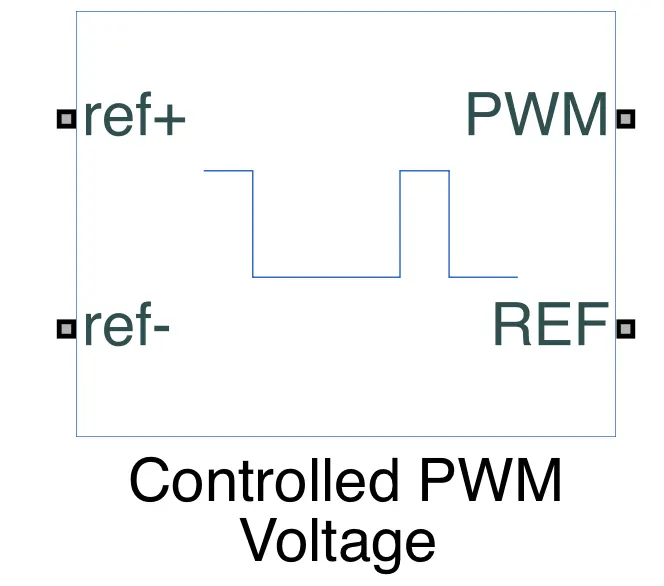
We have connected the different input & output terminals of Controlled PWM Voltage with other blocks as follows:-
- Reference+ (ref+) is connected with +ve terminal of controlled voltage source which is connecetd with the Acceleration Command of the longitudinal driver.
- Reference- (ref-) is connected with the -ve terminal of above mentioned controlled voltage source.
- PWM terminal is connected with the PWM terminal of H-Bridge.
- REF is conneted with the ground pottential (Electrical Reference).
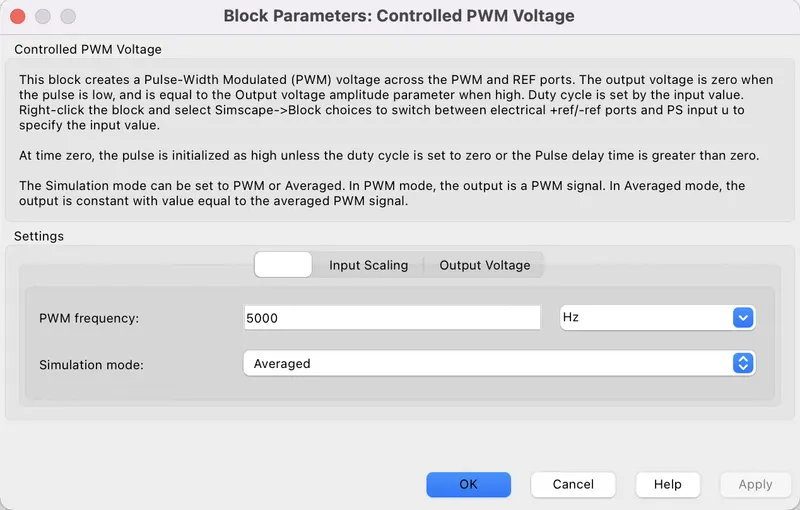
- Here we have Changed the simulation Mode as Averaged & given the PWM Frequency as 5000 Hz for simulating the model in less time period.
(5) H-Bridge:-
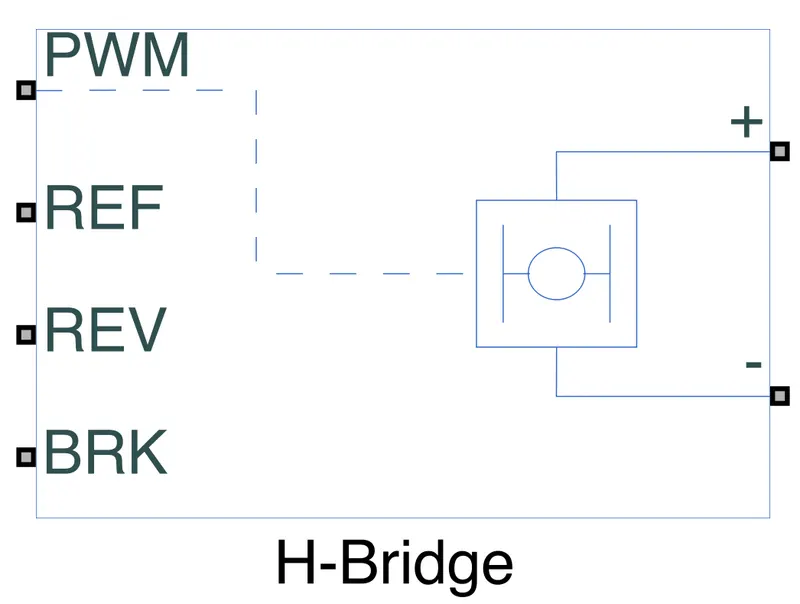
The H-Bridge helps in controlling the power that is input according to the requirement. The output provided are converted voltage as per the controlled parameters.The input & output terminals of H-Bridge block are connected with other blocks as follows:-
- PWM is connected with the PWM terminal of Controlled PWM Voltage.
- REF is connected with the ground pottential (Electrical Reference).
- REV is connected with the -ve terminal of controlled voltage source which is connected with ground pottential.
- BRK (Brake) is connected with +ve terminal of Controlled voltage source which is connected with the Deacceleration command terminal of longitudinal driver.
- +ve terminal of H-Bridge is connected with +ve terminal of current sensor.
- -ve terminal of H-Bridge is connected with ground (Electrical Reference).
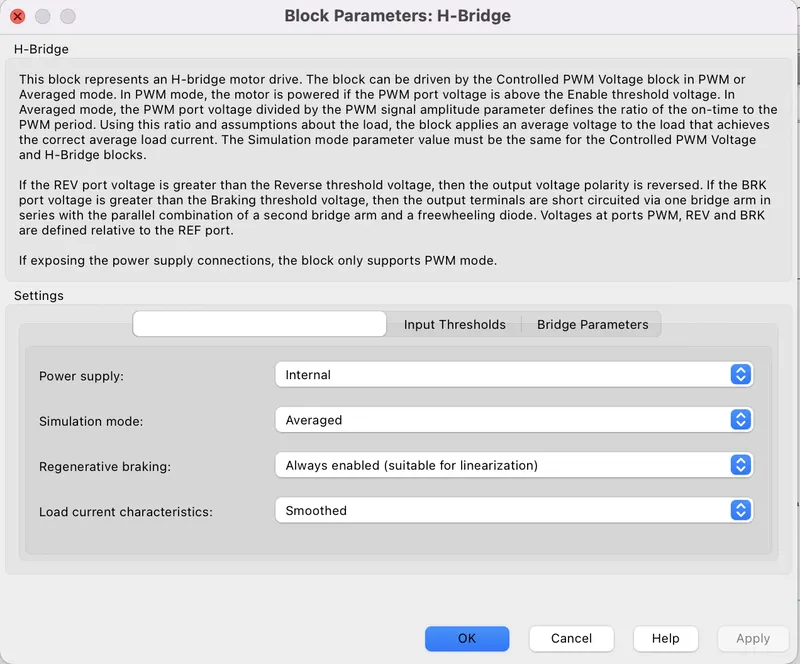
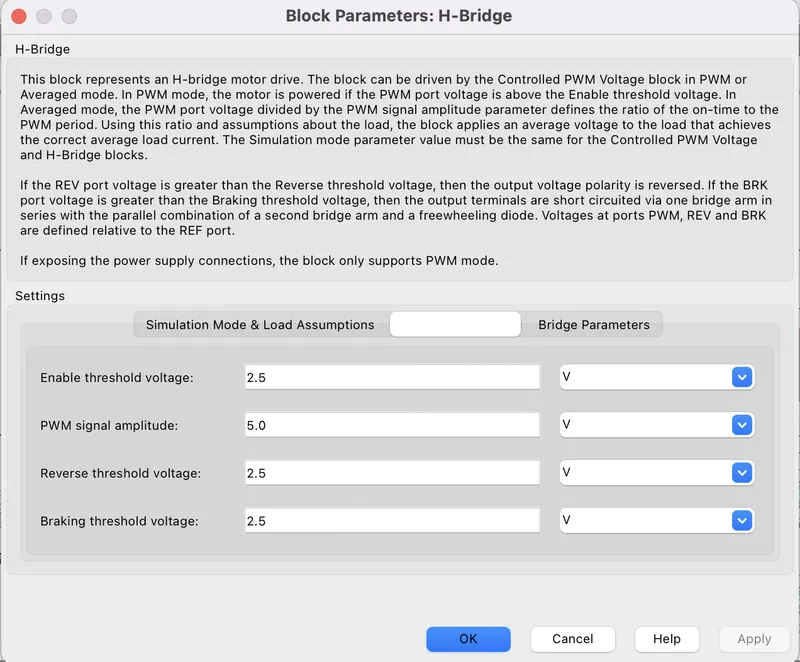
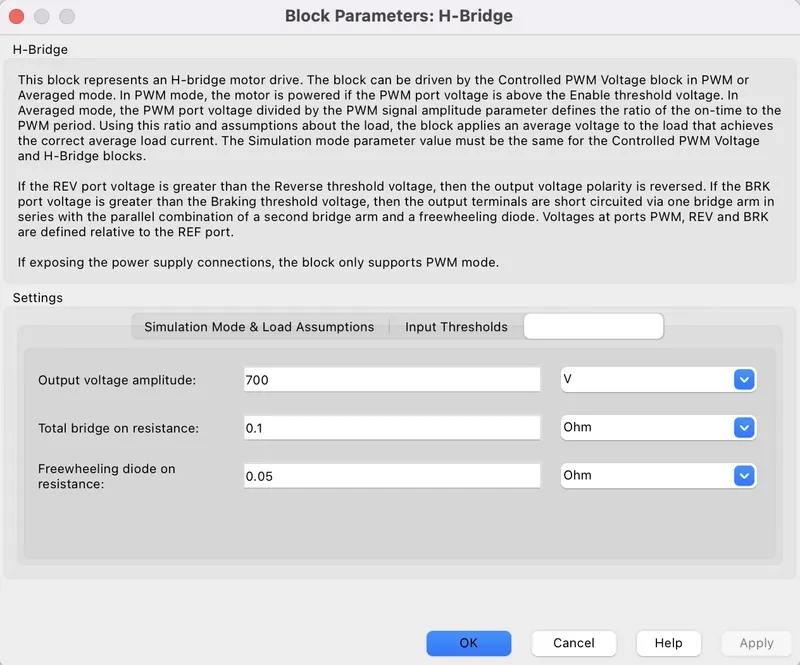
- Here we have choosen the power supply as internal & enabled the Regenerative braking mode for the power supply from load to source during deacceleration.
- Simulation mode as Averaged.
- Choosed the output voltage amplitude as 700 volt & other parameters remain unchanged.
(6) DC Motor:-
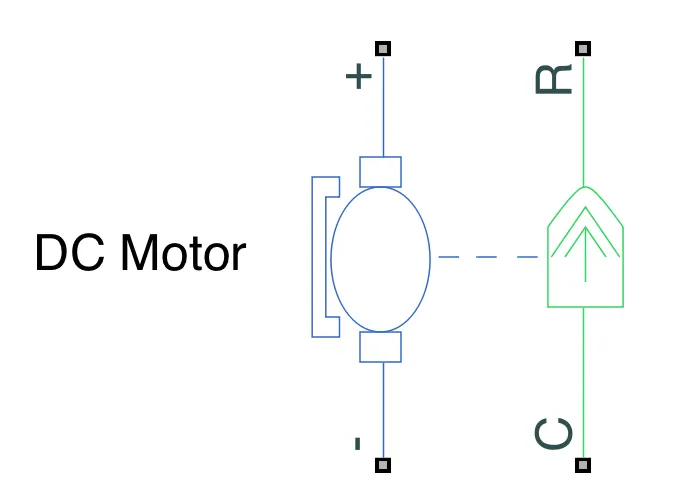
This is brushed type DC motor which is connected as follows:-
- +ve terminal connected with -ve terminal of current sensor.
- -ve terminal is connected with ground pottential.
- C terminal is connected with mechanical rotational reference.
- R terminal (Rotor Shaft of DC motor) is connected with B terminal of simple gear.
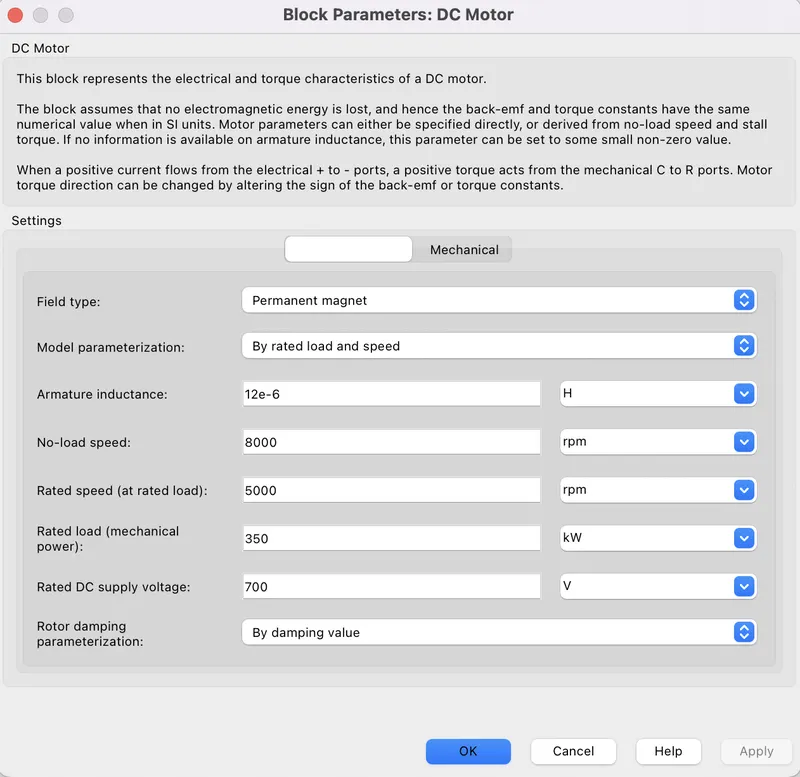
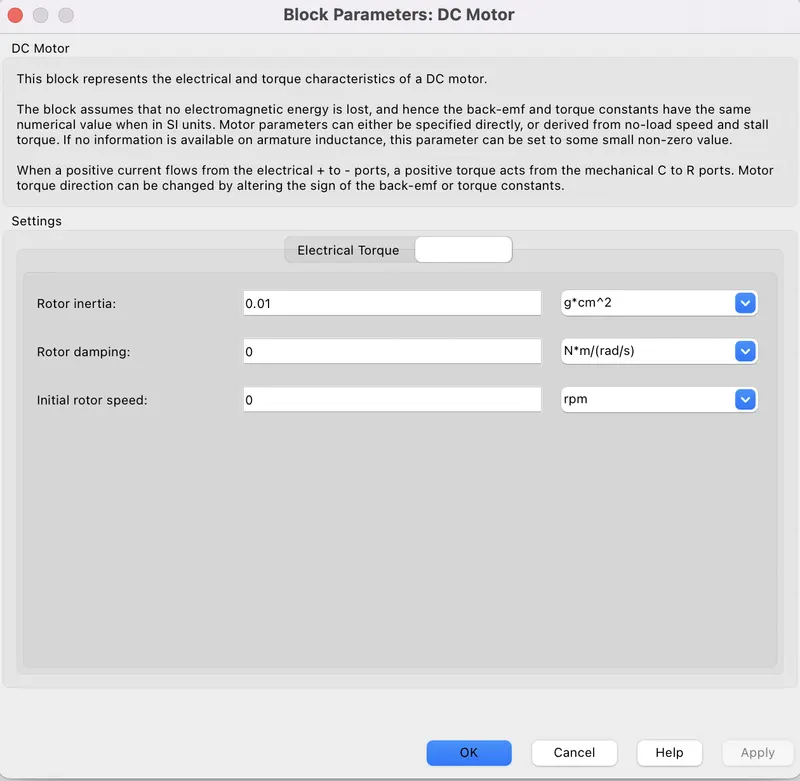
- here we have chosen the model Parameterization as By rated load & speed.
- We have taken the No-load speed as 8000 RPM & Rated speed as 5000 RPM.
- Rated load (Mechanical power) as 350 kWatt.
- Rated DC supply voltage as 700 volt & other parameters are default.
(7) Vehicle:-
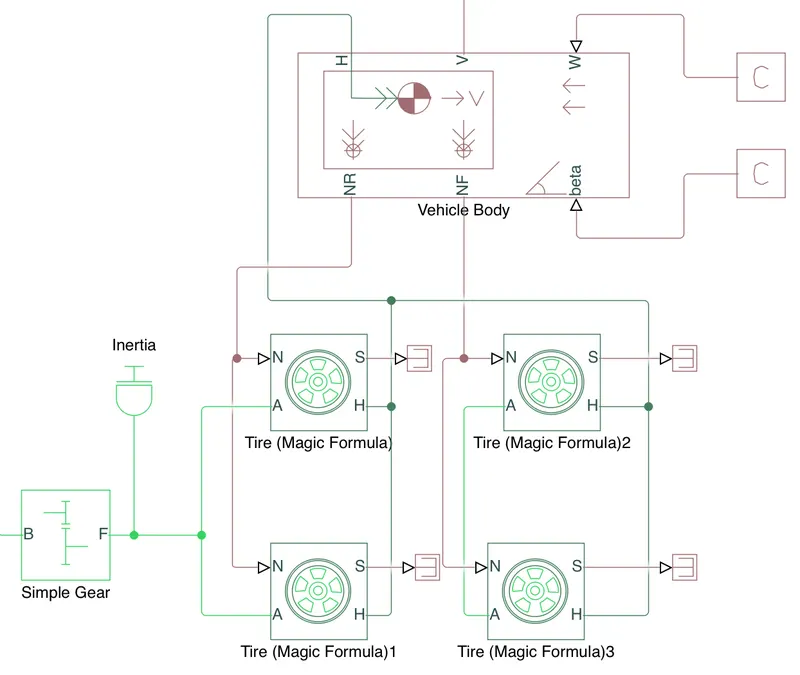
- The vehicle is consisting of a vehicle body & 4 Tires(Magic formulas ) having some changed parameters.
- there are two tires (2&3) are considered as front tire & other two tires are considered as rear tire.
- N terminal of rear tires are connected with NR terminal of vehicle body.
- N terminal of front tire are connected with NF terminal of Vehicle body.
- H terminal of all tires are conncted with H terminal of vehicle body.
- A terminal of all tires are connected with the F terminal of simple gear.
- There is a Inertia block os connected with F block of simple gear.
- S terminal of all tires are connected with PS terminal indivisually.
- W terminal of the Vehicle body which represents the Wind speed is connected with the PS constant block having 0 m/s speed.
- beta terminal of vehicle body which represents the inclination angle is connected with another PS constant block having 0 rad angle.
- V termianl represents the velocity or speed of vehicle which is connected with PS-Simulink converter block followed by both scope & VelFdbk terminal (Velocity Feedback) of Longitudinal driver.
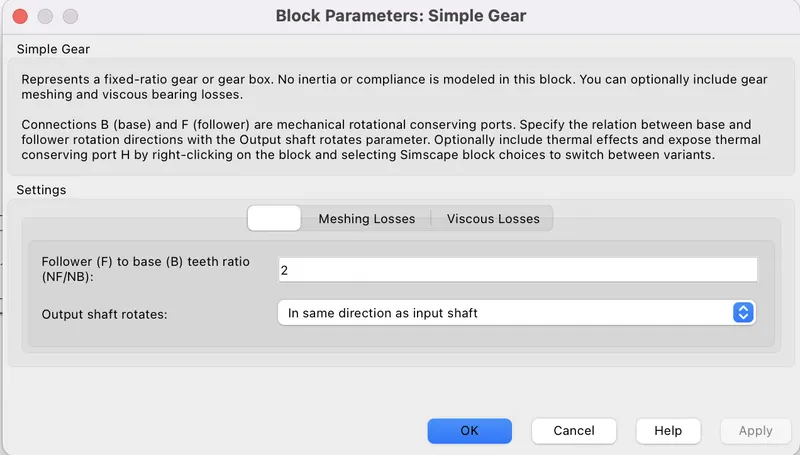
- Here we have changed parameter of simple gear as Output shaft rotates in same direction as input shaft.
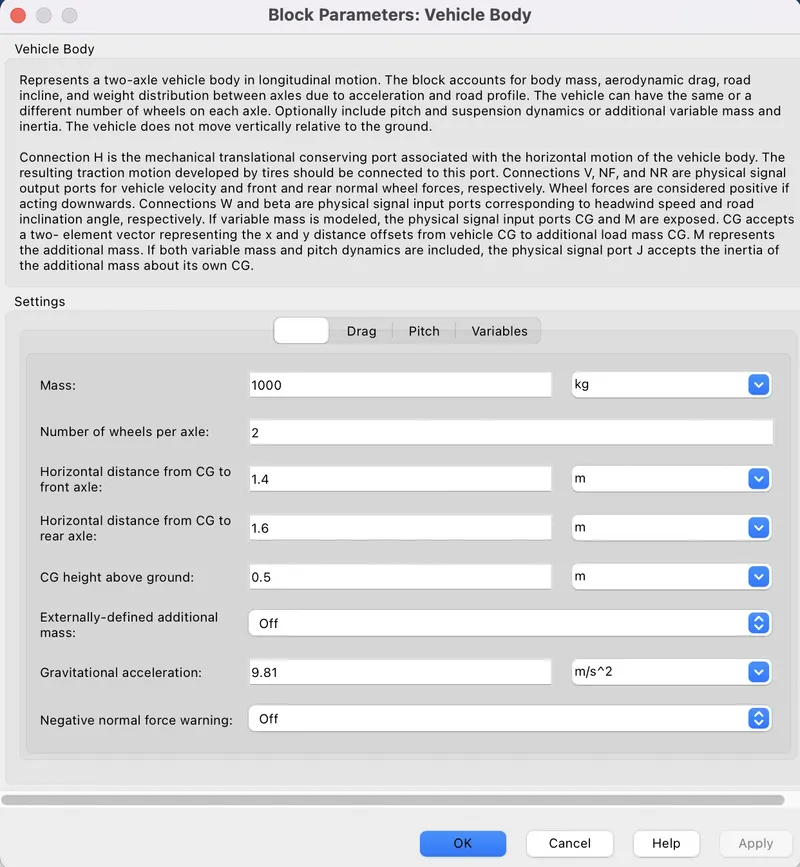
- Here we have chosen the vehicle mass as 1000 kg & other parameters of vehicle body are remaining in default condition.
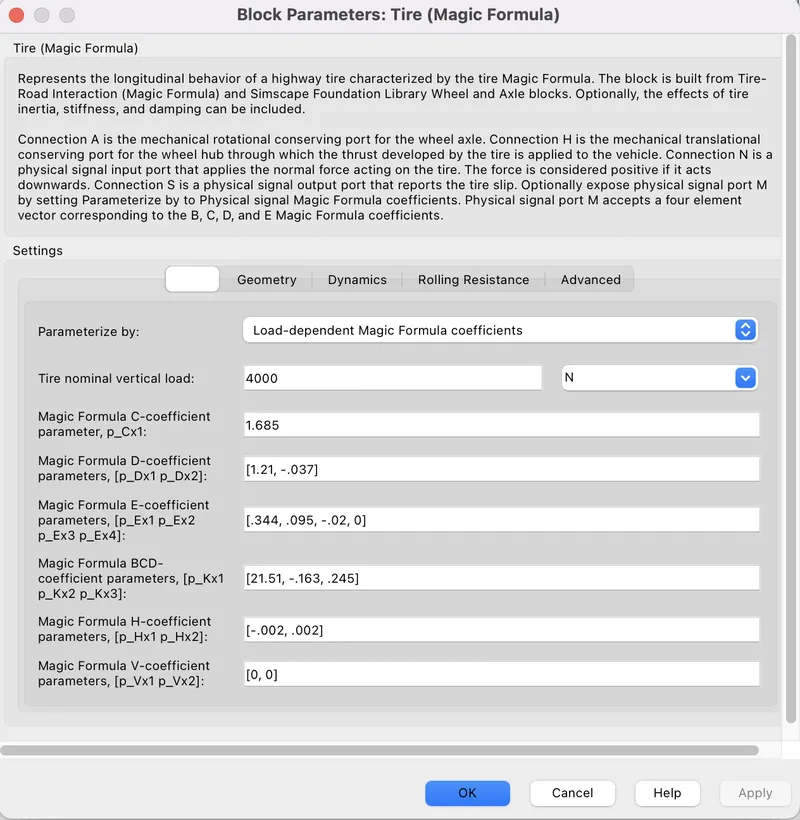
- Here we have set the Parameterize by Load-dependent Magic Formula coefficients & other parameters remains unchanged.
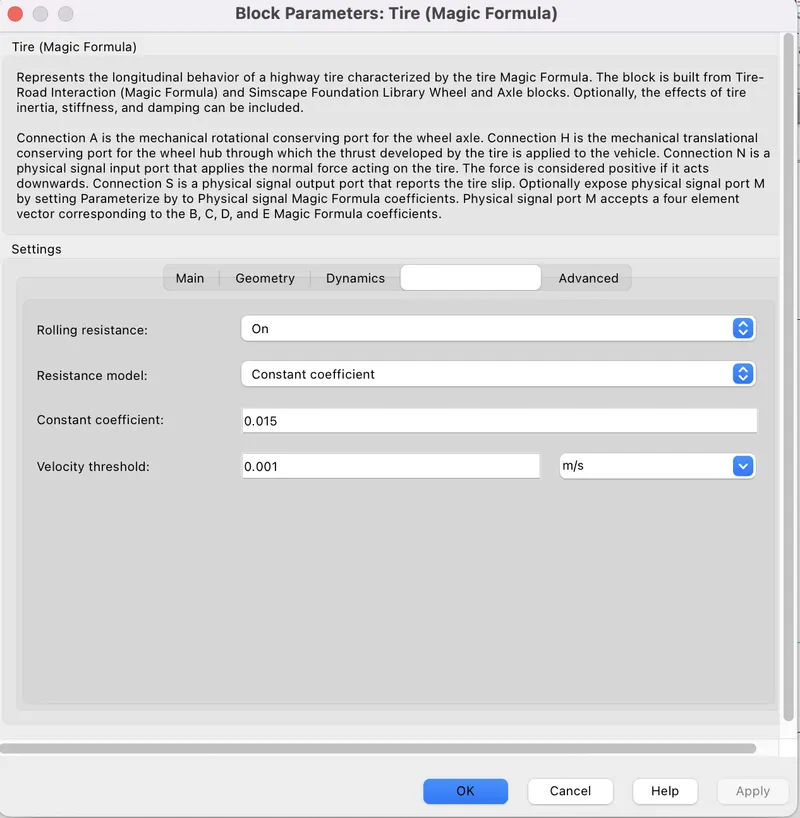
- Here we have set the Rolling resistance ON & keep other parameters unchanged or bydefault.
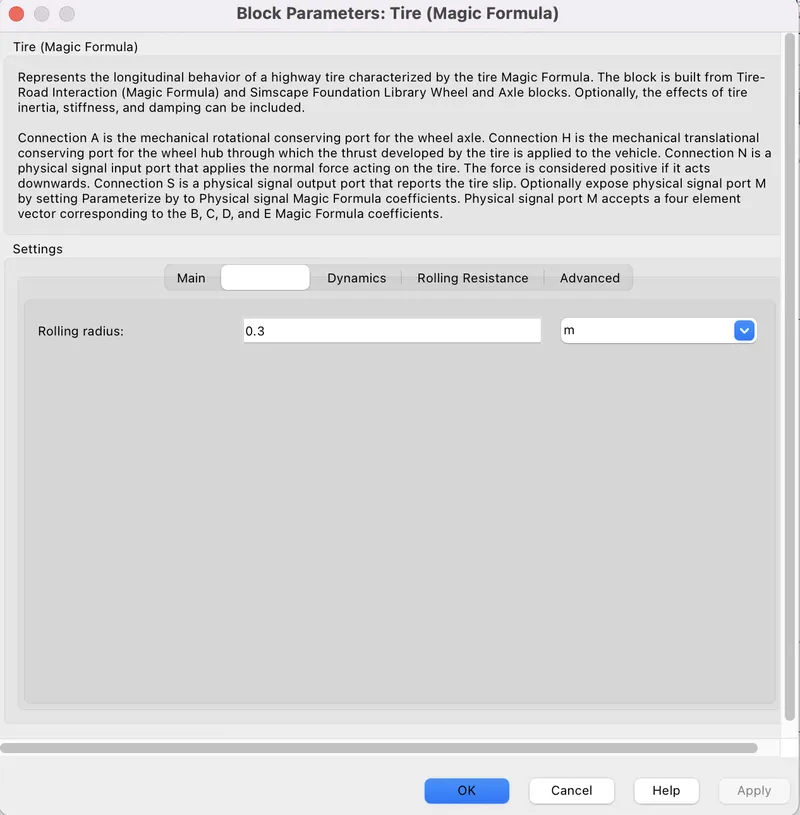
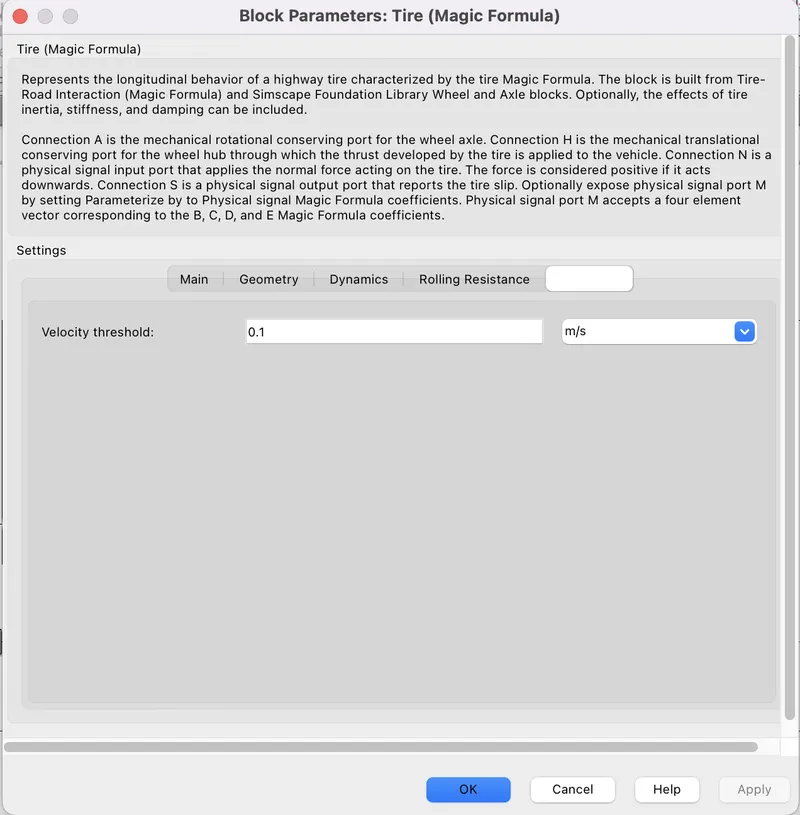
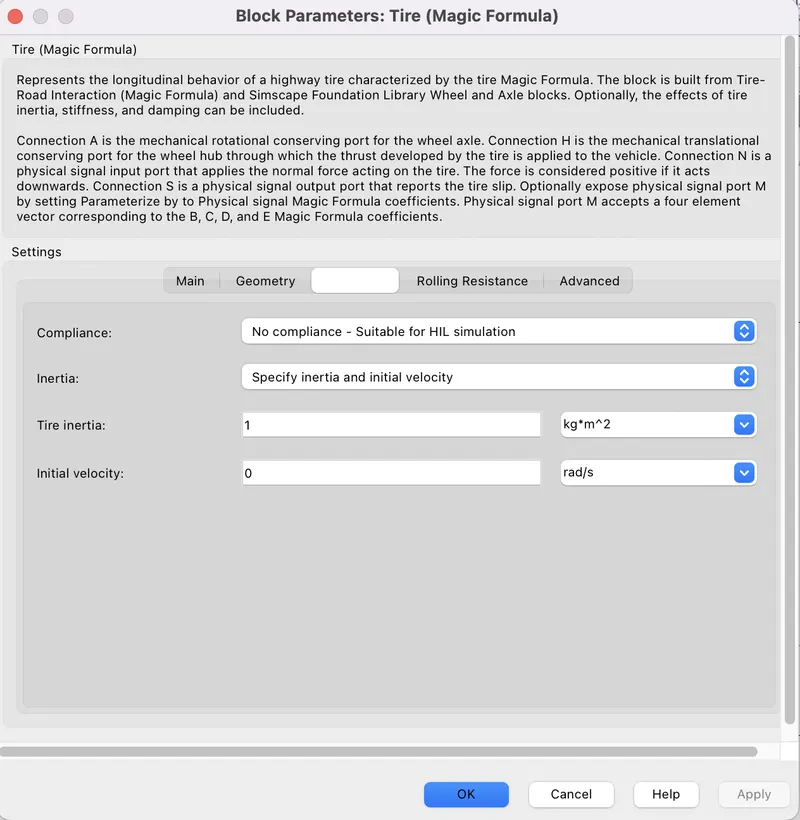
- Here we set the Inertia s Specify Inertia & Initial velocity.
- The above parameters are changed for the vehicle body & Tires (Magic formula).
(8) Battery:-
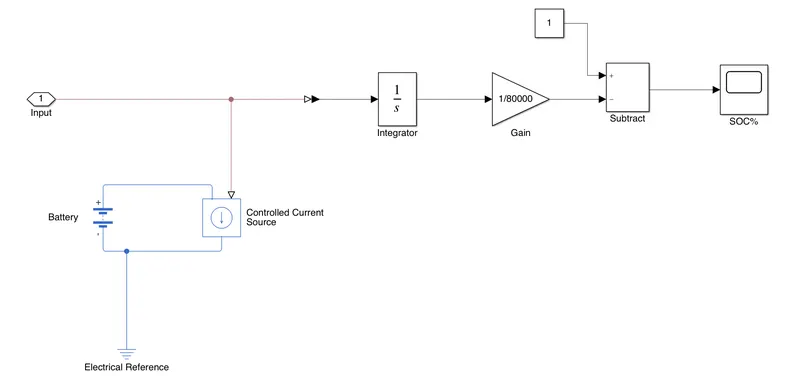
- Battery is connected with the controlled current source such as both +ve terminals are connected with each other & both -ve terminals are connected with each other also.
- Here battery is used to provide required amount of power supply to the operating systems such as Motor,DC-DC converter etc.
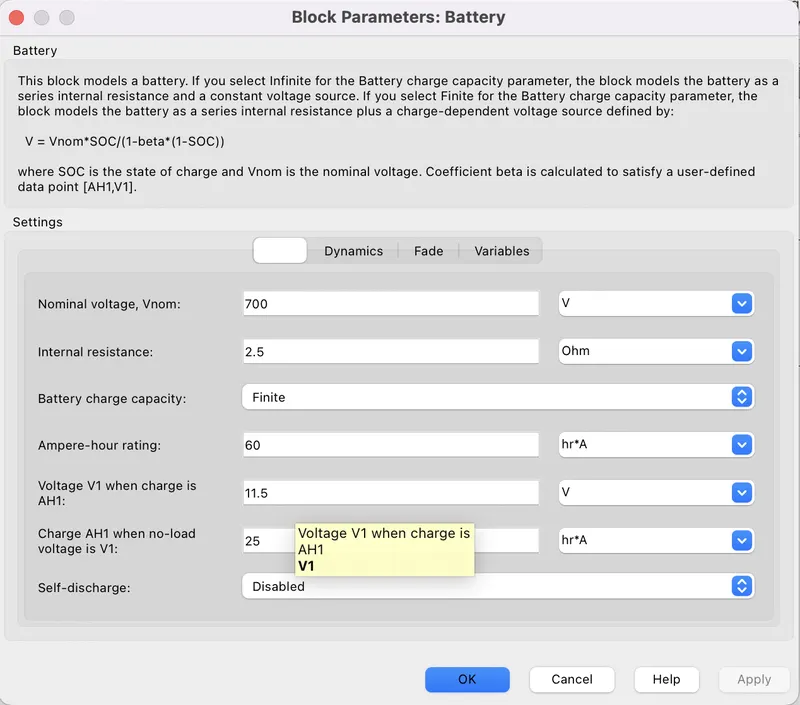
- Here we have chosen the Nominal voltage for the battery as 700 Volt, internal resistance as 2.5 Ohm & battery capacity as 60 Ah. & other parameters remain uncharged.
- here we have designed the model to estimate the SOC of the battery pack.
- For estimating the SOC of battery pack, Coulomb Counting Technique is used which estinate the current SOC or available SOC in a battery pack by the two informations such as previous battery pack SOC & loss in charge capacity from the battery pack.
- this method integrates the flowing current over time to determine the charge capacity loss from the battery.
- then it is multiplied by (1/50*3600) to convert thr charge capacity into Ah.
- then it is subtracted from the full charge capacity as 1 means 100%.
- Then we can get the current SOC of battery pack.
Result:-
- So we have already discussed all parameters above so now it's time to run the model.
(A) #Result-1:-
- When the Motor Rated Load mechanical power is 350 kWatt & rated DC supply voltage is 700 Volt, then
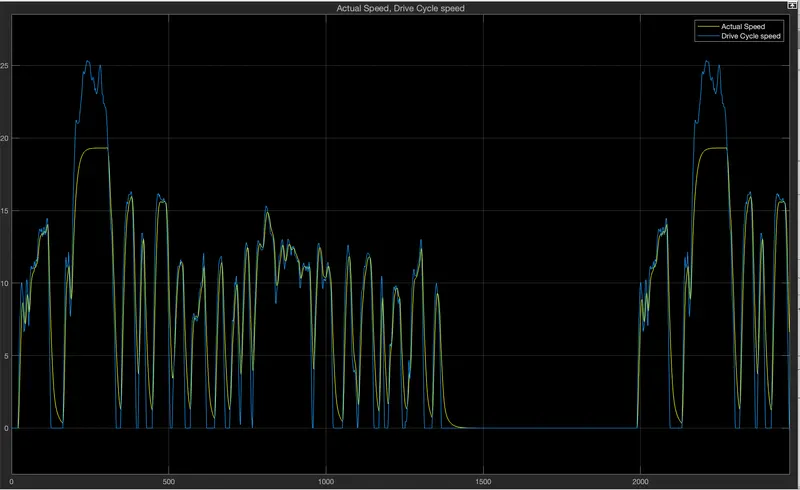
- From the above scope, we can see that the Blue line indicates the FTP75 Drive cycle & the Yellow line indicates the actual Drive cycle covered by the vehicle.
- The maximum speed achived by the FTP75 drive cycle is slightly more than 25 m/s or 90 km/hr but the actually the vehicle can move with a maximum speed of approximately 19 m/s or 68.4 km/hr.
- So from the above plot, we can understand that the actual drive cycle follows the path of load Drive cycle such as FTP35 but keeping this motor rating we can't match the maximum speed achived by FTP35 drive cycle.
- In this case the vehicle covers a distance of 17.7 km after 2474 sec with a max speed of 19 m/s or 68.4 km/hr.
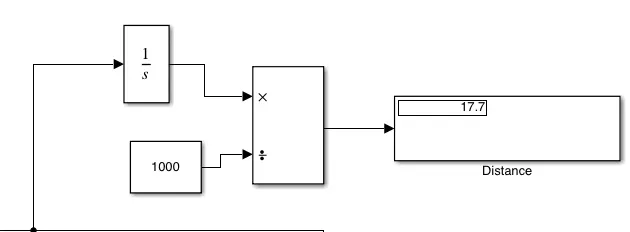
- In order to increase the maximum speed of the vehicle & to match with the loaded frive cycle we have to increase the Motor rating.
(B) #Result-2:-
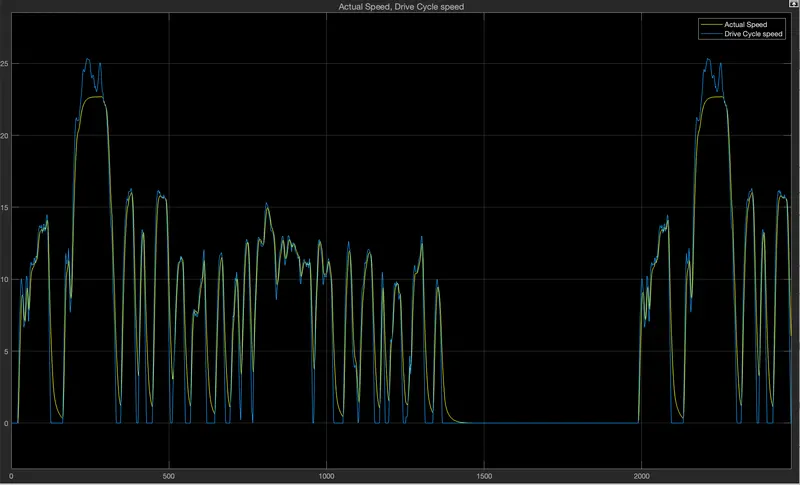
- If we increase the Mechanical power at rated load into 450 kWatt & decrease the rated DC supply voltage into 600 Volt then we can see that the maximum speed achieved by the vehicle is approximately 22 m/s.
- still this motor rating is not enough for achieving the maximum speed.
- here the vehicle covers a distance of 18.41 km with a max speed of 22 m/s or 79.2 km/hr.
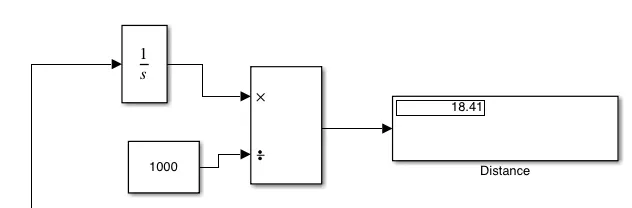
- so we have to again increase the Mechanical power at rated load.
(C) #Result-3:-
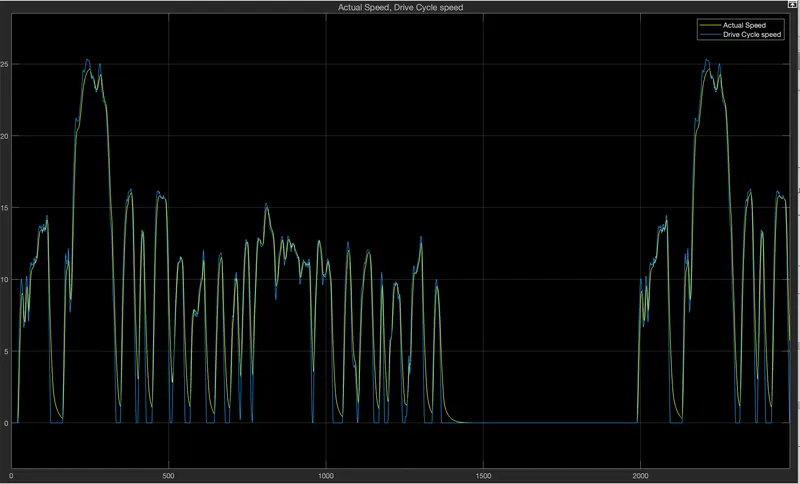
- Here we have taken the Mechanical power at rated load as 550 kWatt & the Rated DC supply voltage as 550 Volt.
- from the above plot, we can see that the maximum speed achieved by the vehicle is approximately 24 m/s.
- we can observe that actual drive cycle nearly match to the entire FTP75 drive cycle.
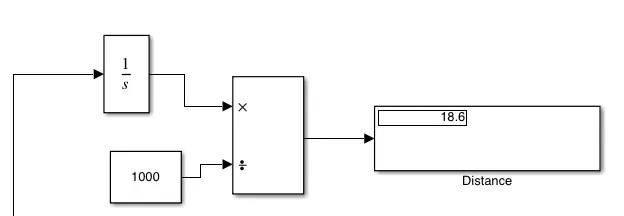
- Here the vehicle covers a distance of 18.6 km with max. speed of 24 m/s or 86.4 km/hr.
(D) #Result-4:-
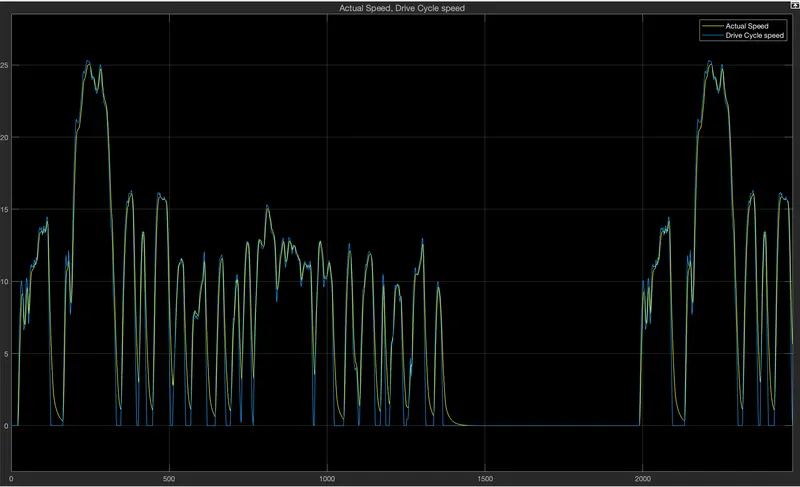
- Here we have chosen the Mechanical power at rated load is 650 kWatt & Rated DC supply voltage is 500 Volt.
- Here we can observe that actual drive cycle almost match with FTP75 drive cycle.
- the maximum speed achieved by the vehicle is 25 m/s.
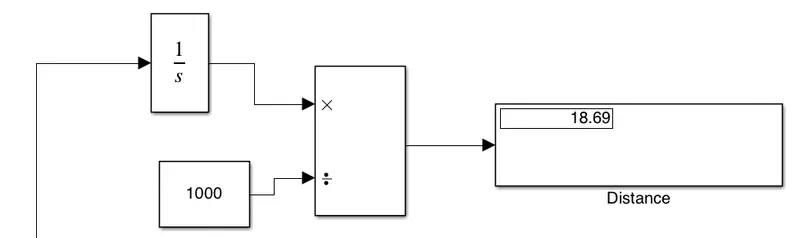
- Here the vehicle covers a distance of 18.69 km with a max speed of 25 m/s or 90 km/hr.
- But still we can observe that there is some gap between the actual speed & FTP drive cycle speed.
- This gap is due to inertia & other parameters acffecting such as eddy current loss, hysteresis loss in the DC motor etc.
- If we further increase the motor rating, we will see the same plot i.e:- there will be a gap between two drive cycle.
Conclusion:-
- from the above result, we can conclude that the vehicle can move with higher velocity with higher Mechanical power load rating & loower dc supply voltage rating of dc motor.
- Here from the #result-4, we can see that the vehicle is able to match with loaded FTP35 drive cycle when it has mechanical power rating of motor as 650 kWatt & the rated DC supply voltage as 500 Volt.
- These same simulations could be carried out before deciding the overall specification that the vehicle should achieve. In this manner the motor , Battery and other components could be chosen and then the actual model could be manufactured.
- There are chance of varition in the results which would be obtained in comparison of the actual and MATLAB Simulations as actual Conditons would vary the results.
- All components could be customized as per the test which has to be carried out like the vehicle mass, the Vehicle Battery Specification the Battery motor and all others.