Final Project: Design of an Electric Vehicle
Introduction of Electric vehicles
An electric vehicle (EV) is an automotive vehicle that uses one or more electric motors for propulsion. It can be powered by a collector system, with electricity from extravehicular sources, or it can be powered autonomously by a battery (sometimes charged by solar panels, or by converting fuel into electricity using fuel cells. EVs include, but are not limited to, road and rail vehicles, surface and underwater vehicles, electric aircraft and electric spacecraft.
Electric vehicles have low running costs as they have less moving parts for maintaining and also very environmentally friendly as they use little or no fossil fuels (petrol or diesel). While some EVs used lead acid or nickel metal hydride batteries, the standard for modern battery electric vehicles is now considered to be lithium ion batteries as they have a greater longevity and are excellent at retaining energy, with a self discharge rate of just 5% per month. Despite this improved efficiency, there are still challenges with these batteries as they can experience thermal runaway, which have, for example, caused fires or explosions in the Tesla model S, although efforts have been made to improve the safety of these batteries.
There are two main types of electric vehicles (EV); fully electric and plug-in hybrids:
Battery Electric Vehicles (BEV);
BEVs can be charged at home overnight, providing enough range for average journeys. However, longer journeys or those that require a lot of hill climbs may mean that the fuel cells require charging before you reach your destination, although regenerative braking or driving downhill can help mitigate against this by charging the battery packs. The typical charging time of an electric car can range from 30 minutes and up to more than 12 hours. This all depends on the speed of the charging station and the size of the battery.
Advantages of a BEV:
- Creates very little noise.
- No exhaust, spark plugs, clutch or gears.
- Doesn't burn fossil fuels, instead uses rechargeable batteries.
Plug in Hybrid Electric Vehicles (PHEV);
Rather than relying solely on an electric motor, hybrid electric vehicles offer a mixture of battery and petrol (or diesel) power. This makes them better for travelling long distances as you can switch to traditional fuels rather than having to find charge points to top up the battery. Of course, the same disadvantages that apply to combustion engine vehicles also apply to PHEVs, such as the need for more maintenance, engine noise, emissions and the cost of petrol. PHEVs also have smaller battery packs, which means a reduced range.
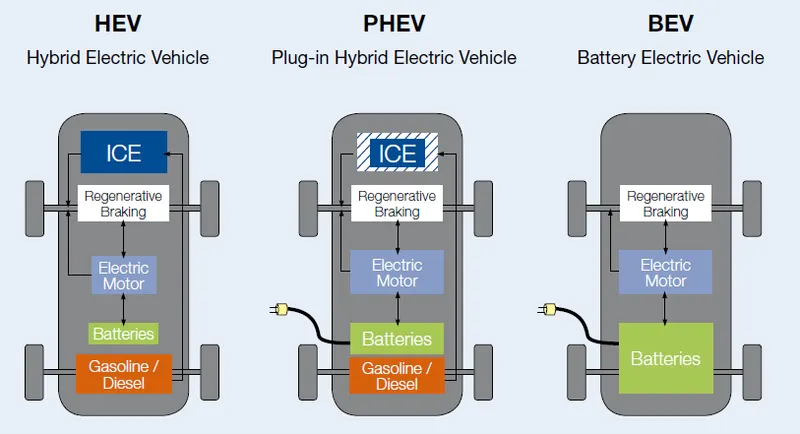
In this report, I will be modelling an electric vehicle with a DC motor and battery system using the MATLAB Simulink software. The model will run for a dive cycle and measure the velocity characteristics, current and SoC characteristics of the battery.
Components:
The main components of EV are ;
- Wheels
- Battery
- Motor/Generator
- Motor controllers
- Power converters
- Transmission system
System Level Configuration :
For modelling the whole vehicle in the simulink, we need the above mentioned components in simulink, which is available in the simulink block librabry.
Vehicle Body:
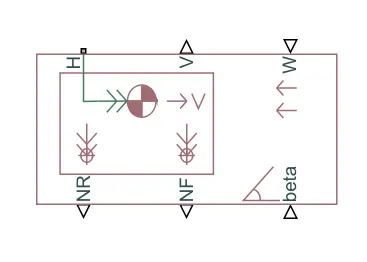
Vehicle body block contains 6 ports which are used for various modelling aspects,
- H - Stands for hub which is used to connect the wheels to the vehicle body.
- V stands for the output velocity of the vehicle, which is feedback to the controller.
- W is for modelling the wind velocity if require.
- NR port will connect to the rear wheels
- NF port will connect to the front wheels
- Beta is the angle of inclination (Hill climbling)
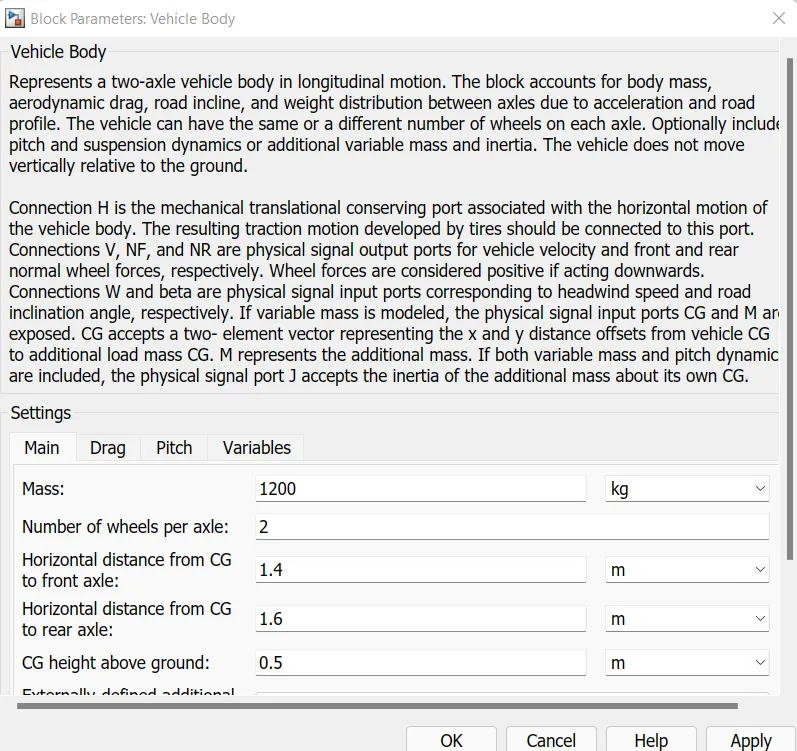
- The model parameters like mass, frontal area etc are setup in the vehicle body block.
- Here we taken vehicle mass 1200kg and Frontal area is 3 m^2
Wheels:
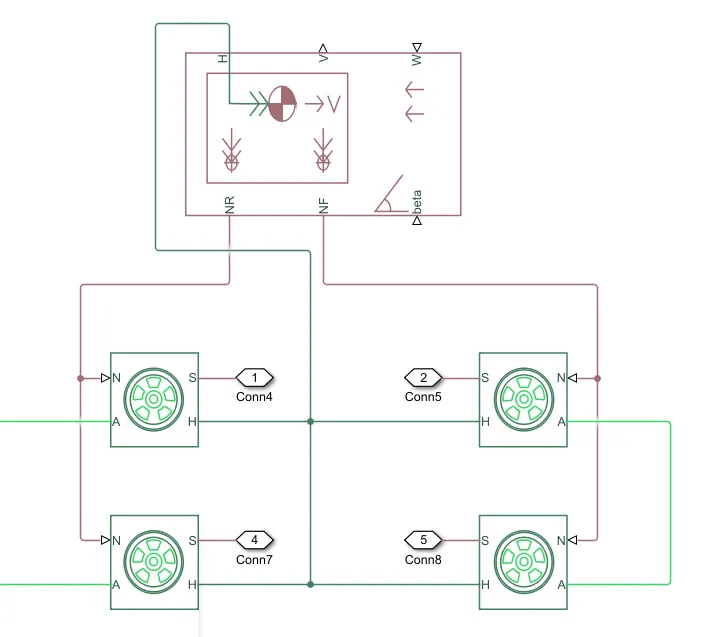
- The H port is hub the hub of vehicle body is connect to the H port of wheels.
- A is the axiles, the rear axil is connected to a simple gear system.
- NR and NF ports of the vehicle body block is connect to the N port of the wheel block.
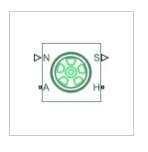
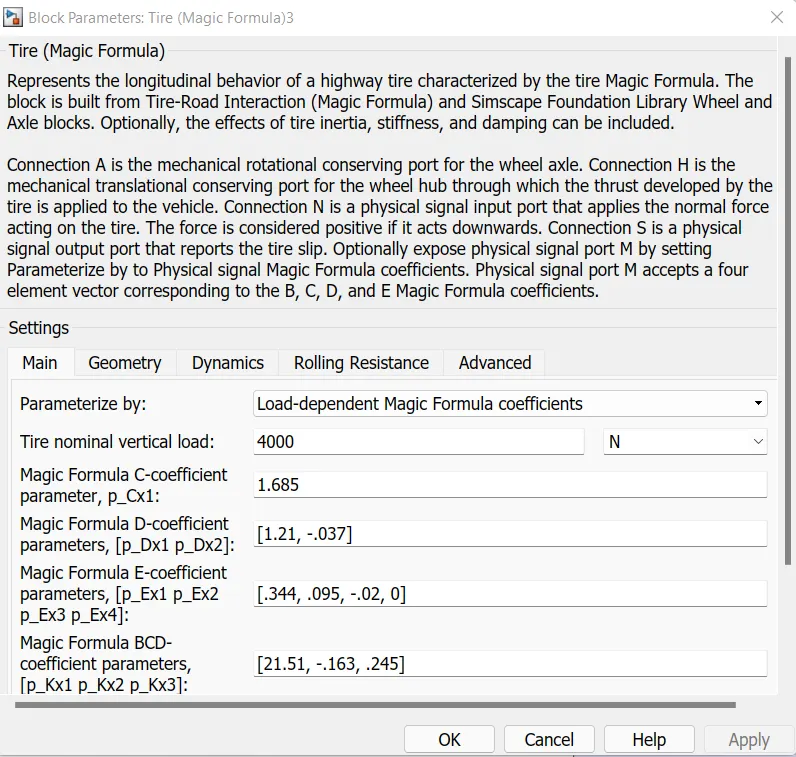
In additional to above parameters tyre radius is 0.3m and coefficent of rolling resistance is 0.015.
Simple gear block :
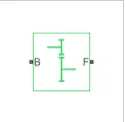
The Simple Gear block represents a gearbox that constrains the connected driveline axes of the base gear, B, and the follower gear, F, to corotate with a fixed ratio that you specify. You choose whether the follower axis rotates in the same or opposite direction as the base axis. If they rotate in the same direction, the angular velocity of the follower, ωF, and the angular velocity of the base, ωB, have the same sign. If they rotate in opposite directions, ωF and ωB have opposite signs. You can easily add and remove backlash, faults, and thermal effects.
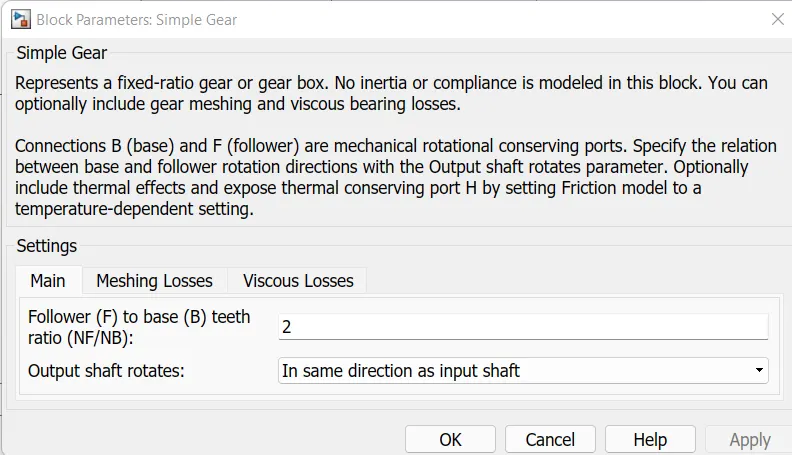
Here the follower to the base teeth ratio has been set to 2 and the output shaft rotates in the same direction as the input shaft. All these blocks can be together called as Vehicle body sub system.
Motor and Controller sub system :
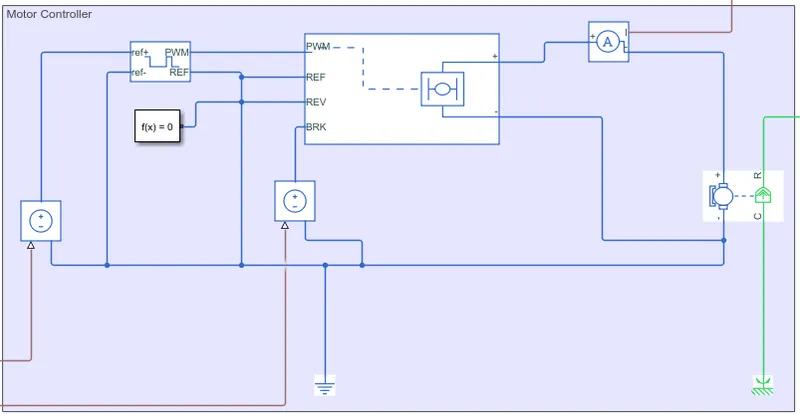
Components;
- DC motor
- H-bridge
- Controlled PWM voltage
- Controlled voltage source
DC motor;
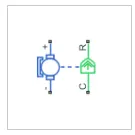
Here for this EV model dc motor is selected because dc motors are easy to model and have very few parameters to run for a particular applications. There is a blue colour electrical side and green colour mechanical side in the block. The electrical side has positive and negetive terminals where the voltage is applied. The mechanical side has C and R ports, C stands for casing which is stable part and R stands for rotor, which rotates. Here the rotor is connected to the simple gear.
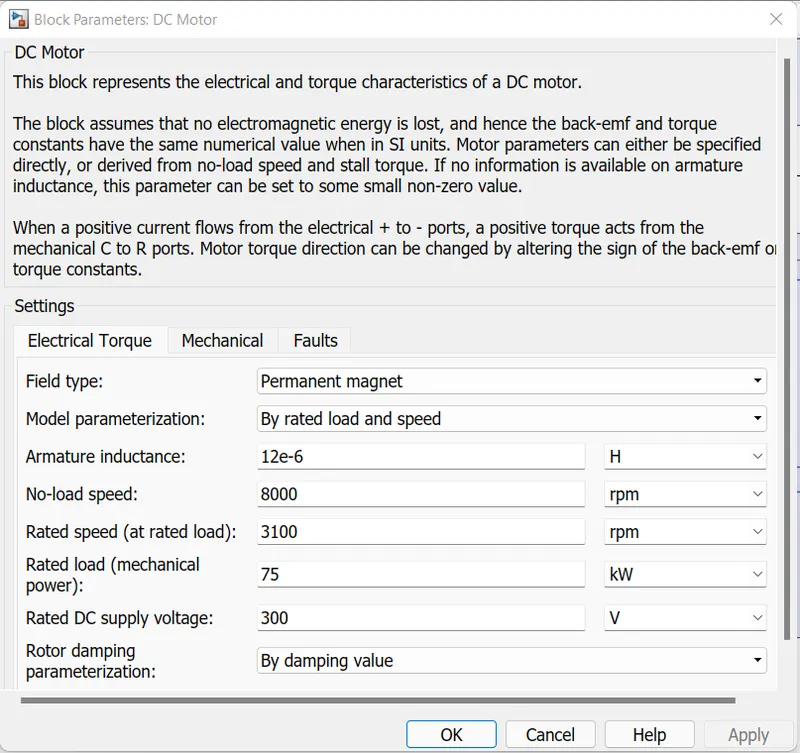
The model parameters of dc motor are;
- Supply voltage = 300 v
- No load speed = 8000 rpm
- Rated speed = 3100 rpm
- Rotor inertia = 0.01 g*cm^2
H-bridge;

H-bridge is a power converter which is needed to provide the required power in correct form. In case of the EV the power converter is needed to provide a dc voltage from the battery.
- PWM - Pulse width modulation
- REF - Reference
- REV - Reverse
- BRK - Brake
There are two controlled voltage sources, the controlled voltage source from the acceleration command is connected to the PWM port and the controlled voltage from the braking command is connected to the BRK port. A solver configuration is connected to the REV port.
Controlled PWM voltage;

The controlled voltage source from the commands passes through the controlled PWM voltage block, The voltage pulses created by this block are dependent on the duty cycle which is in that ratio of the time that the switch is ON to the time taken for one cycle .
Duty cycle = Ton/(Ton + Toff) = Ton/Tcycle.
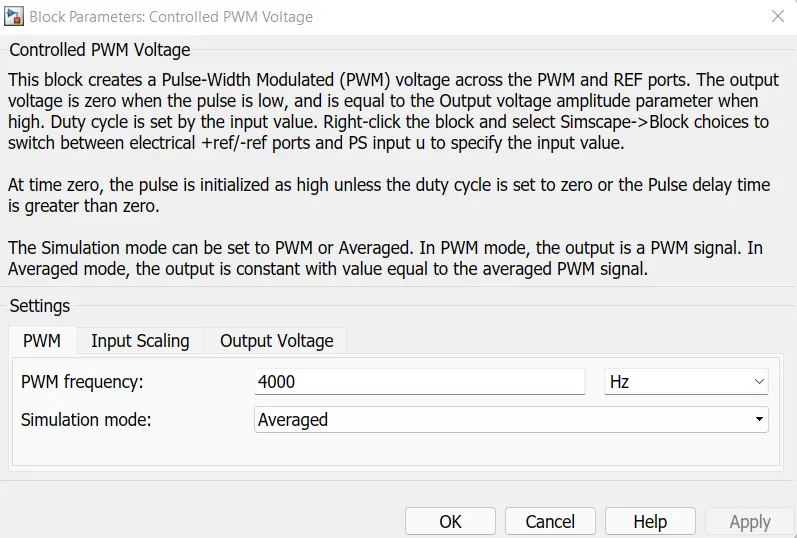
The remaining parameters of input scaling and output scaling are unchanged.
Controlled voltage source;

The Controlled Voltage Source block represents an ideal voltage source that is powerful enough to maintain the specified voltage at its output regardless of the current flowing through the source. The output voltage is V = Vs, where Vs is the numerical value presented at the physical signal port.
There are two controlled voltage sources used here, one block is for acceleration and other to provide voltage for decceleration or braking.
The electrical reference is used to grounding. The Solver configuration block is used to solve any necessary equations in a model. Here it is used to connection to the REV port of H-bridge.
Battery Subsystem:
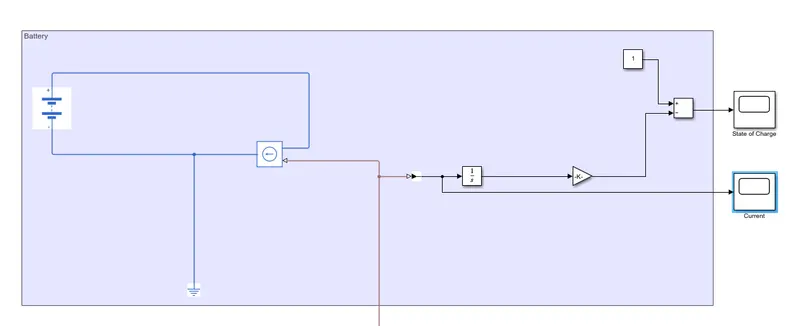
Components;
- Battery
- Controlled current source
- SoC system
Battery;

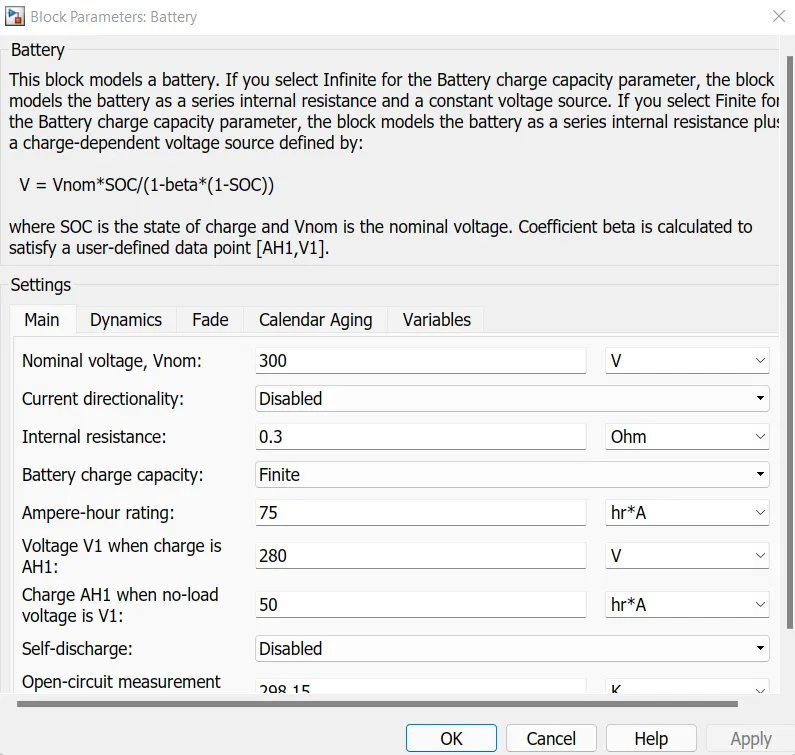
A dc battery of input voltage 300v is used in the EV. The energy storage system is the battery. The nominal voltage is 300v and internal resistance is 0.3 ohms. Battery charge capacity is finite.
Controlled current source;

The Controlled Current Source block represents an ideal current source that is powerful enough to maintain the specified current through it regardless of the voltage across the source. The output current is I = Is, where Is is the numerical value presented at the physical signal port.
This block produces an ideal current that is powerfull enough to maintain the specified current regardless of the voltage across it. Positive and negetive ends of the battery connected to the controlled current source block and it is connected to the positive terminal of the H-bridge circuit. The negetive end of battery also connected to the ground reference.
SoC system;
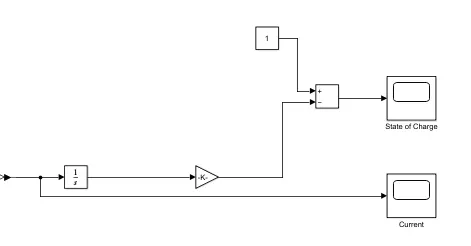
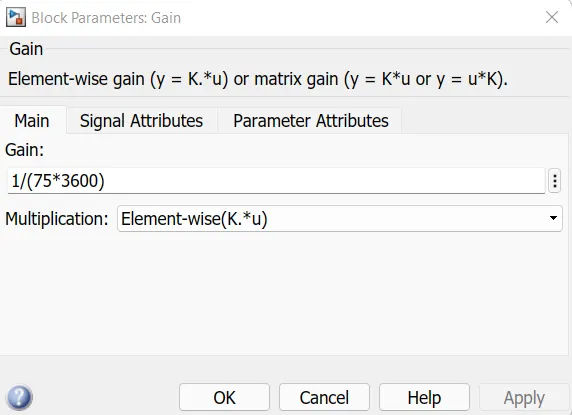
A subsystem was created to measure the state of charge. First block integrator block will integrate the value of current signal, which is multiplied by the gain. The gain parameter is shown below,
Assume the battery is always fully charged, a constant 1 block is added with gain and the sum block performs the operation. A scope is there to watch the SoC level and also another scope is for find out the value of current. These blocks together forms the SoC subsystem.
Speed and Distance measurement :
A scope for measure the speed is connected to the output. There are two inputs coming to the scope. One is the reference speed from the drive cycle and other one is the output speed from the vehicle body block (V port).
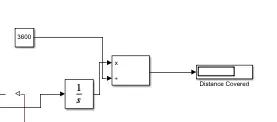
Distance is measured using a display. The output velocity is integrated using the integrator block to obtain the total distance travelled.
Longitudinal driver and Drive cycle :
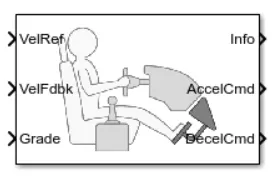
Driver block is actually controller block. It gives acceleration and braking commands. VelRef port is for reference velocity from the drive cycle, VelFdbk is the block for feedback velocity from the V port of the vehicle body block. Here the grade is considered as zero. The acceleration command and decceleration commands are connected to the H-bridge through PWM modulated controlled voltage sources.
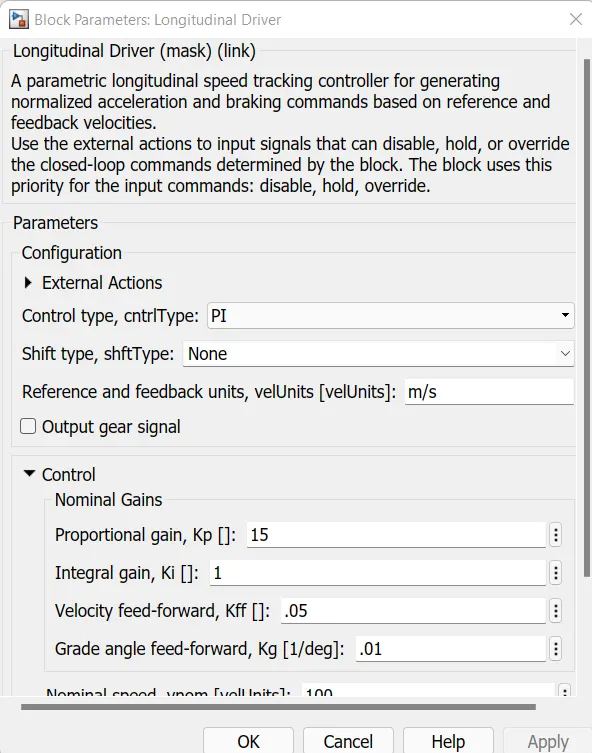
Here the PI controller is used and the Kp value is 15 and Ki value is 1 is selected. The unit of reference speed is in m/s.
Drive Cycle;
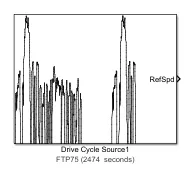
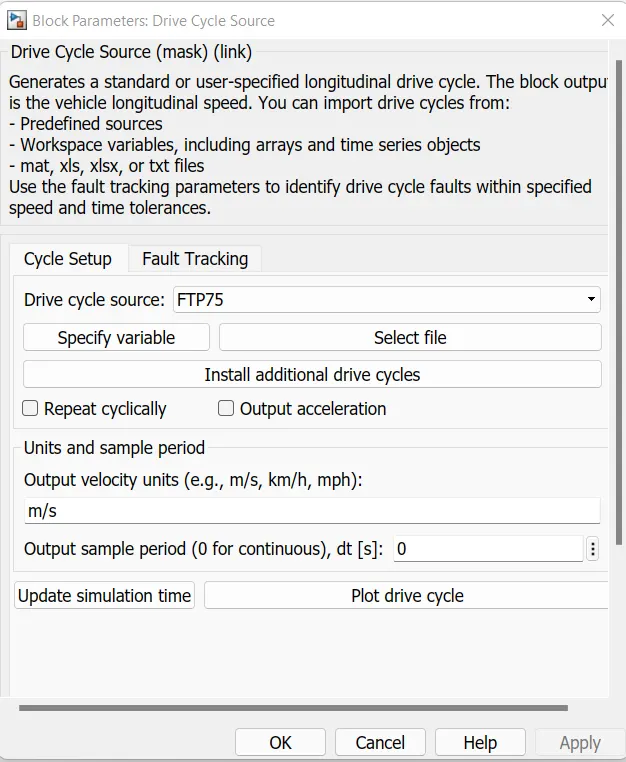
A drive cycle is the data set that contains velocity and time data for the purpose of modelling the motion of vehicle. It is a plot of vehicle velocity against time. It made to resembles typically driving conditions that a customer may experience themselves. Here I am used the FTP75 driving cycle as the reference. It is total of 2474 seconds. Drive cycle are used for various testing procedures such as milege test, pollution test, acceleration and top speed test. Also we can create our own driving cycle using the spreadsheet.
Results :
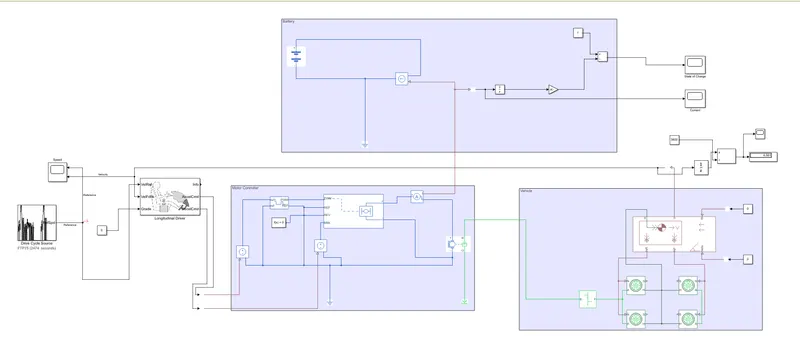
The complete model diagram that i have done of an electric vehicle is shown above. The simulation of the electric vehicle by using the FTP75 drive cycle is done for 2474 seconds and as a result speed, distance travelled, battery SoC and battery current are measured and analysed.
Speed;
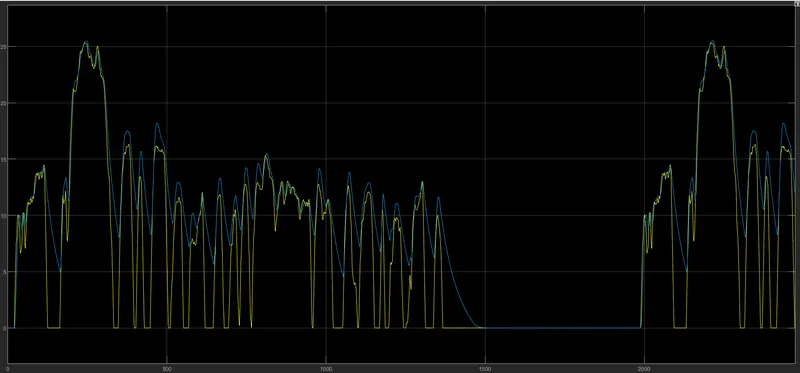
Speed or velocity of the vehicle compare with the drive cycle is shown above plot. From the graph the velocity of the vehicle is almost same as the reference velocity by the help of the PI controller. Here the yellow signal is the drive cycle data and the blue is the velocity of the EV. The graph overlaps each other effectively during the acceleration and decceleration.
Distance;
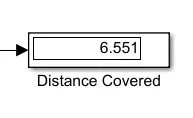
Distance is obtained by the integration of the velocity and it is shown in the display. Here a total of 6.551 Km is travelled in total of 2474 seconds.
Battery SoC;
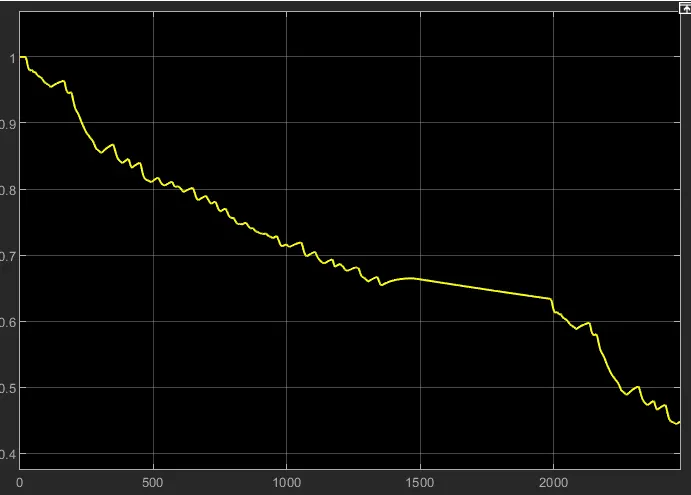
The SoC scope shows how the state of the battery varies over the drive cycle time, The battery level reduced and for travelling 6.551 Km in 2474 seconds the battery level reduced to 45% from 100%. When the vehicle is in braking mode the uplift in the graph shows that the regenerative braking is working to maintain the battery charge.
Current;
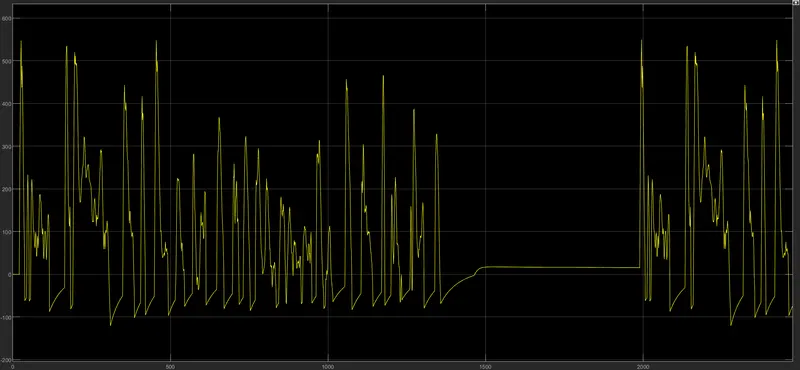
This scope shows how current flowing from the battery to the motor varies with the drive cycle. Here we can see that when vehoicle is in rest position no current is drawn.
Conclusion :
The EV model has created using necessary block components using the Simulink softwareand the model have been simulated for a drive cycle of FTP75 which is available in the software. The simulation gives the results of velocity of the vehicle, current flowing from the battery, state of charge of battery and distance covered by the vehicle. The EV model was able to follow the commands given by the reference velocities from the drive cycle data. The total distance traveled by the EV model in 2474 seconds was 6.551 Kms. The SoC of battery was discharged upto 45% from the fully charged 100%, that is a total of 55% battery charge is used to cover the distance within the simulation time. This model has also included some features like regenerative braking which was evident in the current scope and state of charge scope. The EV model file has attached with this report.