Final Project: Design of an Electric Vehicle
Aim
Create a MATLAB model of an electric car which uses lithium -ion battery and induction motor. Choose suitable blocks from powertrain block set.
Objectives
To prepare a technical report about the EV model including
- System level configuration
- Model parameters
- Results
- Conclusion
Theory
An electric vehicle is a vehicle that uses one or more electric motors for propulsion.
An electric vehicle may be powered through a collector system by electricity from off-vehicle sources or may be self - contained with a battery, solar panels, fuel cells or an electric generator to convert fuel to electricity.
Components
The main components of modelling an EV are
- Vehicle body
- Motor & motor controllers
- Power converters
- Batteries
- Drive cycle
Block diagram
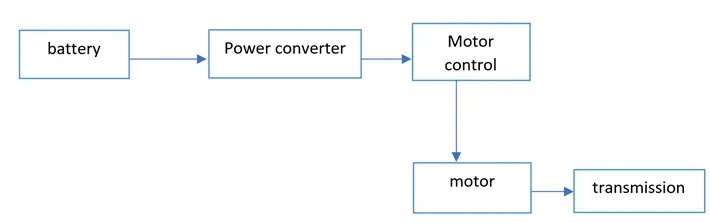
- Battery:
The battery of an electric car can be charged through the use of ordinary grid electricity at a specialized power station. But aside from the conventional lithium-ion battery technologies there are also other major battery technologies which can be used for electric cars.
- Lithium-ion batteries: this battery gives extra performance and range. However, it also carries the highest price tag. Lithium-ion batteries are lighter than lead acid and nickel metal. These are also the batteries used in digital cameras and smartphones.
- Lead acid batteries: this battery is the most popular. It is also the cheapest among the battery technology. What’s good about it is 97% recyclable.
- Nickel metal hydride batteries: this battery provides higher output and better performance but it cost much more than lead-acid batteries.
- motor controller: the motor controller of an electric car administers its complete operation and the distribution of its power at any given moment and it act as a floodgate between the motor and batteries. It helps monitor and regulator, motor, battery and accelerator pedal. It as microprocessor which can limit or redirect current. It is used to either improve the mechanical performance of the car or suit the operators driving style. There are also more refined controllers which are capable of greater accuracy and thus, higher efficiency.
- Electric motor: unlike a gasoline engine with lots of moving parts a motor only has one moving part. This makes it a very reliable source of motive power. Choosing an electric motor depends on the cars system voltage. They can be structured to use expensive and lighter compared to DC motors. They are also more common and they tend to suffer AC technology requires a more refined or sophisticated motor controller.
Detailed model study
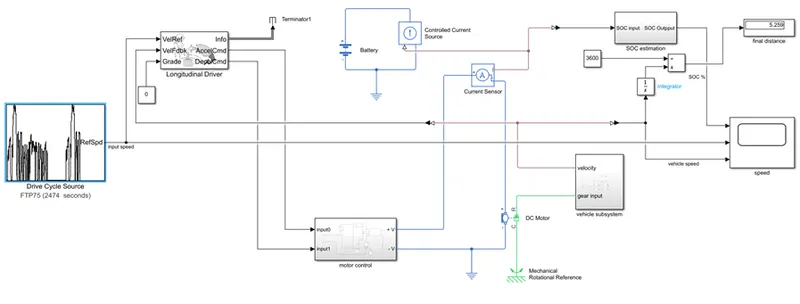
Sub-systems:
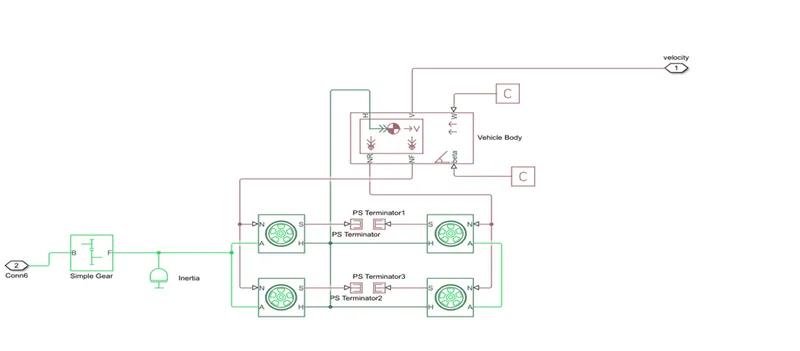
Represents a two axile vehicle body in motion accounts for body mass, aerodynamic drag, grade, externally defined mass and centre of gravity of the vehicle body
Input ports
W – wind velocity in m/s
Beta – grade angle in radians
Output ports
V – velocity in m/s
Vehicle body parameters
Vehicle body mass, centre of gravity, distance values and aerodynamic drag variable are modified
Pitch dynamic are kept ON with other variable values as default values
- Tire
Where n is normal force acting on tire, positive force is acting downwards/towards the contact surface
S – is slip value relative to tire and surface of contact
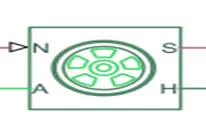
H – represent wheel hub which transmits thrust generated by the wheel to the body of the vehicle
A – represent axle on which the tires are mounted
Gear
A simple gear block is used to connect the motor to the rear axle of the vehicle
It represents the gear box which connects the input shaft to the base gear and output from the foller gear
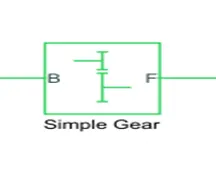
B – port associated with input shaft (motor shaft)
F - port associated with output shaft(axle)
MOTOR & POWER CONVERTER
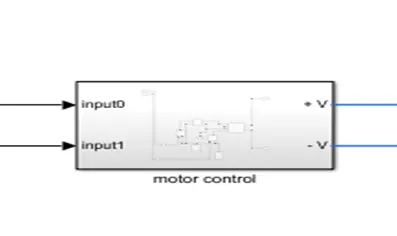
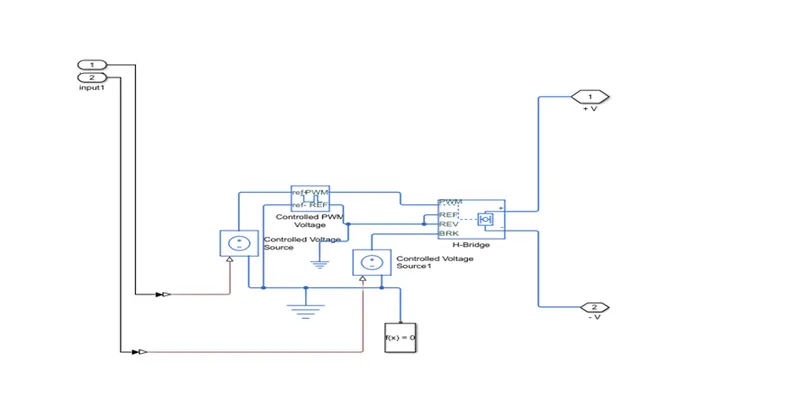
The motor and its control block is shown below
Motor control block
- H-bridge
The h-bridge helps in controlling the power that is input according to the requirement. The output provided are converted voltage as per the controlled parameters.
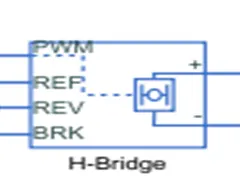
- DC motor
This dc motor which would give the rotational power to the wheels and the sole power generation source
The dc motor terminals are connects as mentioned below
+ is electrical signal to the motor positive terminal
- is electrical signal to the motor negative terminal
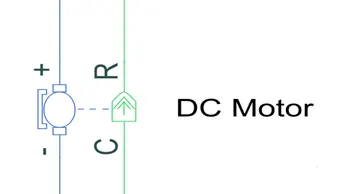
R -casing of the motor connected with the mechanical rotational reference block
C -rotor case connected to the mechanical rotational reference
The parameter consider are default
- Controlled PWM voltage
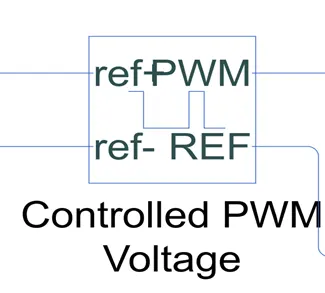
The controlled pwm voltage helps in keeping the modulated pulses as per the variable required pulses. So that the operation happens smooth and higher variation are not observed
The ports are connected as follows
Ref+ reference connected with acceleration commands from the driver model
Ref- is connected with the deceleration commands from the driver model
PWM is connected directly to the H- block
REF connected directly to the H- block
The parameter are set as default
- Battery source
The battery is connected as the power source to the model so that the power could be generated and the same power is transmitted accordingly to all the operating sources.
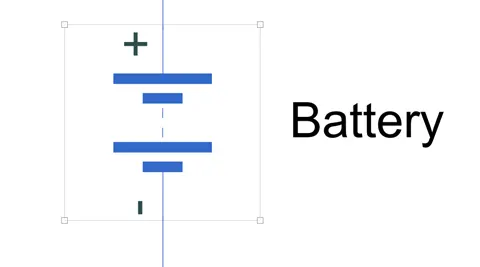
+ is positive terminal of the operating sources
-is negative terminal of the operating sources
The battery nominal voltage is rated as per 300volts
The internal resistance is as per 0.5 ohm and other set as default
Driver model
A parametric longitudinal speed tracking controller for generating normalized acceleration and braking commands based on reference and feedback velocities.
Use the external actions to input signals that can disable, hold, or override the closed-loop commands determined by the block. The block uses this priority for the input commands: disable, hold, override
The driver model has the input and output ports which are connected to the following
Velocity reference- drive cycle
Velocity feedback – distance calculation
Grade =0 for constant
Info connected to terminator
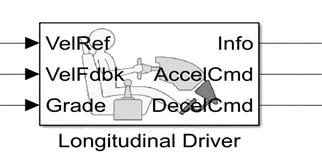
Acceleration command – controlled PWM source
Deceleration command – brake in H – bridge to maintain the speed according to the driver
Drive cycle
Starting with the drive cycle let consider a FTP drive cycle for the operation of the cycle
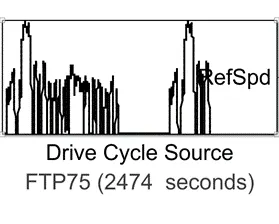
Generates a standard or user-specified longitudinal drive cycle. The block output is the vehicle longitudinal speed.
Outputs:
- Input speed v/s vehicle speed
We choose FTP75 drive cycle. the speed (m/s) from the drive cycle and speed feedback from the vehicle body is plotted in-order to understand the response of model according to the drive cycle data. Simulation provided the following result in speed comparison.
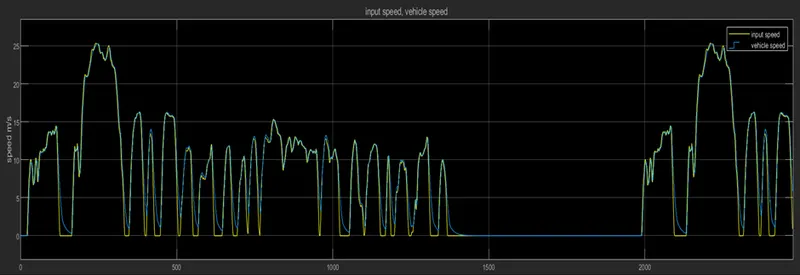
The speed comparison curve shows that the actual velocity (blue curve) of the vehicle almost follows the reference curve (yellow curve) through the simulation. during peak deceleration speed comparison curve shows a different in velocity which is encountered due to inertial effects of the vehicle and instantaneous velocity drops in reference curve
The vehicle travelled in 2474 sec is 5km
- SOC calculation
The FTP7 drive cycle is having several acceleration and deceleration profiles that varies randomly which helps to track the nature of battery discharge while different acceleration profiles and regenerative charging effects on deceleration profile. The Soc scope block helps in keeping track of the remaining battery capacity.
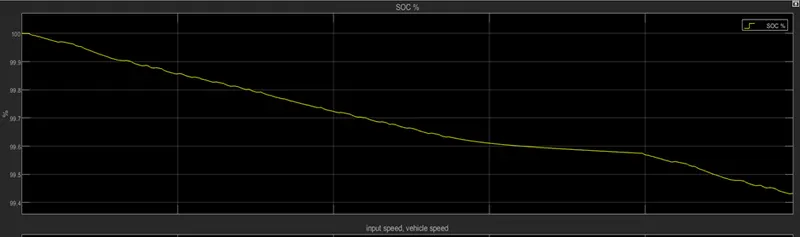
Starting from 100% after travelling a distance of 5.003 km in about 40mins the state of charge of the battery reaches around 99.4%
Conclusion:
- A basic electric vehicle model was created with Simulink and simulation was performed using FTP75 drive cycle. The speed comparison curve exhibits a fair response level of the model trying to deliver required performance levels to meet the acceleration and deceleration commands which can be identified from the minor variation in actual driver cycle curve and velocity feedback curve.
- The depth of discharge under FTP75 driver cycle from simulation is about 99% to travel a distance 5km in 40minutes
- A detailed and in-depth parameterization of the motor control and vehicle block variables would make the model to exactly follow the reference velocity signal which would in-turn enhance the performance of the system. Modification in battery block variables also might be helpful in reducing the depth – of – discharge percentage which in-turn provides higher mileage for the vehicle in a single charge-discharge cycle.
Future scope:
- Detailed parameterisation of block variables of the model to reduce the variation between reference speed signal and output speed.
- Optimisation of battery for increased mileage and peak performance.
- Detailed simulation rather than performing averaged mode simulation.
download model:https://drive.google.com/file/d/1md62Nk75TZGogYqWuyxLOYY8OSJR3Ylh/view?usp=sharing