Final Project: Design of an Electric Vehicle
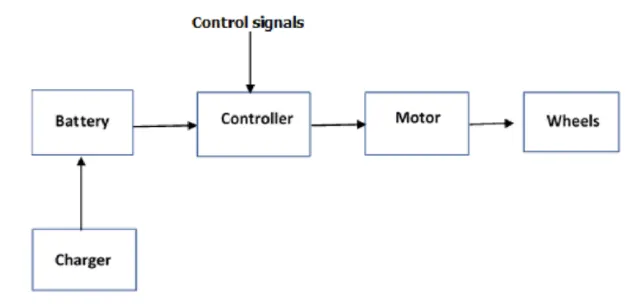
The above figure represents the block diagram of the electric vehicle.
Objectives:
- Create a MATLAB model of electric car which uses a battery and a DC motor.
- Report system level configurtions.
- Report model parameters.
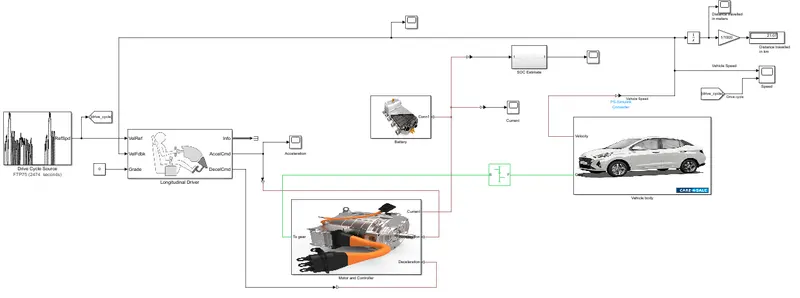
The above figure shows the matlab model of electric vehicle. The details of each block used in the above model will be explained below.
System level configuration.
Vehicle body block.
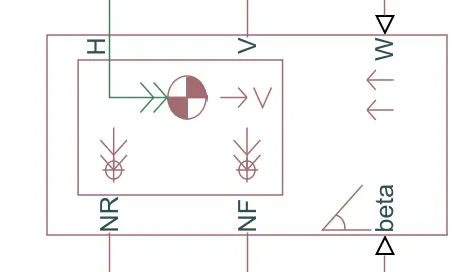
The block accounts for body mass, aerodynamic drag, road incline, and weight distribution between axles due to acceleration and road profile. This block has 6 ports which can be used to model the different parameters of the vehicle body. The ports are mentioned below.
H - This port is used to connect the hubs of the wheel to the vehicle body.
beta - Physical signal input port for road incline angle.
W - Physical signal input port for headwind speed.
V - Physical signal output port for vehicle longitudinal velocity.
NF - Front axle normal force. Physical signal output port for normal force on the front axle.
NR - Rear axle normal force. Physical signal output port for normal force on the rear axle.
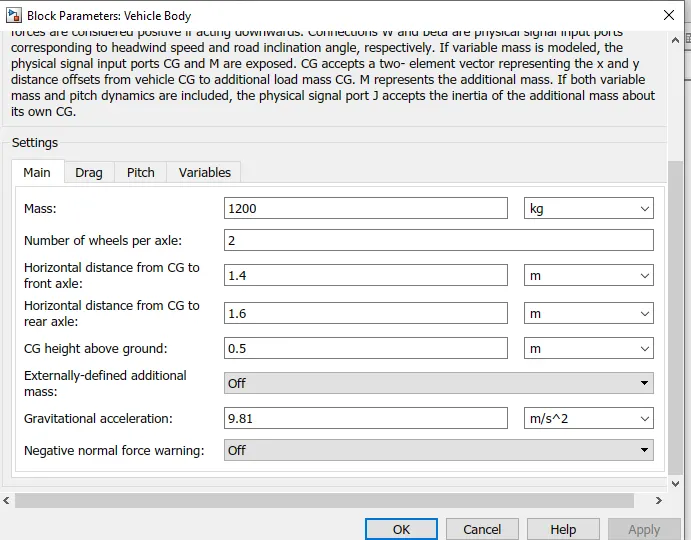
The below figure shows the model parameters of vehicle body block.
Vehicle body subsystem (with tyres)
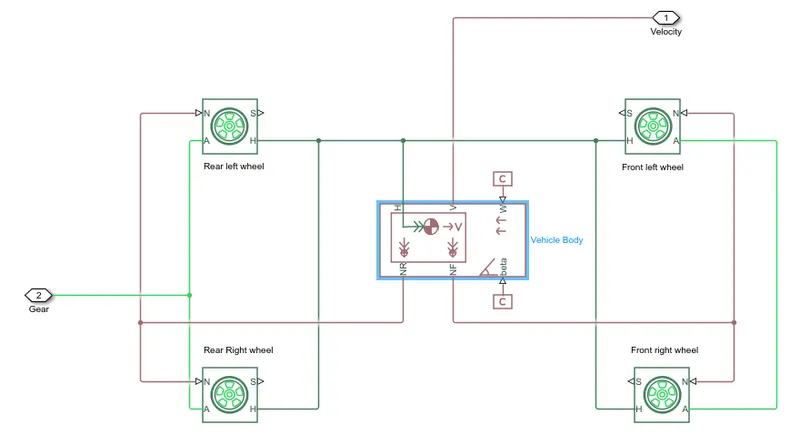
- The above blocks i.e. the vehicle body block and the tyres block make the vehicle body subsystem. There are 4 tyres in the subsytem in which the 2 right tyres are the front wheels and the left tyres are the rear wheels. These front and rear wheels are connnected to the hub of the vehicle body.
- The rear axle is connected are connected to the gearbox as we hae considered rear wheel drive vehicle. The wind velocity and the hill climbing angle are connected to a constant block and are kept as zero.
Tire block.
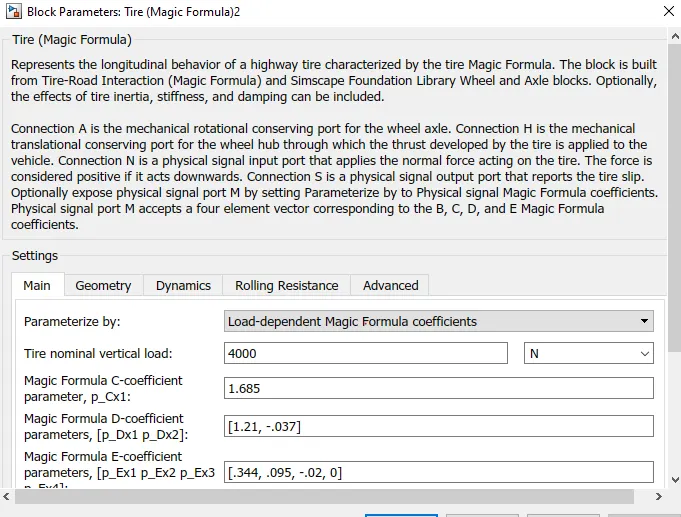
- The Tire (Magic Formula) block models the tire as a rigid wheel-tire combination in contact with the road and subject to slip.
- When torque is applied to the wheel axle, the tire pushes on the ground (while subject to contact friction) and transfers the resulting reaction as a force back on the wheel. This action pushes the wheel forward or backward.
- In this block we can change the geometry, dynamics, rolling resistance of the tires.
Simple gear block
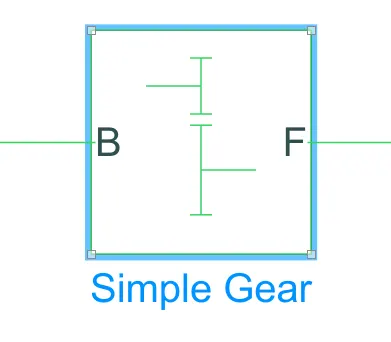
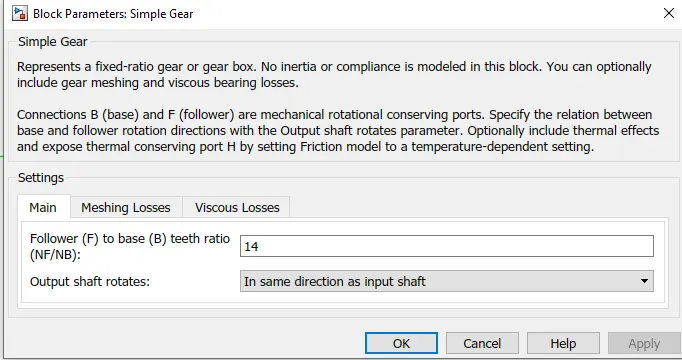
- The block model the gear system with fixed gear ratio with no inertia effects.
- We can modify the gear teeth ratio. Here the follower to base teeth ratio is set to 14. Also the outshaft and the input shaft rotates in the same direction
Motor and Controller subsystem
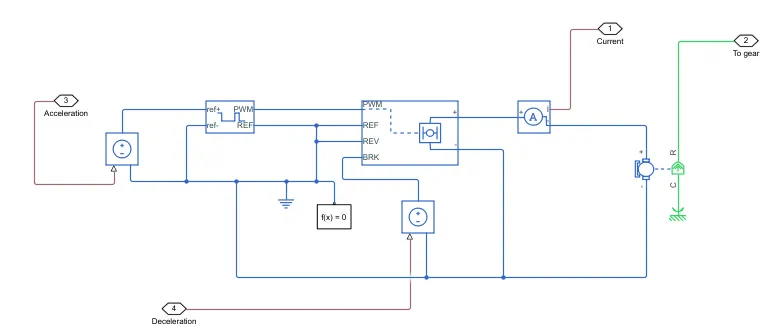
The blocks included in this subsystem are:
- DC motor
- H-Bridge
- Controlled PWM voltage
- Controlled voltage cource
- Current sensor
DC motor
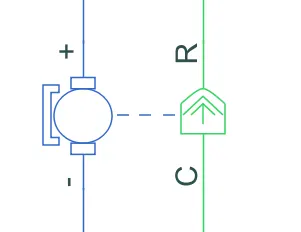
We have selected DC motor block for the electric vehicle model because the DC motors are easy to model and have fewer parameters to operate. There are two sides of the DC motor block, the mechanical side is on the right side and the electrical side on the left. The mechanical side has two ports C and R. C stands for casing and is the stationary part and R is the rotor which rotates and outputs torque. The electrical side has a positive and negative terminals for the voltage to be applied. The C port of the motor is connected to the mechanical rotational reference as it will be stationary. The R port is connected to the geat system.
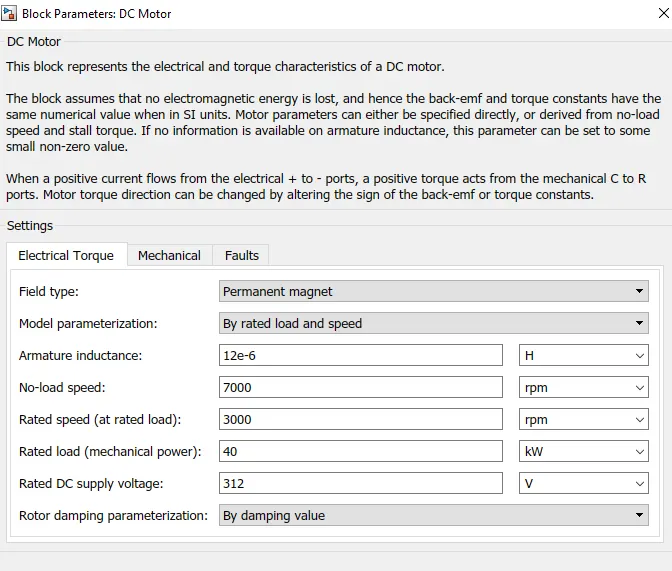
The DC motor block can be used to input the motor related parameters. We can also selecte the the type of DC motor we want, either permanent magnet type or wound type.
H-Bridge.
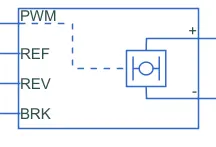
This is the power converter which is needed to provide power of the correct form and magnitude from one component to other. In case of EV, a power converter is used to provide DC voltage from battery to the DC motor, so that the motor can functionat the required parameters. Here we have used H-Bridge motor drive as power converter. The left side terminals of the H-bridge are for controlling the voltage signals and the right side terminals are for providing the controlled voltage to the DC motor.
The left side ports are,
- PWM - Pulse width modulation
- REF - Reference
- REV - Reverse
- BRL - Brake
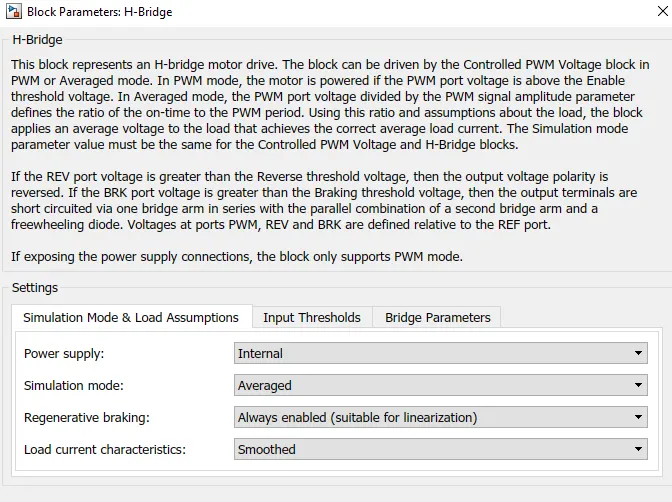
The simulation is kept in averaged model because PWM model will take longer duration of simulation. In the section of bridge parameters the output voltage amplitude was modified to 312V according to the DC motor.
Controlled PWM voltage
The controlled PWM voltage block is used to provide a controlled pulse width modulated voltage to the H-Bridge. The pulses of voltage created by this block is dependent on the duty cycle which is the ratio of time the switch is ON to the time taken for one cycle. The duty cycle formula is given by
Duty Cycle`= T_(on)/(T_(off)+T_(on))`
Duty Cycle `=T_(on)/T_(cyc)`
where `T_(on)` = ON time
`T_(cyc)` = time take for one cycle
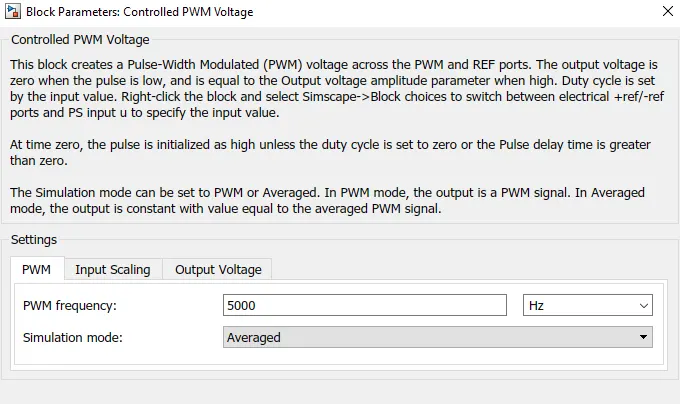
Here all the parameters are set to their default values. We have chosen the averaged simulation mode to reduce the simulation time. The parameters related to input scaling and output scaling are unchanged.
Controlled voltage source
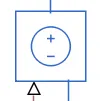
This block provides the necessary voltage that is powerfull enough to maintain the voltage at the output regardless of the current that passes through it. In this subsystem two control voltage blocks have been used. One block is used for acceleration and other to provide the voltage for deceleration.
Electrical reference block is used to create grounding effect for electrical circuits. In the model, we have used it in 2 parts, first to create an electrical ground between controlled voltage source, controlled PWM voltage, H bridge blocks. The second is for the battery system which will be modelled afterwards.
Solver configuration block is used to solve any necessary equations in a model. We have used them in connection to the REV portof the H-bridge block.
Battery Subsystem.
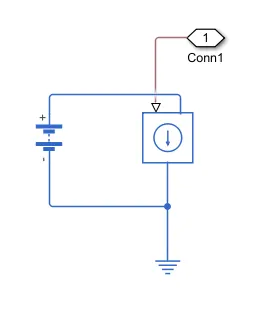
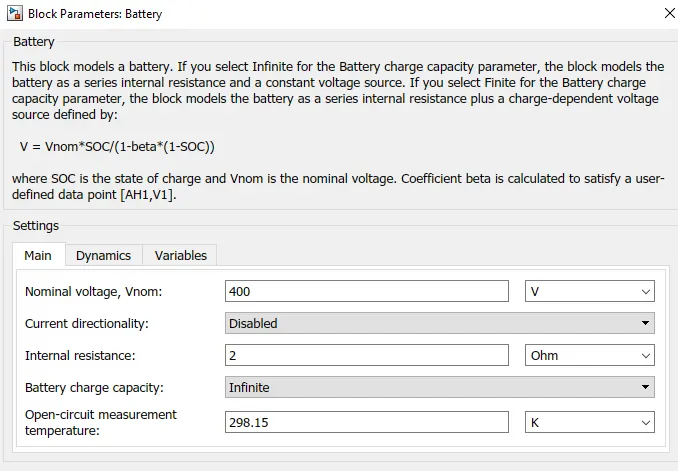
The battery will be the energy store of the EV and will contain the electrical energy in DC form and will provide this energy to operate the EV. Nominalvoltage has been set to 400V and internal resistance to 2 ohms and infinite charging capacity.
Controlled current source.
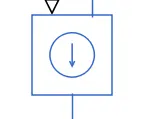
This block is part of thr battery subsystem.Similar to the voltage source, this block produces an ideal current that is power enough to maintain the specified current regardless of the voltage across it.
SOC (State of Charge) estimate subsystem.
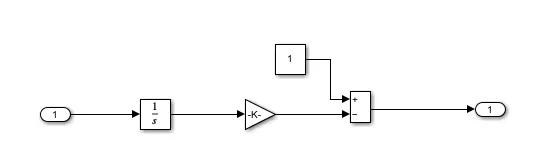
To measure the state of charge of the battery, a subsystem is created of various blocks. The first block is the integrator block used to handle data transfer and integrate the value of current signal with respect to time. Next is the gain block used to update the signal coming from the integrator block. Assuming that the battery is always fully charged a constant block with a value of 1 representing 100% is added. Next a sum block is used to perform addition and substraction.
Speed Measurement
In order to measure the speed the scope block has been modified to have two input ports where one port takes the output velocity from the vehicle subsytem block and other port takes the ouput signal from the drive cycle. This is done to compare the vehicle speed with the drive cycle.
Distance measurement
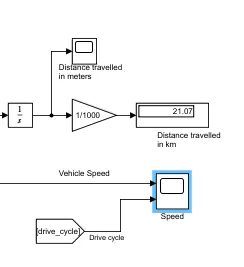
Mathematical blocks and scope blocks are used to measure the distance travelled by the vehicle. First we have to integrate the velocity signal that is the output from the vehicle subsystem. After the integrator block we get teh distance in meters. This distance is in meters is divided by 1000 using the gain block. This gives us the distance travelled in km.
Longitudinal driver and drive cycle.
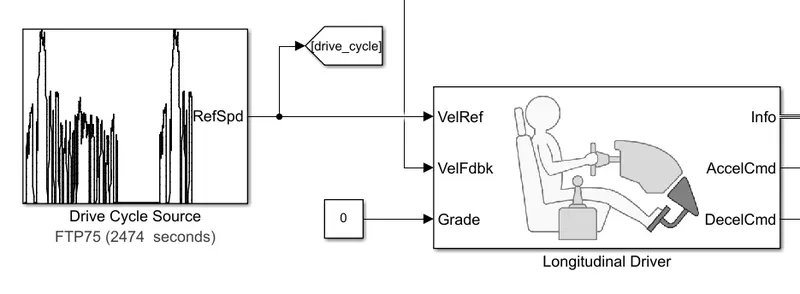
The longitudinal driver block is used for giving normalized acceleration and deceleration commands to a controller based on two sets of data. The first data is the reference velocity and second data is the feedback velocity. The reference velocity data coming from the drive cycle source and is compared to the feedback velocity data coming from the vehicle body. If the reference velocity is greater than the feedback velocity, an acceleration command will be given as an output to the controlled voltage source. If the reference velocity is lesses than the feedback velocity, deceleratioon command is given as output to another controlled voltage source. For the output acceleration and deceleration commands we have used simulink-PS converter block.
Drive Cycle
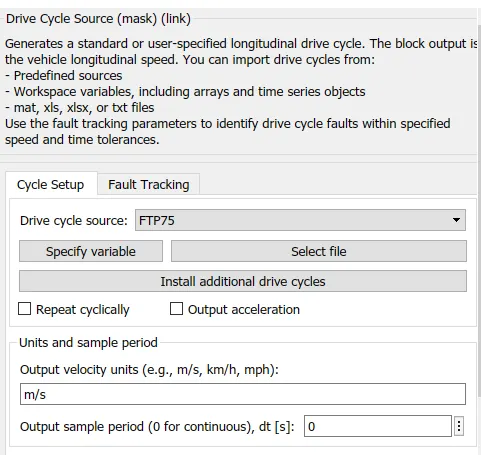
The drive cycle is a data set that contains velocity abd time data for the purpose of modelling the motion of a vehicle. It is a plot of the vehicle velocity against time and it is made to resemble the typical driving conditions that a consumer may experience themselves in. Here we have used FTP74 drive cycle to simulate the EV. Drive cycles are used for various testing procedures such as mileage, pollution test and acceleration and top speed test.
Results:
We ran the above drive cycle for the EV model and took outputs like speed, Current, SOC, distance travelled. Before simulation the run time was updated according to the drive cycle time 2474 seconds.
Speed Scope
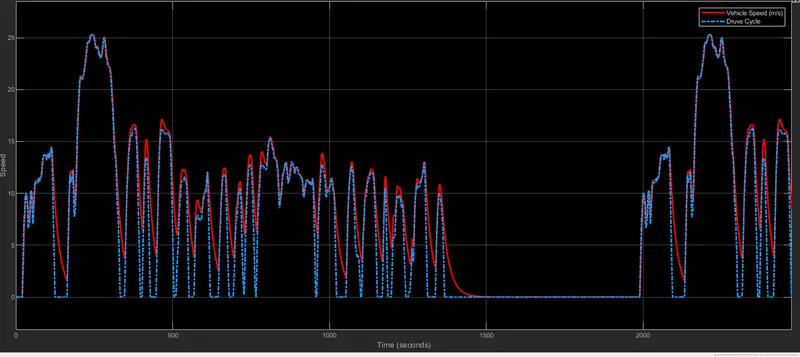
In the above scope we can see the two signals. The red signal represents the vehicle speed and the blue signal is the FTP75 drive cycle. As we can see from the above plot that the longitudinal driver successfully follows the drive cycle data, processes it and controls the vehcile speed according to the reference speed. The graph overlaps effectively during acceleration and deceleration.
Current Scope
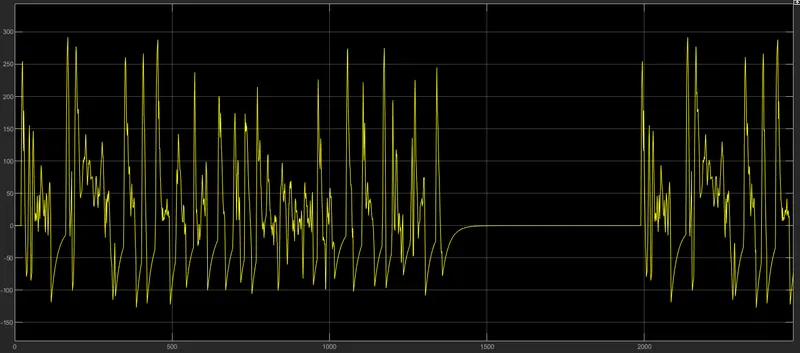
The above plot shows the current flowing from the battery to the motor and varied with the drive cycle.
SOC scope
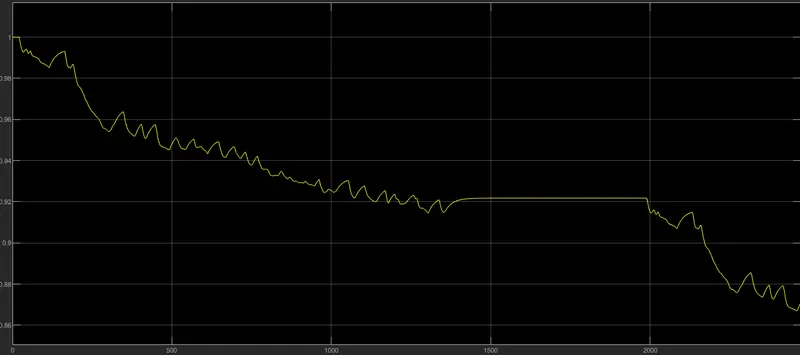
The SCO scope shows the how the state of charge of battery varies over the drive cycle time. The battery was modelled to begin with an SOC of 1 i.e. 100%. As the simulation starts the charge of the battery gets decereased and when the vehicle is in braking mode the uplift in the graph shows that regenerative braking is working to maintain the battery charge. From the above plot we can see that the SOC has decereased to 87% after 2474 seconds.
Distance travelled.
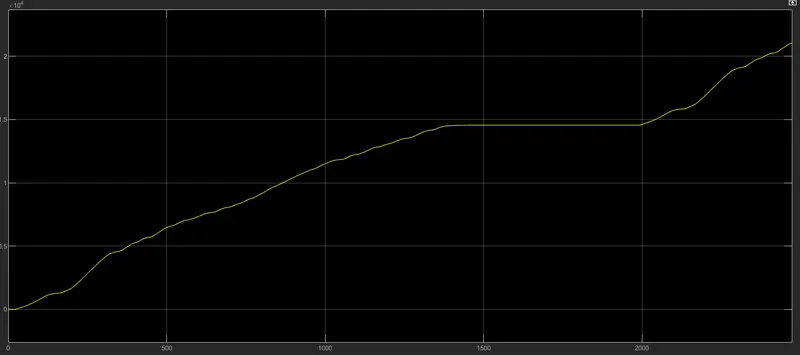
The above plot shows the distance travelled by the vehicle. The vehicle travels a distance of approximately 21km after 2474 seconds.
Conclusion
- A simple simulink model of EV is modelled successfully.
- The EV model outputs the required parameters like speed, distance travelled, battery state of charge etc.
- The model has some regenerative braking feature which is evident from the SOC plot.
The matlab model is uploaded on below link.
https://drive.google.com/file/d/1buW0133jL2AFTJgPiE9cUfWFgODXTtvf/view?usp=sharing