Final Project: Design of an Electric Vehicle
Aim:-
Create a MATLAB model of electric car which uses a battery and a DC motor. Choose suitable blocks from Powertrain block set. Prepare a report about your model including following:
Objectives:
1. System level configurations
2. Model parameters
3. Results
4. Conclusion
THEORY:-
ELECTRIC VEHICLE:-
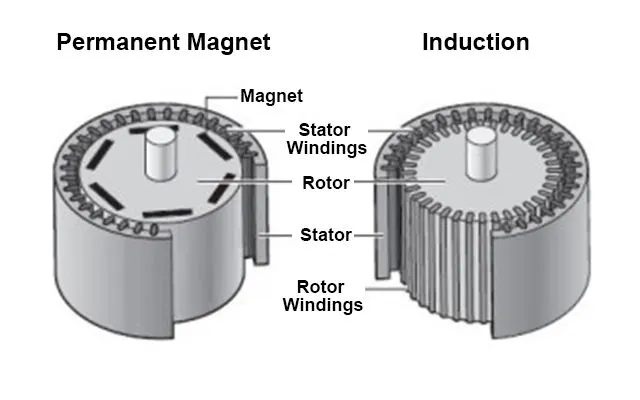
An electric car is a vehicle that is propelled by one or more electric motors, using energy stored in rechargeable battery packs. These are eco-friendly and has higher efficiency compared to ICE cars. An electric vehicle is 69-72% efficient when counted against stored chemical energy and around 59-62% efficient when counted against required energy to recharge. They use electric motors for propulsion. The most common types of motors used are Permanent Magnet Synchronous Motor (PMSM) and three phase induction motor.
In today’s world electric vehicles are increasingly becoming a part of modern life. Its eco-friendliness and smooth driving have attracted many conscious modern consumers. Electric vehicles are quite different as compared to traditional vehicles with internal combustion engines. Electric vehicles operate with an electric motor instead of an internal combustion engine that generates power by burning a mixture of fuel and gases. The running costs of Electric vehicles are low as it has fewer moving parts for maintenance. In order to create awareness of the issue of global warming and to safeguard the environment electric vehicles are seen as a possible replacement for current generation of automobile industry.
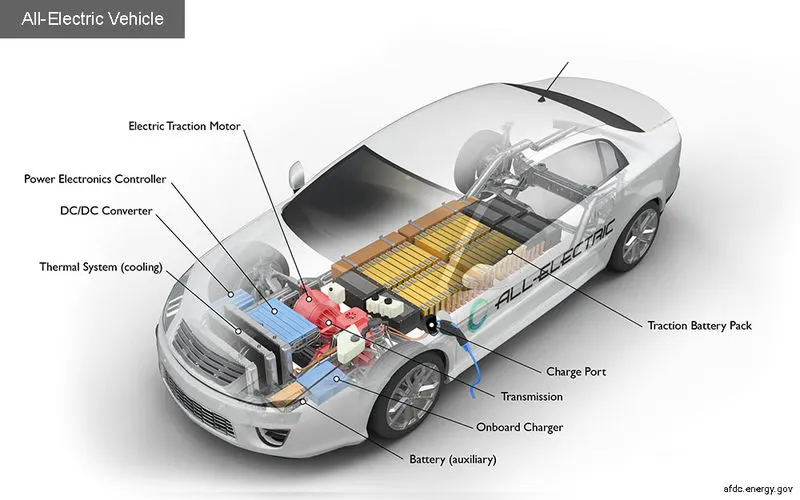
The main components of an electric vehicle are:-
- Battery (auxiliary)
- Electric traction motor
- Onboard charger
- Thermal system (cooling)
- Power electronics controller
- DC/DC converter
- Charge port
- Transmission (electric)
- Traction battery pack
- BATTERY (AUXILIARY)
The auxiliary battery of the electric vehicle provides electricity to power the accessories of the vehicle.
- ELECTRIC TRACTION MOTOR
Power is taken from the traction battery pack and with this the motor drives the wheels of the vehicle. Some vehicles use motors which serve as drive as well as regeneration.
- ONBOARD CHARGER
AC electricity supplied via the charge port is converted to DC power for charging the traction battery. It also communicates with the charging equipment and monitors battery characteristics such as voltage, current, temperature and state of charge while charging the pack.
- THERMAL SYSTEM (COOLING)
The thermal system for cooling makes sure that proper operating temperature range of the engine, power electronics, electric motor and other components are maintained
- POWER ELECTRONICS CONTROLLER
The flow of electricity which is delivered by the traction battery to the electric motor is controlled and the required speed and torque is produced.
- DC/DC CONVERTER
The high voltage of the traction battery is stepped down to a low voltage DC power to run the vehicle accessories and recharge the auxiliary battery.
- CHARGE PORT
The charge port is an external power supply from which the traction battery in the electric vehicle is charged.
- TRANSMISSION (ELECTRIC)
The transmission converts electric power to mechanical power in order to drive the wheels of the vehicle
- TRACTION BATTERY PACK
The traction battery pack stores electricity for use by the electric traction motor.
Motor comparison,
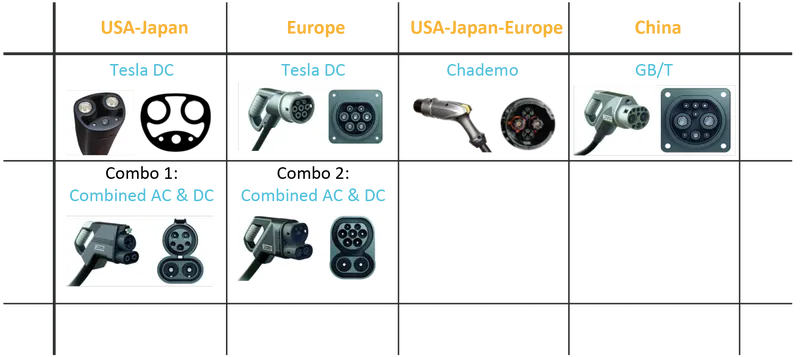
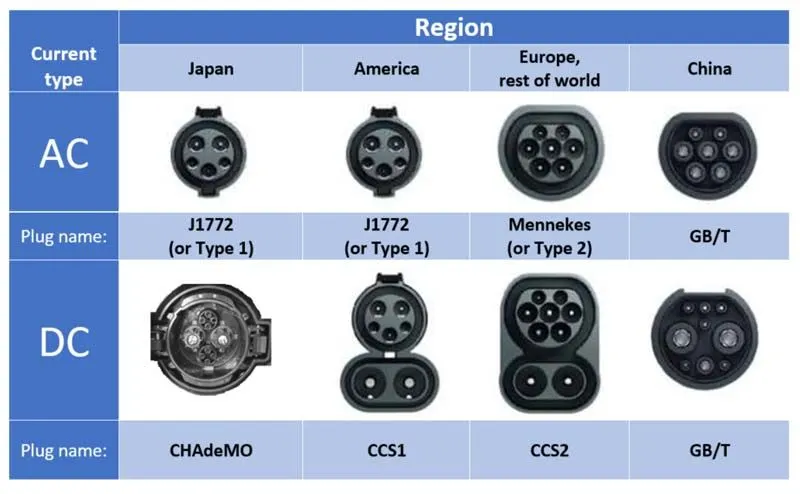
The battery packs are recharged using AC/DC charging technologies. AC charging is slow as it has to be converted to DC. Hence for fast charging DC chargers are used. The charging sockets has different standards as shown below,
BLOCK DIAGRAM:-
The block diagram for an Electric vehicle which uses a battery and a DC motor is shown below,
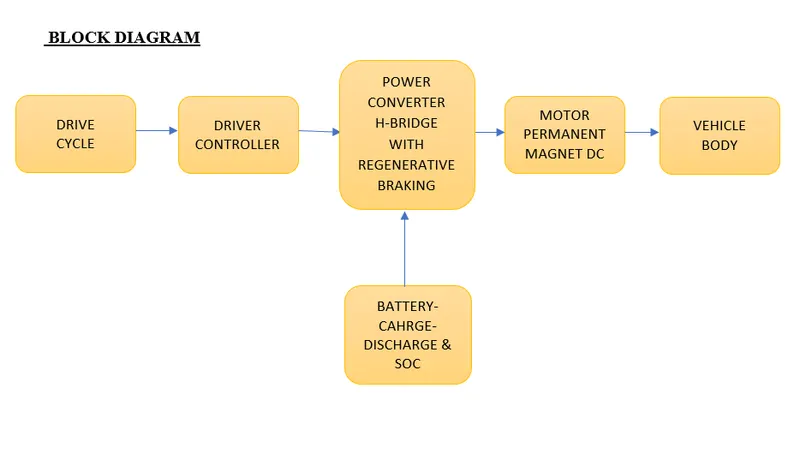
Drive cycle: A driving cycle is a series of data points representing the speed of a vehicle versus time. Driving cycles are produced by different countries and organizations to assess the performance of vehicles in various ways, as for instance fuel consumption, electric vehicle autonomy and polluting emissions.
Driver controller: The controller transforms the battery's direct current into alternating current (for AC motors only) and regulates the energy flow from the battery. ... In the early electric vehicles with DC motors, a simple variable-resistor-type controller controlled the acceleration and speed of the vehicle.
Power converter: In electric engineering, a DC to DC converter is a category of power converters and it is an electric circuit which converts a source of direct current (DC) from one voltage level to another, by storing the input energy temporarily and then releasing that energy to the output at a different voltage.
Motor: Today, majority of the electric cars are utilizing DC motors (4 kW and less power). Induction Motor is an exceptionally well known AC motor. A considerable lot of the advanced power EV (more than 5kW), utilize Induction Motors.
Battery: Most plug-in hybrids and all-electric vehicles use lithium-ion batteries like these. Energy storage systems, usually batteries, are essential for hybrid electric vehicles (HEVs), plug-in hybrid electric vehicles (PHEVs), and all-electric vehicles (EVs).
Vehicle body: Car bodies are most often made of steel, which is strong and durable, but also pretty heavy—especially for electric power to move on its own.
EV model in simulink:-
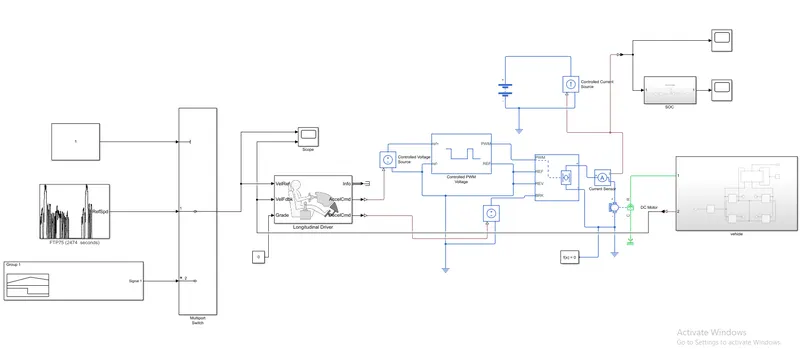
Explaination of blocks used in model:-
- Drive cycle source:-
Drive cycle is a data set that contains veocity and time data for the purpose of modeling the motion of vehicle. The drive cycie wnli be a plot of the velocity against the time and it is made to resemble typical driving conditions that a driver may experience themselves in .For instance they can model highway drivng situations ,driving in urban aress or driving with full power etc. Drive cycles are used by automotive companies for various testing procedures such as mileage, pollution tests and acceleration and top speed tests. There are various different drive cycles that are industry standard eg Urban Dynamometer Driving Schedule(UDDS) FTP 75 .
In my EV model a drive cycle is used as the reference velocity data for the longitudnal driver block to send acceleration or deceleration commands according to the dive ycle There are 3 ways of implemerting a drive cycle.One method is to create of own drive cycle with spreadsheet of velocity data in one column and time data in another column,Another method is to use a signal bulder block and create signals that represent the velocities at which the vehicle should travel and the durations for which those velocities are to be maintaned ,The last method is to use the industry standard drive cycles which are in- bult in to the SIMLINK library.In my case, I have used an industry standard WOT drive cycle This drive cycle stands for Wide Open Throttle and a models the situation where the vehicle is made to accelerate at ful power and mantained at a particular speed and made to decelerate back to rest.
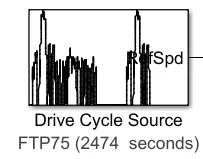
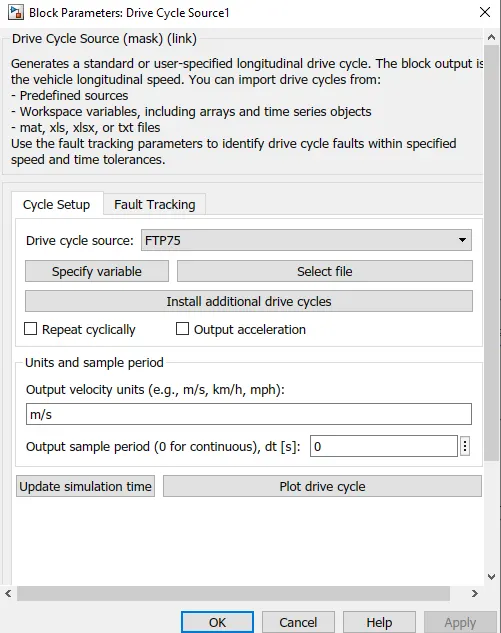
The Drive Cycle Source block generates a standard or user-specified longitudinal drive cycle. The block output is the specified vehicle longitudinal speed, which you can use to:
-
Predict the engine torque and fuel consumption that a vehicle requires to achieve desired speed and acceleration for a given gear shift reference.
-
Produce realistic velocity and shift references for closed loop acceleration and braking commands for vehicle control and plant models.
-
Study, tune, and optimize vehicle control, system performance, and system robustness over multiple drive cycles.
Drive cycles from predefined sources. By default, the block includes the FTP–75 drive cycle.
- Multiport switch:-
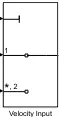
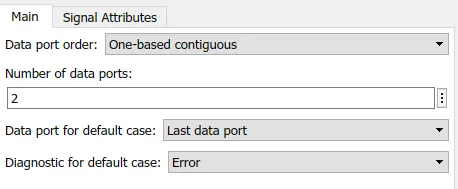
Pass through the input signals corresponding to the truncated value of the first input. The inputs are numbered top to bottom (or left to right). The first input port is the control port. The other input ports are data ports.
- Motor Controller:-
(i) H - Bridge:
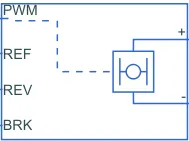
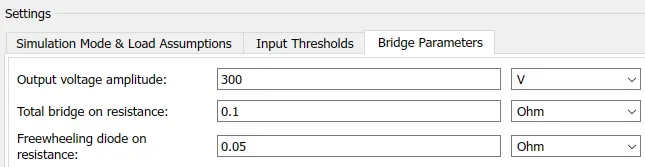
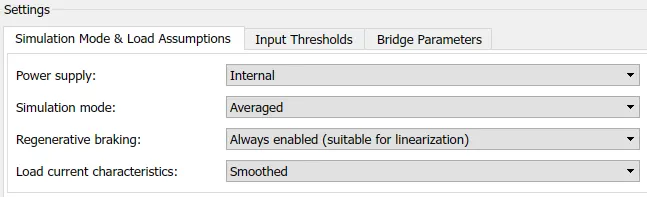
This block represents an H-bridge motor drive. The block can be driven by the Controlled PWM Voltage block in PWM or Averaged mode. In PWM mode, the motor is powered if the PWM port voltage is above the Enable threshold voltage. In Averaged mode, the PWM port voltage divided by the PWM signal amplitude parameter defines the ratio of the on-time to the PWM period. Using this ratio and assumptions about the load, the block applies an average voltage to the load that achieves the correct average load current. The Simulation mode parameter value must be the same for the Controlled PWM Voltage and H-Bridge blocks.
If the REV port voltage is greater than the Reverse threshold voltage, then the output voltage polarity is reversed. If the BRK port voltage is greater than the Braking threshold voltage, then the output terminals are short circuited via one bridge arm in series with the parallel combination of a second bridge arm and a freewheeling diode. Voltages at ports PWM, REV and BRK are defined relative to the REF port.
If exposing the power supply connections, the block only supports PWM mode.
(ii) Controlled PWM Voltage:-
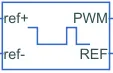
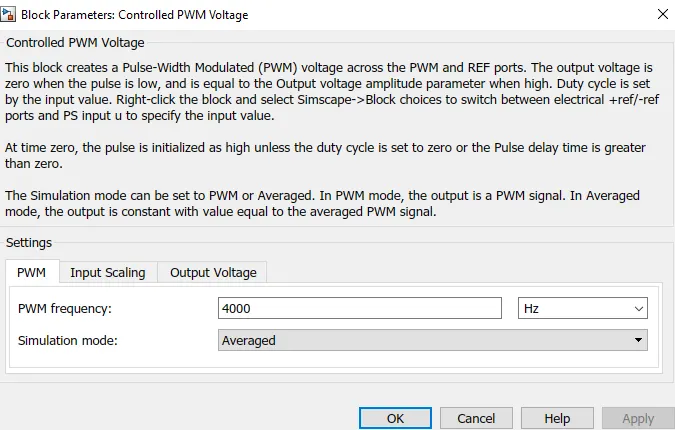
This block creates a Pulse-Width Modulated (PWM) voltage across the PWM and REF ports. The output voltage is zero when the pulse is low, and is equal to the Output voltage amplitude parameter when high. Duty cycle is set by the input value. Right-click the block and select Simscape->Block choices to switch between electrical +ref/-ref ports and PS input u to specify the input value.
At time zero, the pulse is initialized as high unless the duty cycle is set to zero or the Pulse delay time is greater than zero.
The Simulation mode can be set to PWM or Averaged. In PWM mode, the output is a PWM signal. In Averaged mode, the output is constant with value equal to the averaged PWM signal.
(iii) Controlled voltage source:-

The block represents an ideal voltage source that is powerful enough to maintain the specified voltage at its output regardless of the current passing through it. The output voltage is V = Vs, where Vs is the numerical value presented at the physical signal port.
- Longitudinal driver:-
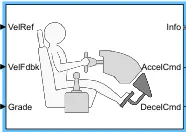
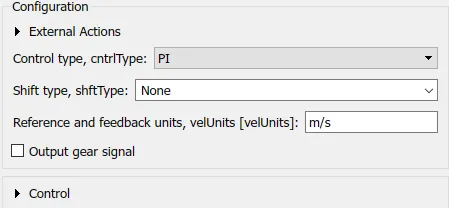
A parametric longitudinal speed tracking controller for generating normalized acceleration and braking commands based on reference and feedback velocities.
Use the external actions to input signals that can disable, hold, or override the closed-loop commands determined by the block. The block uses this priority for the input commands: disable, hold, override.
- DC motor:-
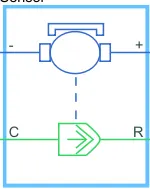
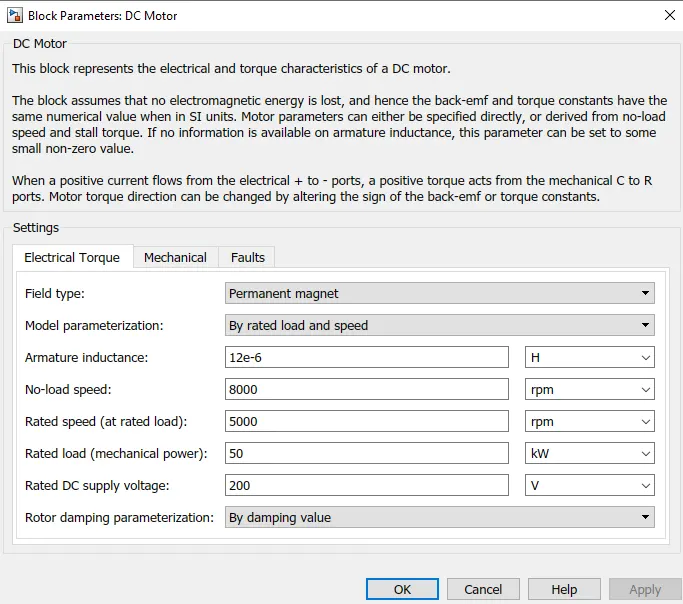
This block represents the electrical and torque characteristics of a DC motor.
The block assumes that no electromagnetic energy is lost, and hence the back-emf and torque constants have the same numerical value when in SI units. Motor parameters can either be specified directly, or derived from no-load speed and stall torque. If no information is available on armature inductance, this parameter can be set to some small non-zero value.
When a positive current flows from the electrical + to - ports, a positive torque acts from the mechanical C to R ports. Motor torque direction can be changed by altering the sign of the back-emf or torque constants.
- Battery:-

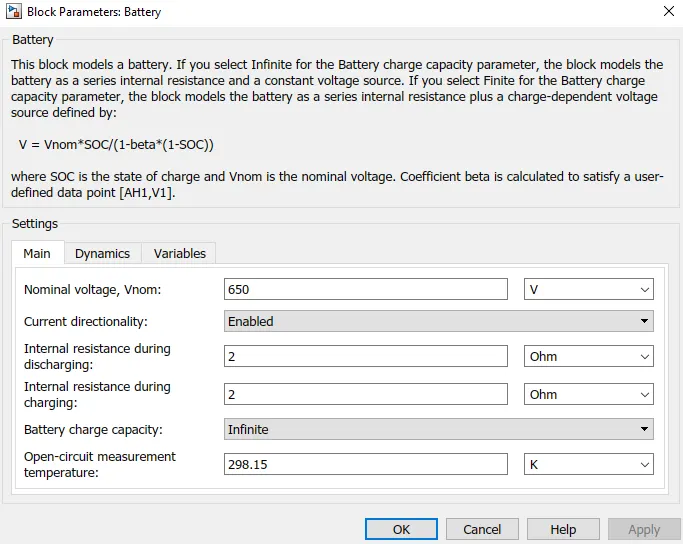
This block models a battery. If you select Infinite for the Battery charge capacity parameter, the block models the battery as a series internal resistance and a constant voltage source. If you select Finite for the Battery charge capacity parameter, the block models the battery as a series internal resistance plus a charge-dependent voltage source.
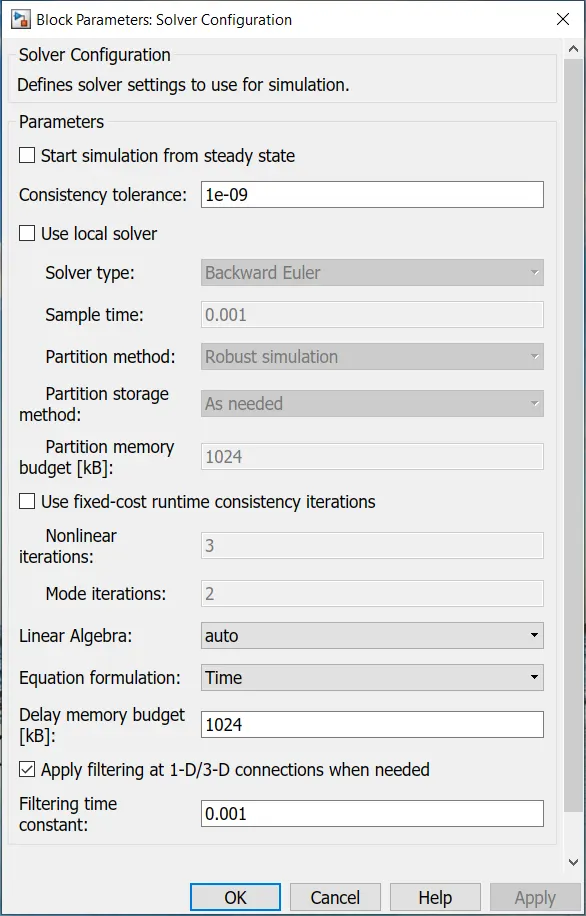
- SOLVER CONFIGURATION BLOCK:-
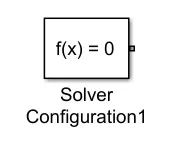
The solver configuration block requires solver settings information for simulation. The block specifies the solver parameters that the model requires before running the simulation.
- Voltage sensor:-

The block represents an ideal voltage sensor, that is, a device that converts voltage measured between any electrical connections into a physical signal proportional to the voltage.
Connections + and - are conserving electrical ports through which the sensor is connected to the circuit. Connection V is a physical signal port that outputs voltage value.
- Current sensor:-

The block represents an ideal current sensor, that is, a device that converts current measured in any electrical branch into a physical signal proportional to the current.
Connections + and - are conserving electrical ports through which the sensor is inserted into the circuit. Connection I is a physical signal port that outputs current value.
- Controlled current source:-

The block represents an ideal current source that is powerful enough to maintain the specified current through it regardless of the voltage across it. The output current is I = Is, where Is is the numerical value presented at the physical signal port.
- PS-Simulink and Simulink-PS Converter:-
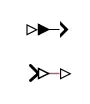
Converts the input Physical Signal to a Simulink output signal.
Converts the Simulink input signal to a Physical Signal.
- Mechanical rotational reference:-

This block represents a mechanical rotational reference point, that is, a frame or a ground. Use it to connect mechanical rotational ports that are rigidly affixed to the frame (ground).
- Electrical reference:-

Electrical reference port. A model must contain at least one electrical reference port (electrical ground).
EXPLANATION OF THE MOTOR CONTROLLER :-
- The motor controller subsystem contains mainly of H- bridge and a controlled PWM voltage block.
- A controller is needed to control the motor according to the needs which is why a controller block is used which is the H-bridge.
- H- bridge is used to supply power from the battery to the D.C motor. H- bridges has four switches that give the controlled D.C voltage supply to the D.C motor that can control the supply of voltage.
- In H-bridge block parameters there are two options for simulation mode to chooses from either averaged or PWM but averaged mode is chosen since the simulation time is in mins or hours and it is faster as compared to PWM mode.
- The output voltage amplitude of the H- BRIDGE BLOCK is same as the rated D.C supply voltage to the motor.
- In the H-BRIDGE BLOCK there is a PWM signal input port, where PWM input can be given to this port. The REF and REV ports are grounded using electrical reference block. This is done to prevent reverse operation of the motor. BRK port is connected to a controlled voltage source which helps in carrying out regenerative braking.
- PWM signals is given to the H- BRIDGE BLOCK by using CONTROLLED VOLTAGE BLOCK. This block helps in creating PWM signals which are generated according to the variable voltage.
- The PWM and REF port of the controlled PWM voltage is connected to PWM and REF port of the H- BRIDGE. The ref- port is grounded since we don’t need negative voltage. The ref+ port is connected to CONTROLLED VOLTAGE BLOCK so that the input voltage is the same always.
- Controlled PWM voltage block is connected to the input PWM port in the H- bridge block.
- This block will apply pulses and based on these pulses from the fixed battery voltage variable output voltage will be available to the motor and the motor torque and motor speed are changed.
- Finally, the subsystem is created with the following blocks and the subsystem will control the power supply to the D.C motor.
- Vehicle body subsystem:-
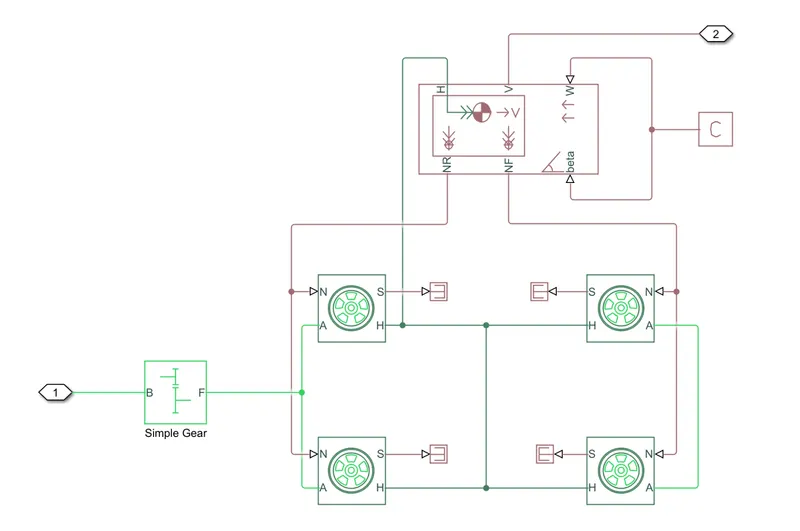
- Simple gear:-

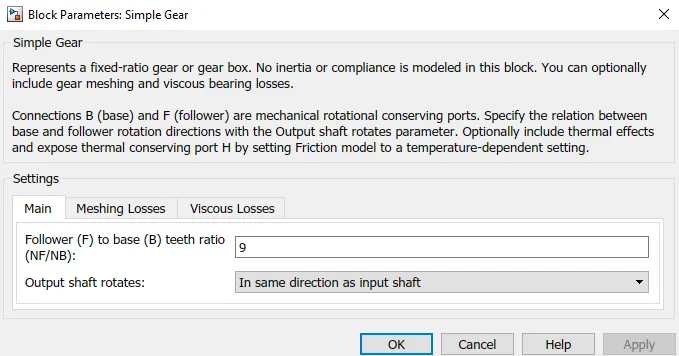
Represents a fixed-ratio gear or gear box. No inertia or compliance is modeled in this block. You can optionally include gear meshing and viscous bearing losses.
Connections B (base) and F (follower) are mechanical rotational conserving ports. Specify the relation between base and follower rotation directions with the Output shaft rotates parameter. Optionally include thermal effects and expose thermal conserving port H by right-clicking on the block and selecting Simscape block choices to switch between variants.
- Tire (magic formula):

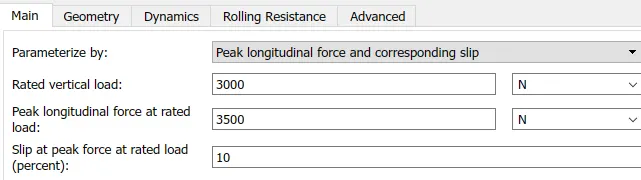
Represents the longitudinal behavior of a highway tire characterized by the tire Magic Formula. The block is built from Tire-Road Interaction (Magic Formula) and Simscape Foundation Library Wheel and Axle blocks. Optionally, the effects of tire inertia, stiffness, and damping can be included.
N - This port stands for Nomal and is the physical signal input port for the normal force acting on the tire and is considered positive in the dowrwards direction. .
S- This port stands far Slip and is the physical signal output port is that reports the slip acting on the tire.
A- This port stands for Axle and is the mechanical rolational conserving port far the wheel axle.
H- This port stands ror Hub and is the mechanical translational conserving port for the wheel hub through which the thrust developed by the tires is applied to the vehicle body
- Vehicle body:
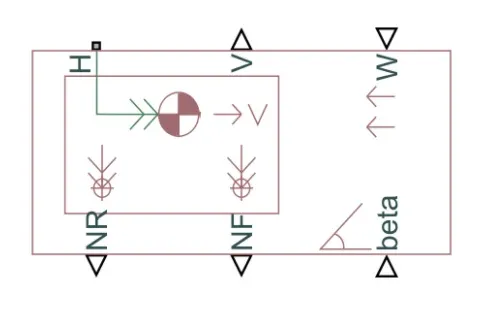
The six ports are used to model various characteristics of the vehicle body.
- H- This stands for Hub and is used to connect the hubs of the wheels to the main body of the vehicle.
- V- This is a physical signal output port which stands for Velocity and is used to output the speed / velocily at which the vehicle is moving at
- W- This is a physical signal input port and allows us to model a'headwind acting on the vehicle by giving a speed far it
- NR- This is a physical signal output port lo model the rear wheel normal forces.
- NF- This is a physical signal output to model the front wheel normal forces. .
- beta- This is a physical signal input port and allows us to model the vehicle on an inclination angle to create the effect of a hill climbing force.
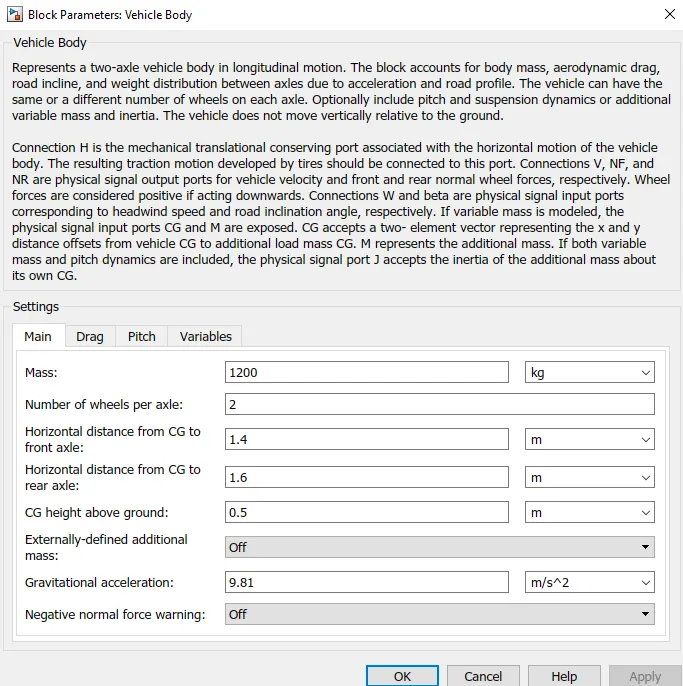
We need to double click on the block to model its parameters.
Firstly lets take main parameters i nwhich we can add the mass ,no of wheels and other parameters.Let us leave them as the default values given
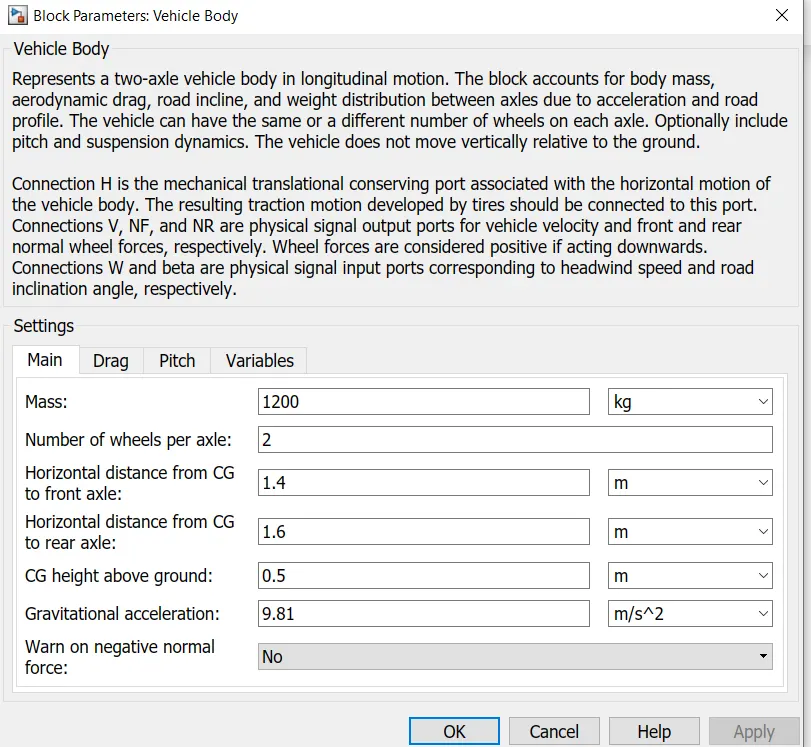
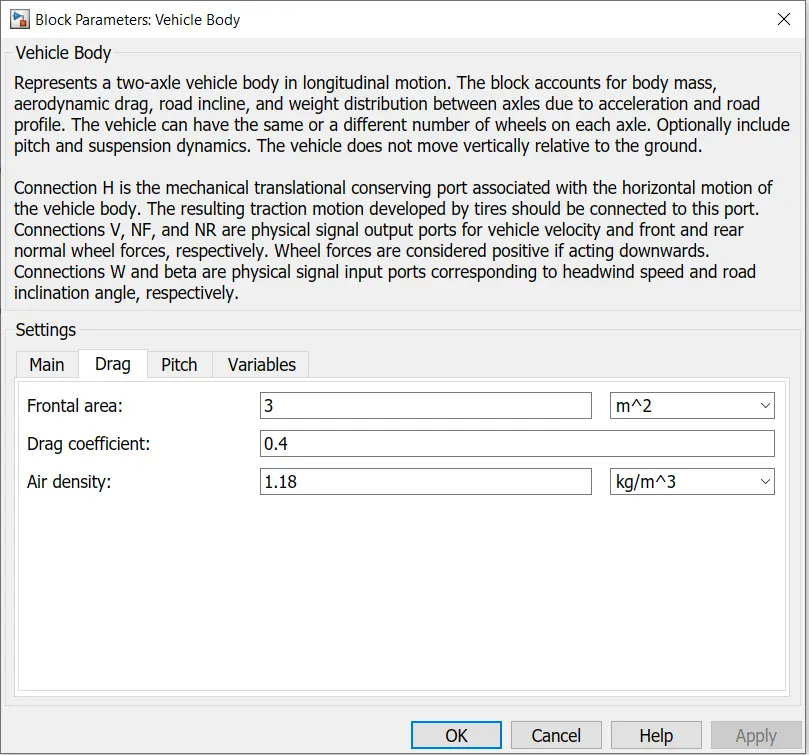
Now on clicking on the drag parameters we can change the parameters like drag coefficient,frontal area etc.
Changing the parameters there will be change in drag force whic is Fd = 0.5 * rho * A * V^2
Let us leave them to the default values.
- PS constant:-


This block creates a physical signal constant, the Constant parameter accepts both positive and negative values. The block output is a physical signal port.
State of charge(SOC):-
State of charge is defined as the measurement of available charge in the battery. When the battery is fully charged, it is considered to have 100% and when it is 0% it is said to be discharged. After the simulation is run, we get an estimate of the current and S.O.C of the battery with respect to time as there are two scopes connected one to the current sensor and other to the subsystem of S.O.C estimate. In order for the current to be measured a PS Simulink converter block is used because the current signal is physical.
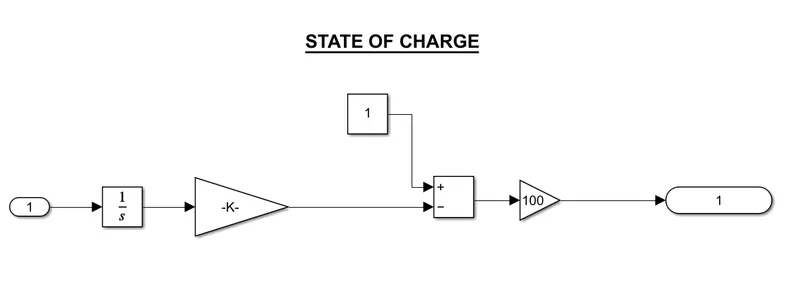
The following blocks that were used for the creation of the subsystem are:
- Integrator
- Gain
- INTEGRATOR:-

Integrator block outputs the value of integral of its input with respect to time
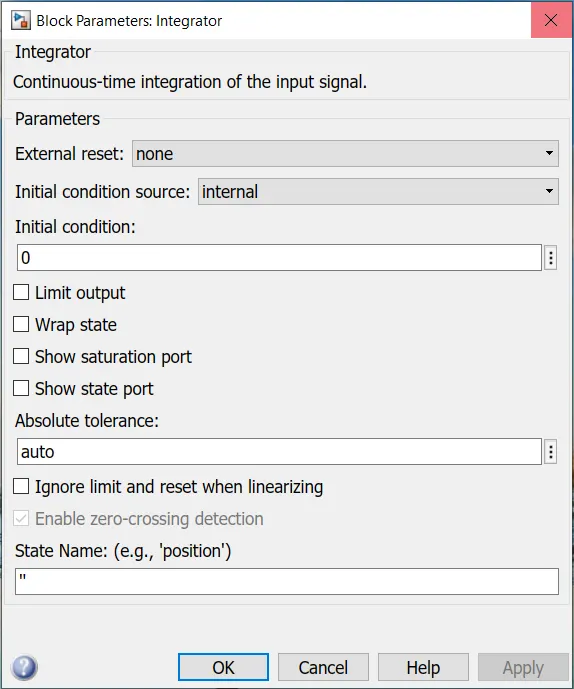
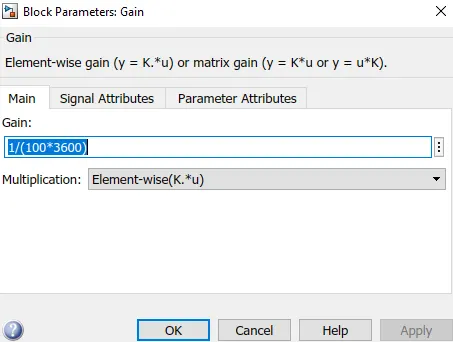
- GAIN:-

The gain block multiplies the input by a constant value (gain). Each the input and the gain can be a scalar vector. The value of gain is specified in the gain parameter.
EXPLANATION OF THE SOC SUBSYSTEM
- To measure the state of charge of the battery, a subsystem was created with various blocks such as Integrator block, gain block and sum block.
- Integrator block outputs the value of integral of its input with respect to time and then it is connected to the Gain block.
- Gain block divides the current signal with the ampere rating of the battery which is taken as 80AH multiplied by 3600 seconds in an hour.
- Constant block is used to represent the initial state of charge of the battery. when performing the simulation and assuming the battery charge is full the constant block can be altered with the value representing 100% charge.
- Sum block is used to perform addition and subtraction operations.
- The signal from the gain block will be subtracted from the constant block representing 100% charge.
- Finally, the three blocks are made into a subsystem which is the state of charge estimate and it is linked with the battery circuit using PS – Simulink converter. Two scopes are connected one at the junction of the PS Simulink converter (To plot the output signal of the current from the battery) and other at the SOC subsystem (to get an estimate of the battery charge after the simulation is run).
FTP-75 Drive cycle:-
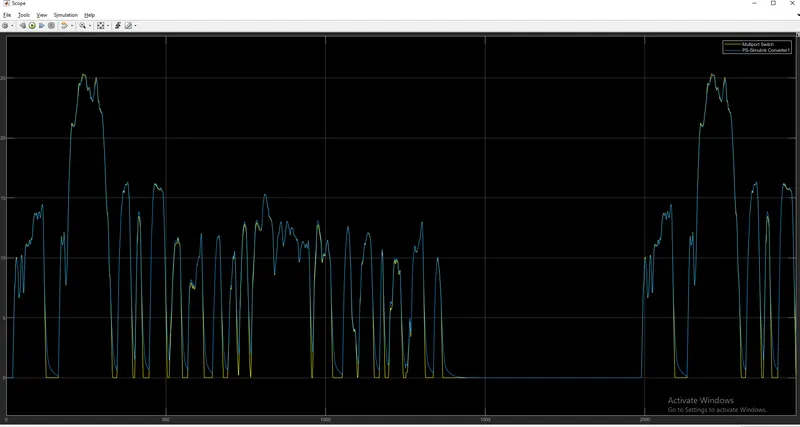
As represented on the plot given above the yellow curve shows the drive cycle data, as we know that the FTP-75 Drive cycle operates on the full throttle for some seconds and then the drive cycle is turned to 0 this in case operates the vehicle and accelerates the car at the top speed for the initial stage and throttles the car at the maximum, though the vehicle is unable to match the speed of the vehicle with the drive cycle but it is running at its peak and then comes the phase where the acceleration is left now the vehicle is operated on the free wheeling mode, the vehicle is not powered and the vehicle runs on the speed which is sustained. The important point to note here is the vehicle does not come to rest in 2474 seconds, the vehicles speed is reduced but it does not come to 0.
Result of Battery SOC:-
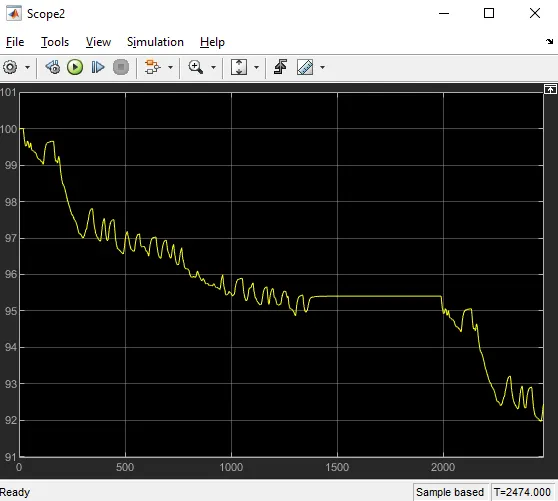
It is noted that the the Charge of the battery started from 100% at the initial level and during the operation of the vehicle for 2474 seconds using the FTP-75 Drive Cycle which has its peak throttle after the initial range the discharge occured/noted from the battery are until the high throttle was applied and it was been accelerated the battery got dishcharged at 94% and after the acceleration was been released the battery started recharging as the regenerative energy comes into action. The regenerative braking effectively charges the battery by 1% in the same duration where the vehicles acceleration pedal was been taken off and free wheeling.
Current scope:-
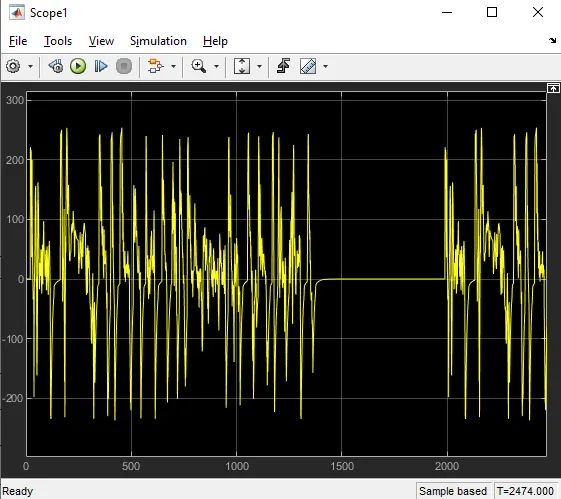
This scope shows how current flowing from the battery to the motor varies with the drive cycle.
CONCLUSION:-
The MATLAB model of an electric car which uses a battery and a DC motor has been successfully made by choosing suitable blocks from Powertrain block set and following conclusions has been drawn from the results.
- The drive cycle (FTP75) was used for the model, it was observed in the speed plot that the feedback speed plot and the reference speed plot overlap each other most of the time.There are instances where both speeds were different when the vehicle decelerates.
- From the input vs output velocity graph we can see that the EV model that we designed have traced the FTP 75 drive cycle very closely. Only when the speed suddenly drops to 0 in the FTP 75 drive cycle , the model takes time to catch up. On all other occasions the model traced the drive cycle closely.
- Now looking at the SOC graph we can see that almost 50% of the battery capacity is used for completing this drive cycle. And also we can see sudden spikes in that graph , these spikes represents the regenerative braking region. During which the SOC value increases.
- It is observed from the S.O.C plot which is the battery state of charge that when the vehicle accelerates S.O.C is decreasing but as soon as the deceleration starts the state of charge of the battery goes slightly up. This is because the vehicle undergoes regeneration.
- And from the Current variation graph , we can see that the maximum current value during normal driving is around 300A and during regenerative braking the maximum current value reached is near to 150A.