Final Project: Design of an Electric Vehicle
ELECTRIC VEHICLE MODELLING WITH MATLAB
AIM
To Model and Simulate an electric vehicle with SIMULINK.
INTRODUCTION:
Any automobile that is propelled by an electric motor, using energy stored in a battery is known as an Pure Electric Vehicle or Battery Electric Vehicle commonly known as Electric Vehicles. Battery electric vehicles store electricity onboard with high-capacity battery packs. Their battery power is used to run the electric motor and all onboard electronics. Electric Vehicles do not emit any harmful emissions and hazards. BEVs are charged by electricity from an external source using electric Vehicle (EV) chargers.
Why Electric Vehicles?
Internal combustion engines have been dominating as the propulsion source of automobiles since a long term, hence the exploitation on fossils have increased drastically, which is getting depleted. The idea of propulsion of automobiles using electric motors came to light from early 19th century itself. Hence to compensate for fossil depletion, reducing pollution levels and as an alternate and more efficient source propulsion, demand for Electric Vehicles are expected to increase drasticallly. Electric vehicles are expected to be the most dependant source of transport in near future. With technological advancements in semiconductor devices, the control of motors are also now more simpler and highly efficient operation of Electric Vehicle can be achieved.
MODELLING:
BLOCK DIAGRAM:
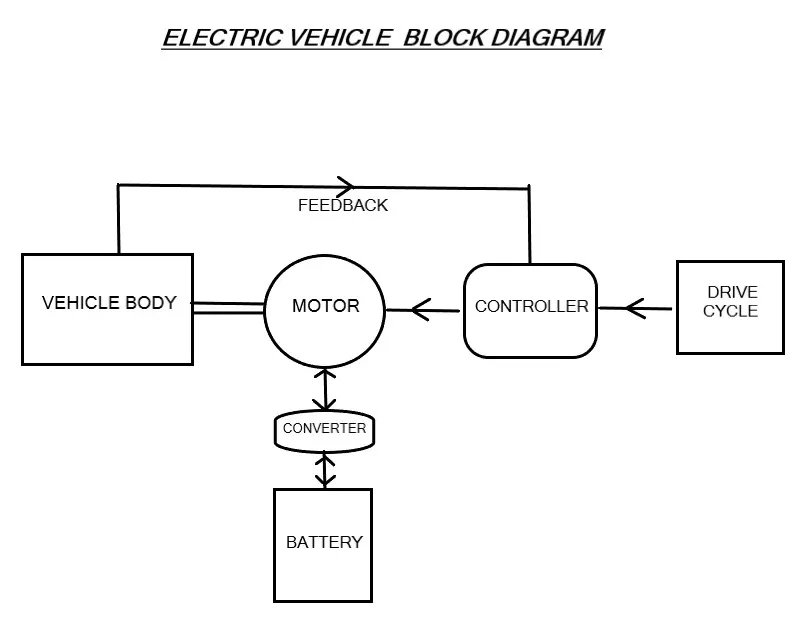
System Level Configurations:
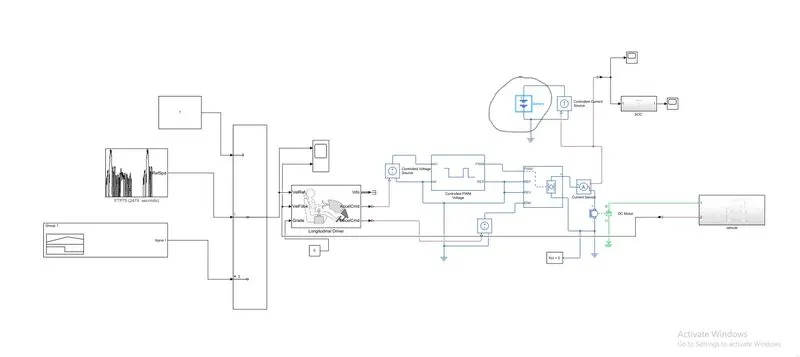
The Vehicle Model consists of mainly:
1) Vehicle Body
2) Motor and Controller
3) Battery Pack and Power Converter
4) Drive Cycle Source
Battery pack is the powerhouse of the Electric Vehicle model which supplies power to motor and other equipments necessary for the efficient operation of the Vehicle. Power converter converts energy from battery to an optimum level as required by the motor. Converter is bi-directional which helps in taking regenrative energy back to battery thereby providing charging while deceleartion of the vehicle. Vehicle body represents the body of vehicle with wheels which are connected to the motor through a transmission system. Motor takes power from the battery as per load requirements with help of controller which reviews load requirements and produces proportional control signals with help of a feedback from the vehicle so as to obtain a smooth and efficient operation of vehicle. Drive cycle source is a reference driving pattern taken for the simulation as per Drive cycle data.
Simulink Model:
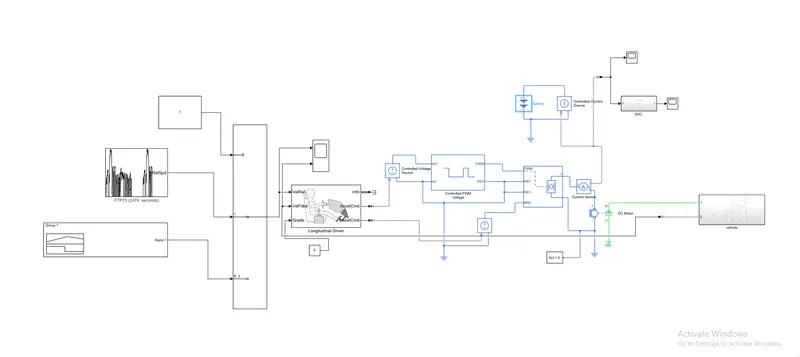
DETAILED MODEL STUDY: Configuration & Parameters
1) VEHICLE BLOCK:
Vehicle Block consists of Body of vehicle, Tires and Transmission System. Vehicle block is shown below:
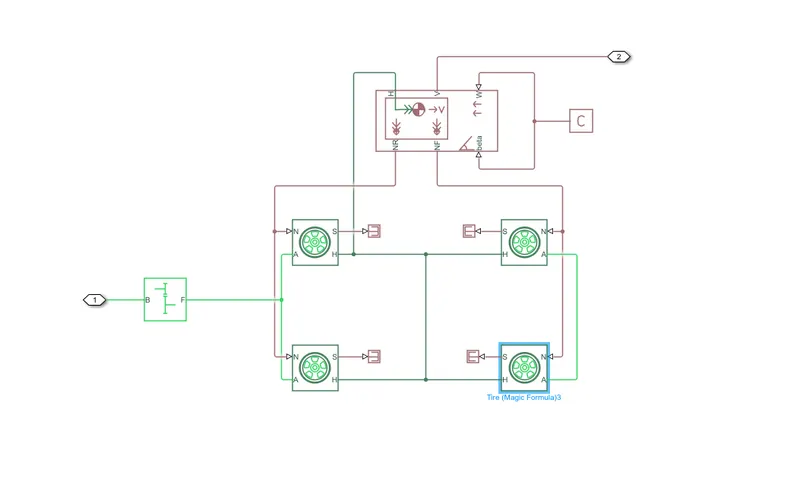
a) Vehicle Body:
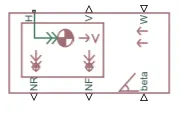
- represents a two-axle vehicle body in motion.
- accounts for body mass, aerodynamic drag, grade,externally-defined mass and center of gravity of the vehicle body.
Input Ports:
- W - Wind Velocity in m/s
- beta - Grade angle in radians
Output Ports:
- V - Velocity in m/s
- NR - Normal force on Rear Axle (N)
- NF - Normal Force on Front Axle (N)
Vehicle Body Parameters:
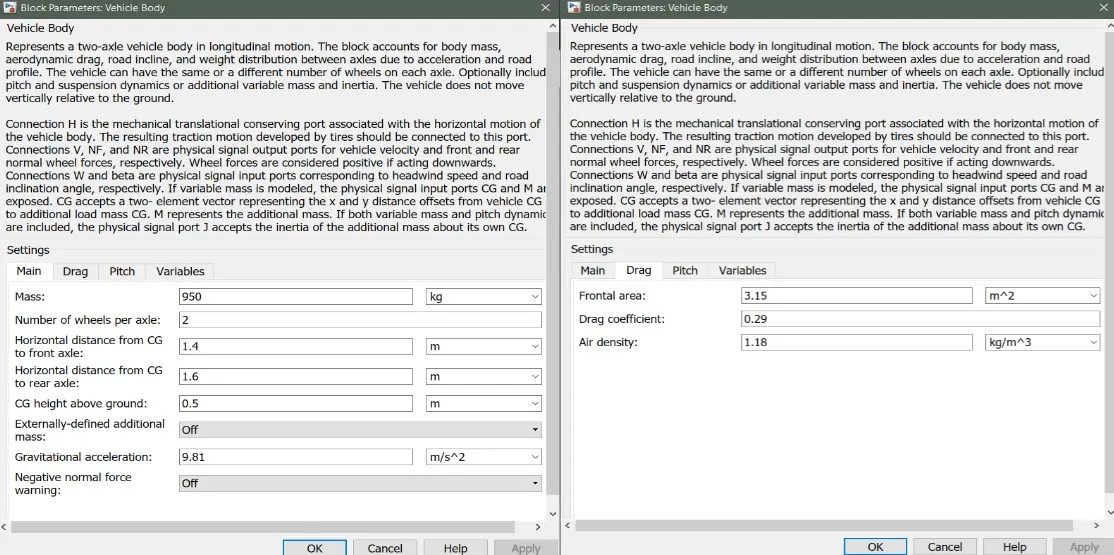
- Vehicle body mass, Centre of gravity distance values and aerodynamic drag variables are modified.
- Pitch dynamics are kept ON with other variable values as default values.
b) Tires

- used to model a tire with longitudinal behavior given by equation based on four fitting coefficients.
- The block can model tire dynamics under constant or variable contact surface conditions.
Input Port:
- N - Normal force acting on tire, positive when force is acting downwards/towards the contact surface,
Output Port:
- S - Slip value relative to tire and surface of contact.
Conserving Ports:
- H - represents wheel hub which transmits thrust generated by the wheel to the body of the vehicle.
- A - represents axle on which the tires are mounted.
Tire Parameters:
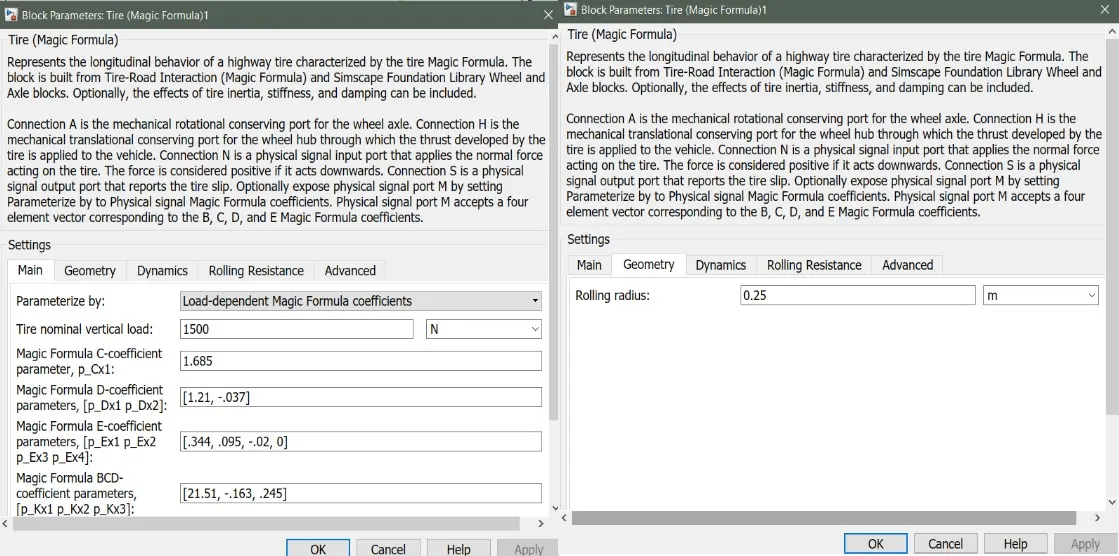
- Nominal load and radius of tires are modified.
- Rolling resistance is kept at default values and dynamics depends on default damping and stiffness values of the tire.
c) Gear

- A simple gear block is used to connect the motor to the rear axle of the vehicle.
- It represents the gearbox which connects the input shaft to the base gear and ouput from the foller gear.
Conserving Ports:
- B - port associated with input shaft (motor shaft)
- F - port associated with ouput shaft (axle / differential)
Simple Gear Parameters:
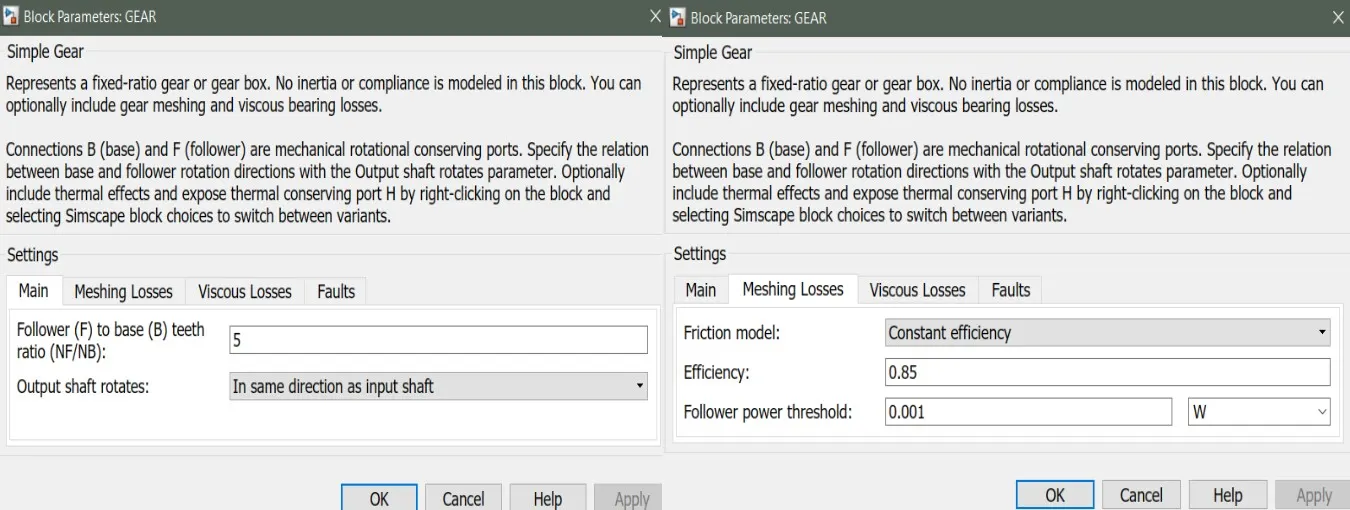
- Gear ratio and output direction is modified.
- Meshing loss is kept constant and gear is having a constant efficiency throughout the simulation.
- Viscous losses and faluts are kept at default conditions.
2) MOTOR & POWER CONVERTER:
The motor & its control block is as shown below:
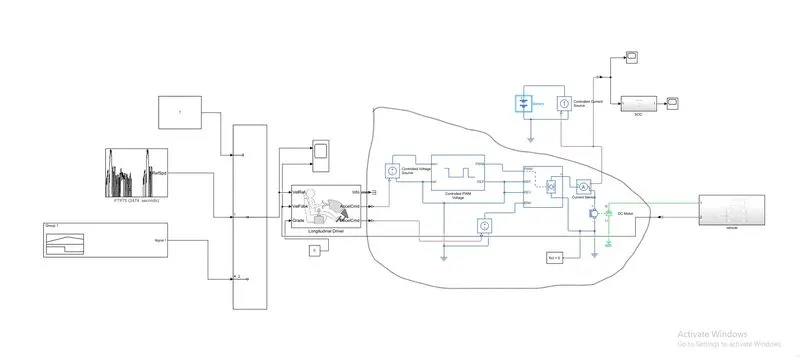
The components and parameters of the motor and power control block is as follows:
a) DC Motor:
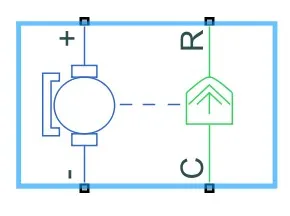
Ports:
- + - Ports receiving electrical signal associated with Motor positive terminal
- - - Port receiving electrical signal associated with Motor Negative terminal.
- C - Mechamical conserving port associated with casing of the motor and is connected to a mechanical rotational reference block
- R - Mechanical conserving port associated with Rotor shaft of the motor which produces required input to the transmission system.
Motor Parameters:
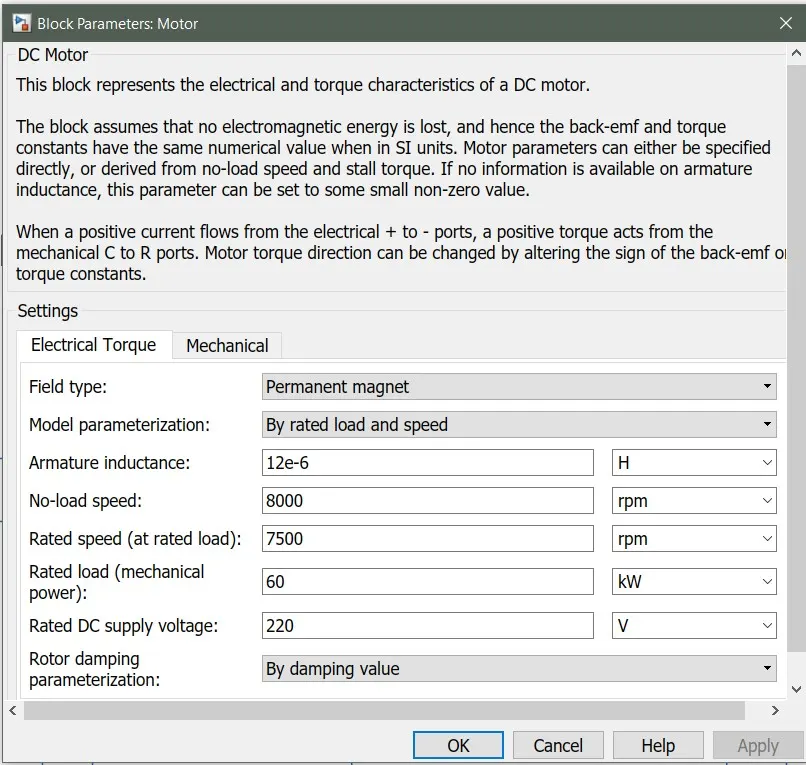
- Model parameterization is set to Rated load and speed condition.
- Rated voltage, speed and load values alongwith No-load speed is modified.
- Mechanical variables are kept as default vlaues only.
b) H-Bridge:
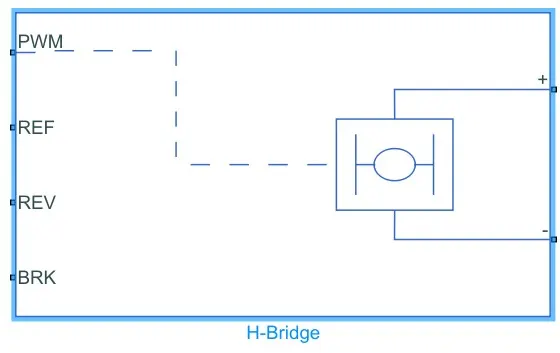
- H-Bridge block is used to represent H-bridge motor driver which controls the power innput to the motor accoeding to the load requirements.
- Output provided by the block is controlled voltage depending on the control signal
Ports:
- + - Conserving port associated with positive load connection usually connected to positive port of the motor.
- - - Conserving port associated with negative load connection usually connected to the negative terminal of the motor.
- PWM - Conserving port associated with PWM control signal (voltage pulses)
- REF - Conserving port associated with a ZERO voltage reference.
- REV - Conserving port associated with voltage controlling polarity change of Bridge outut signal.
- BRK - Conserving port associated with voltage when brakes are applied, thereby aiding the process of regenerative braking.
H-Bridge Parameters:
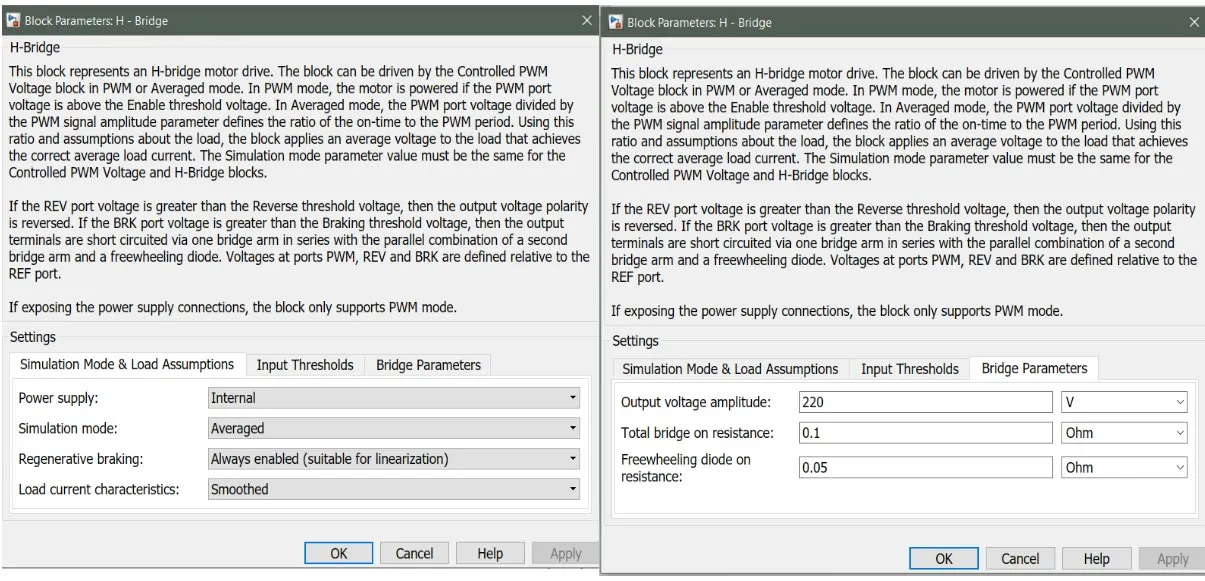
- H-Bridge is selected to have its own power source as internal.
- Averaged simulation is selected for faster simulation and Regenerative braking is enabled.
- Output voltage amplitude is set as equal to rated voltage of the motor. Rest values are left as default values only.
The acceleration(PWM) and deceleration(BRK) command signal from the driver is controlled by a Controlled Voltage Source before it is fed to the H-Bridge. Default parameters are maintained for the Controlled Voltage Source.
c) Controlled PWM voltage

- produces Pulse-Width modulated signals to control voltage fed to H-Bridge as per requirements.
Conserving Ports:
- ref+ - positive reference voltage signal port
- ref- - negative reference voltage signal port
- PWM - Pulse-Width mmodulated electrical signal
- REF - Port associated with ZERO voltage reference
Controlled PWM voltage Source Parameters:
- The simulation mode is set to PWM and output voltage amplitude is set similar to the input signal amplitude of the H-Bridge
d) Solver COnfiguration

- A solver configuration block specifies solver parameters necessary for simulation and is connected to the physical network of motor controller.
3) BATTERY
Components of battery block is depicted below:
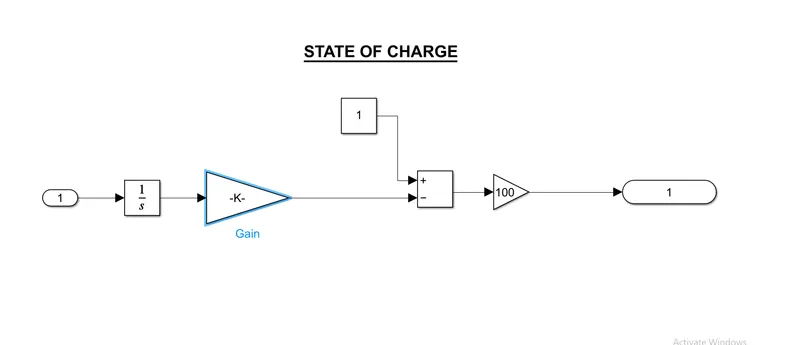
- represents the powerhouse of the model which supplies the power required by the motor as controlled by the controllers.
- SoC calculation of battery is done to trace the battery reliability and range of the vehicle model. Soc is calculated by reducing the usage from the nominal SoC value on a timely basis.
Battery Parameters:
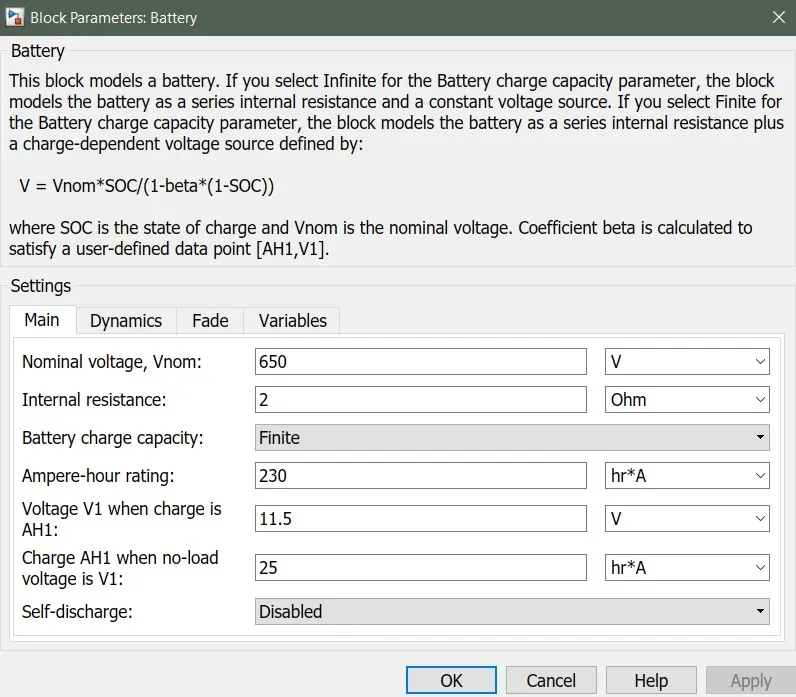
- Nominal voltage, Ampere-hour rating values are modified keeping dynamics OFF and other variables as default values.
- Rate transition and time integration is used inorder to calculate real-time SoC values.
4) LONGITUDINAL DRIVER
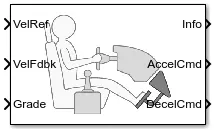
- Represents a longitudinal speed controller which produces acceleration and deceleration commads based on input and feedback speed variables provided using a Proportional integral (PI) control.
Input Ports:
- VelRef - input port associated with input reference velocity of the vehicle (m/s)
- VelFdbk - input port associated with velocity feedback from the vehicle which helps in smooth control of the system.
- Grade - input port associated with inclination of surface in degrees.
Ouput Ports.
- Info - ouput port associated with a bus signal for acceleartion, deceleration, error in velocity etc
- AccelCmd - Output port associated with acceleration commands with reference to input signal.
- DecelCmd - Output port associated with deceleration commads with reference to the input drive signal.
Driver Parameters:
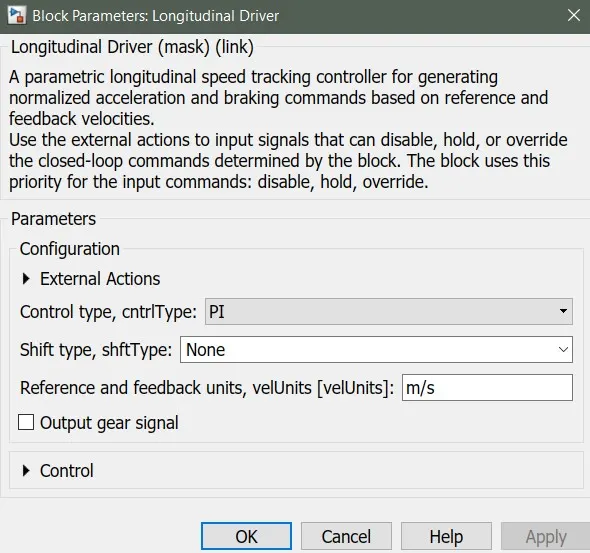
- Proportional-Integral Control Type is selected and the other control variables are kept as default values.
5) DRIVE CYCLE SOURCE
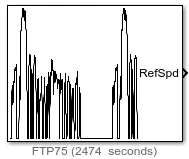
- Represents block which generates a drive cycle for a particular time. It is basically time vs speed data which resembles similar to that of a real-time driving conditions with acceleration and deceleration in an irregular patern.
- By default, FTP75 drive cycle is selected. Wide-Open-Throttle condition can also be selected. Drive cycle data can also be taken from spreadsheet data or through a glider block or a signal bulider block.
- Simulation default time for FTP75 is 2474 seconds.
SIMULATION RESULT:
Simulation is performed to valuate performance of the Designed Model through monitoring Speed Comparison of reference and Feedback signal alongwith State-of-Charge of the bettery.
1) FTP75 Drive Cycle.
Speed Comparison:
The speed (m/s) from the drive cycle and speed feedback from the vehicle body is plotted inorder to understand the response of model according to the drive cycle data. Simulation provided the following result in Speed COmparison:
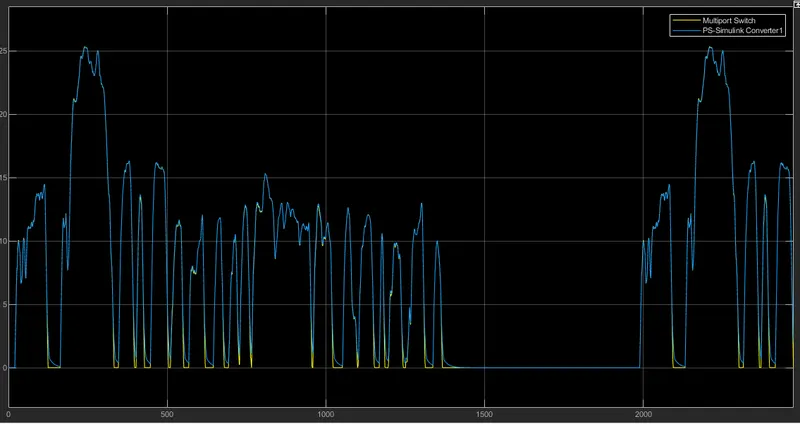
FTP75 Drive cycle is used to perform the simulation with simulation time of 1875Seconds. Speed comparison curve shows that the actual velocity(blue curve) of the vehicle almost follows the Reference curve (yellow curve) throughout the simulaton. During peak decelerations , Speed comparison curve shows a difference in velocity which is encountered due to inertial effects of the vehicle and instantaneous velocity drops in reference curve.
In reference to distance covered, the distance covered by a vehicle following FTP75 drive cycle in 1874 seconds is around 17km.
| Distance | 11.04 miles (17.77 km) |
| Duration | 1874 s |
| Average speed | 21.2 mph (34.1 km/h) |
This variation is due to instantaneous velocity variation in Drive cycle data which is not exactly followed by the vehicle in actual scenario. Further refinements in parameterisation will help the drive system to perform in a trend which will inturn make the vehicle to follow the drive cycle pattern with very minor variations in velocity which will make the vehicle cover further more distance.
State-of-Charge of Battery:
The FTP75 drive cycle is having several Acceleration and deceleration profiles that varies randomly which depicts a real life driving scenario which helps to track the nature of battery discharge while different acceleration profiles and regenerative charging effects on deceleration profiles. The SoC scope block helps in keeping track of the remaining battery capacity.
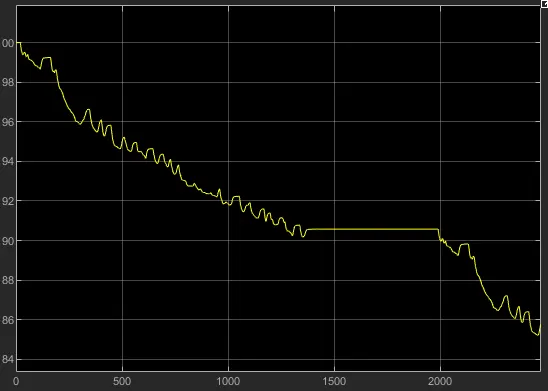
Starting from 100%, after travelling a distance of 13.6km in about 30mins, the State-of-Charge of the battery reaches around 70%.
CONCLUSION:
- A basic Electric Vehicle model was created with SIMULINK and simulation was performed using FTP75 drive cycle .Simulation time for FTP75 was modified to 1874 seconds . The speed comparison curve exhibits a fair response level of the model trying to deliver required performance levels to meet the acceleration and deceleration commands which can be identified from the minor variation in Actual drive cycle curve and velocity feedback curve.
- The Depth of discharge under FTP75 drive cycle from simulation is about 30% to travel a distance of 13km in around 30 minutes.
- A detailed and in-depth parameterization of the motor control and vehicle block variables would make the model to exactly follow the reference velocity signal which would inturn enhance the performance of the system. Modification in battery block variables also might be helpful in reducing the Depth-Of-Discharge percentage which inturn provides higher mileage for the Vehicle in a single charge-discharge cycle.