Final Project: Design of an Electric Vehicle
AIM - 1. To Create a MATLAB model of electric car which uses a battery and a DC motor.
2. To prepare a report about our model including following -
Objectives:
1. System level configurations
2. Model parameters
3. Results
4. Conclusion
THEORY -
Electric Vehicle -
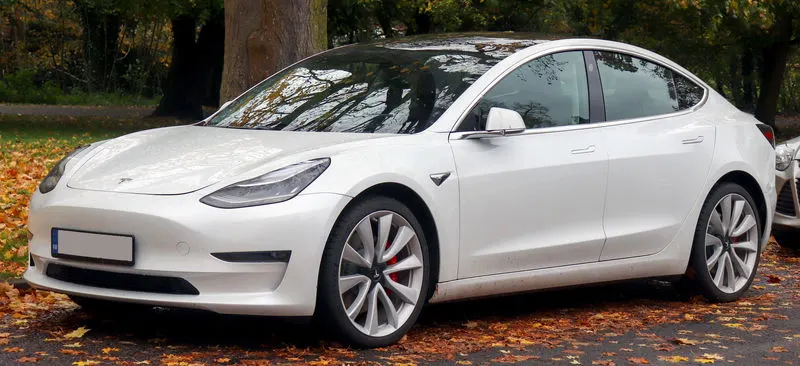
An electric vehicle (EV) is a vehicle that uses one or more electric motors or traction motors for propulsion. An electric vehicle may be powered through a collector system by electricity from off-vehicle sources, or may be self-contained with a battery, solar panels, fuel cells or an electric generator to convert fuel to electricity. EVs include, but are not limited to, road and rail vehicles, surface and underwater vessels, electric aircraft and electric spacecraft.
EVs first came into existence in the mid-19th century, when electricity was among the preferred methods for motor vehicle propulsion, providing a level of comfort and ease of operation that could not be achieved by the gasoline cars of the time. Modern internal combustion engines have been the dominant propulsion method for motor vehicles for almost 100 years, but electric power has remained commonplace in other vehicle types, such as trains and smaller vehicles of all types.
Commonly, the term EV is used to refer to an electric car. In the 21st century, EVs have seen a resurgence due to technological developments, and an increased focus on renewable energy and the potential reduction of transportation's impact on climate change and other environmental issues. Project Drawdown describes electric vehicles as one of the 100 best contemporary solutions for addressing climate change.
Government incentives to increase adoption were first introduced in the late 2000s, including in the United States and the European Union, leading to a growing market for the vehicles in the 2010s. Increasing public interest and awareness and structural incentives, such as those being built into the green recovery from the COVID-19 pandemic, is expected to greatly increase the electric vehicle market. Electric vehicle sales may increase from 2% of global share in 2016 to 30% by 2030. Much of this market growth is expected in markets like North America, Europe and China; a 2020 literature review suggested that growth in use of electric vehicles, especially electric personal vehicles, currently appears economically unlikely in developing economies.
MATLAB Model Of Electric Car -
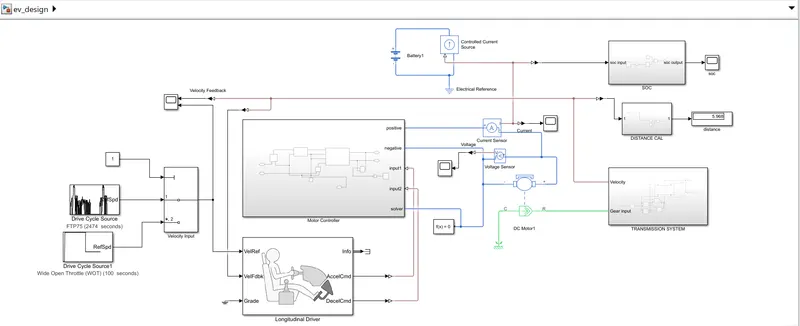
Blocks Used -
- Transmission System Block
- DC Motor Block
- Motor Controller Block
- Longitudinal Driver Block
- Drie Cycle Block
OBJECTIVE -
1.System Level Configurations
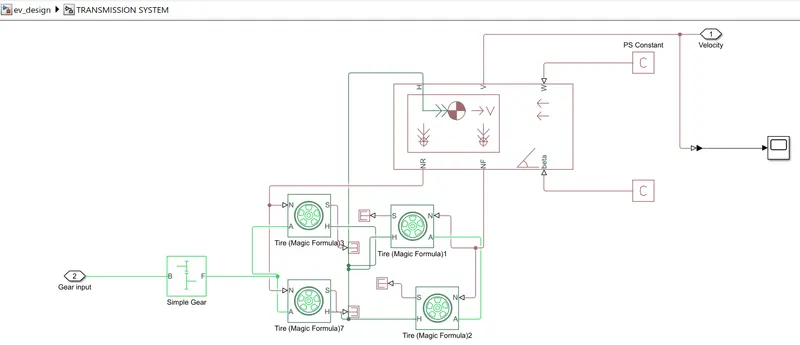
- Transmission System Subsystem -
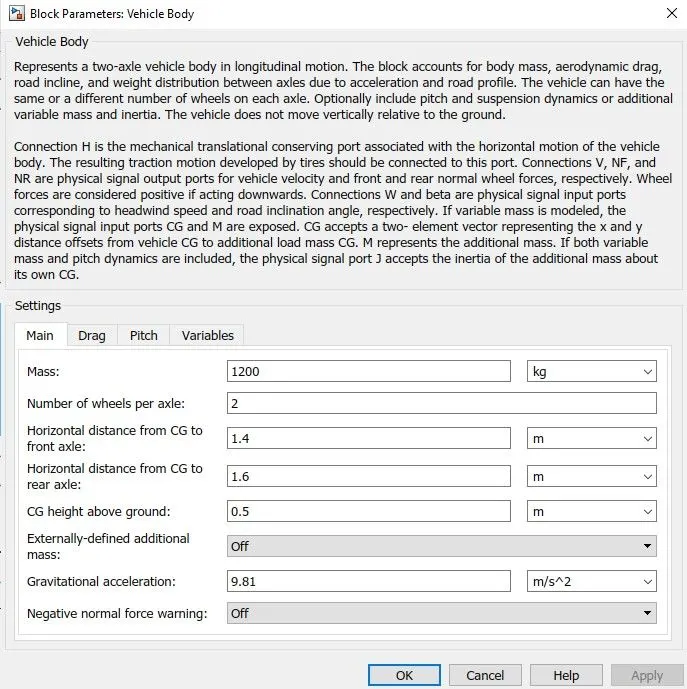
- Vehicle Body -
The Vehicle Body block represents a two-axle vehicle body in longitudinal motion. The vehicle can have the same or a different number of wheels on each axle. For example, two wheels on the front axle and one wheel on the rear axle. The vehicle wheels are assumed identical in size. The vehicle can also have a center of gravity (CG) that is at or below the plane of travel.
The block accounts for body mass, aerodynamic drag, road incline, and weight distribution between axles due to acceleration and road profile. Optionally include pitch and suspension dynamics. The vehicle does not move vertically relative to the ground.
The block has an option to include an externally-defined mass and an externally-defined inertia. The mass, inertia, and center of gravity of the vehicle body can vary over the course of simulation in response to system changes.
Block Parameter Of Vehicle Body -
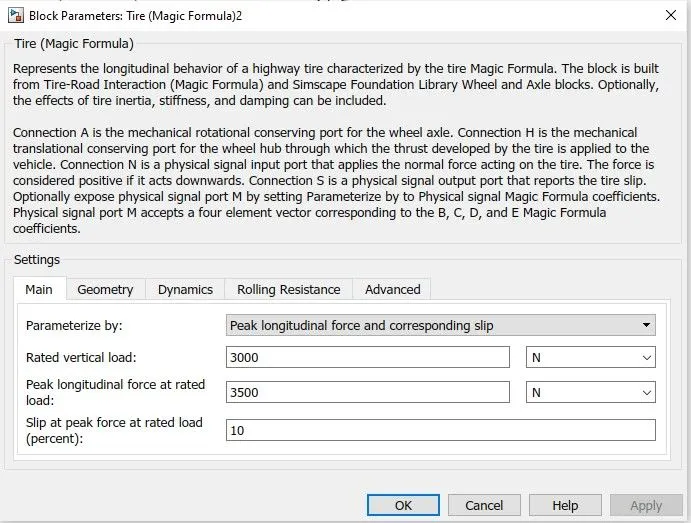
2. Tire -
Block Parameter -
3. Simple Gear -
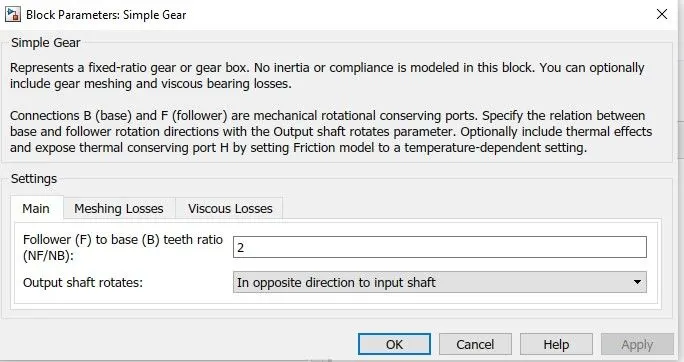
The Simple Gear block represents a gearbox that constrains the connected driveline axes of the base gear, B, and the follower gear, F, to corotate with a fixed ratio that you specify. You choose whether the follower axis rotates in the same or opposite direction as the base axis. If they rotate in the same direction, the angular velocity of the follower, ωF, and the angular velocity of the base, ωB, have the same sign. If they rotate in opposite directions, ωF and ωB have opposite signs.
Block Parameter -
- DC Motor Block -
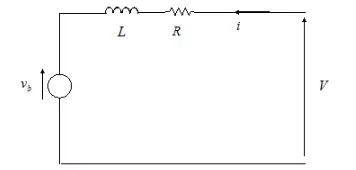
The DC Motor block represents the electrical and torque characteristics of a DC motor using the following equivalent circuit model:
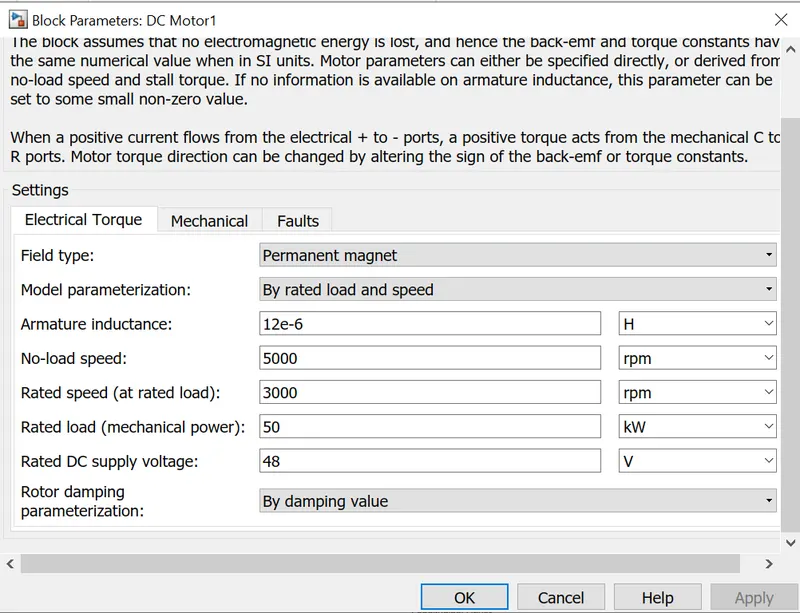
DC Motor Block Parameter -
- Motor Controller Subsystem -
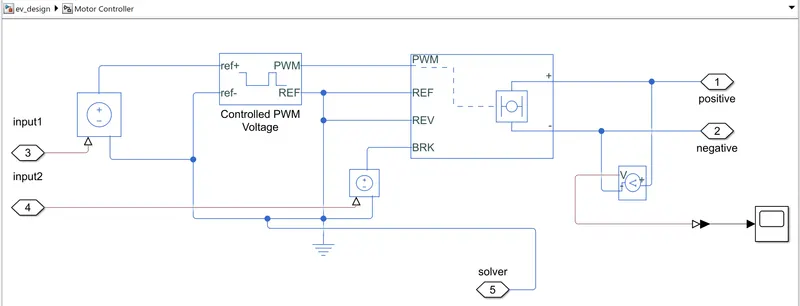
- H - Bridge Block -
The H-Bridge block represents an H-bridge motor driver. The block has the following two Simulation mode options:
-
PWM— The H-Bridge block output is a controlled voltage that depends on the input signal at the PWM port. If the input signal has a value greater than the Enable threshold voltage parameter value, the H-Bridge block output is on and has a value equal to the value of the Output voltage amplitude parameter. If it has a value less than the Enable threshold voltage parameter value, the block maintains the load circuit using one of the following three Freewheeling mode options:-
Via one semiconductor switch and one freewheeling diode -
Via two freewheeling diodes -
Via two semiconductor switches and one freewheeling diode
The first and third options are sometimes referred to as synchronous operation.
The signal at the REV port determines the polarity of the output. If the value of the signal at the REV port is less than the value of the Reverse threshold voltage parameter, the output has positive polarity; otherwise, it has negative polarity.
-
Averaged — This mode has two Load current characteristics options:
-
Smoothed -
Unsmoothed or discontinuous
The Smoothed option assumes that the current is practically continuous due to load inductance. In this case, the H-Bridge block output is:
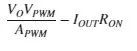
where:
-
VO is the value of the Output voltage amplitude parameter.
-
VPWM is the value of the voltage at the PWM port.
-
APWM is the value of the PWM signal amplitude parameter.
-
IOUT is the value of the output current.
-
RON is the Bridge on resistance parameter.
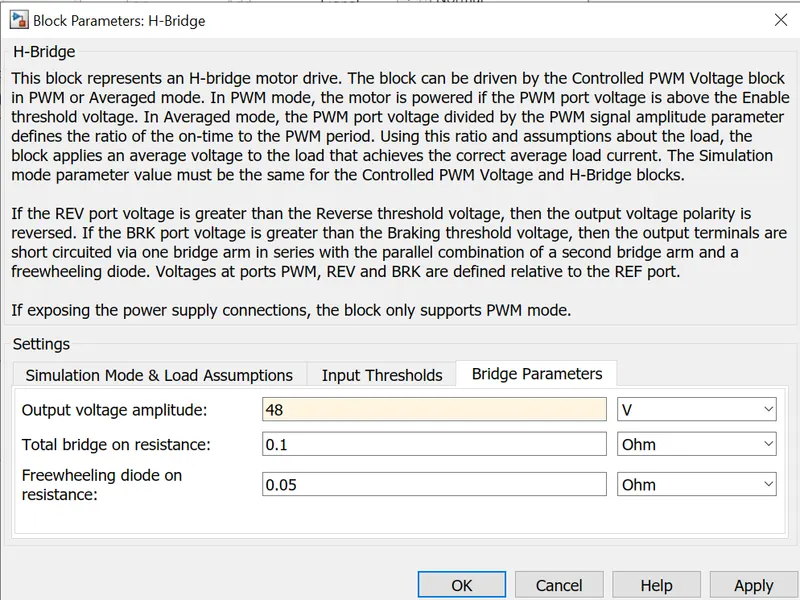
H - Bridge Block Parameter -
- Controlled PWM Voltage -
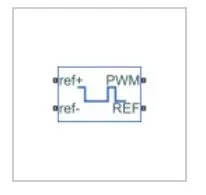
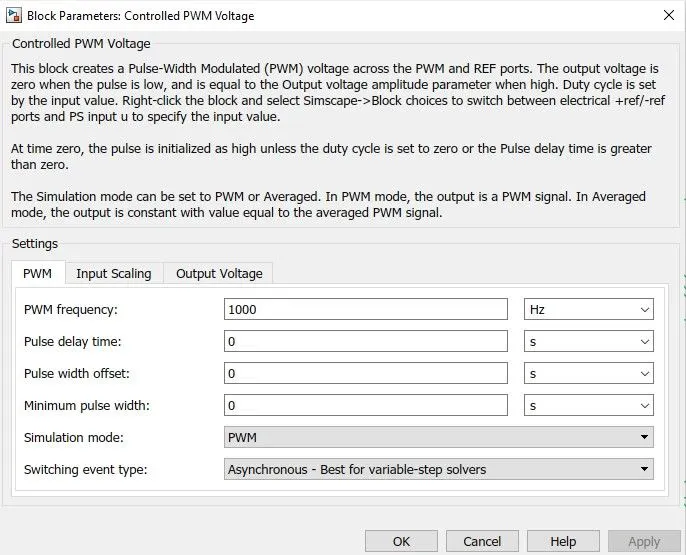
The Controlled PWM Voltage block represents a pulse-width modulated (PWM) voltage source.
Block Parameter -
- Battery -
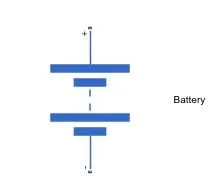
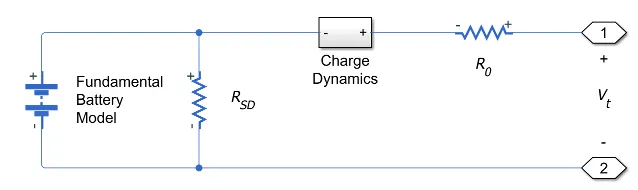
The Battery block represents a simple battery model.
The battery equivalent circuit is made up of the fundamental battery model, the self-discharge resistance RSD, the charge dynamics model, and the series resistance R0.
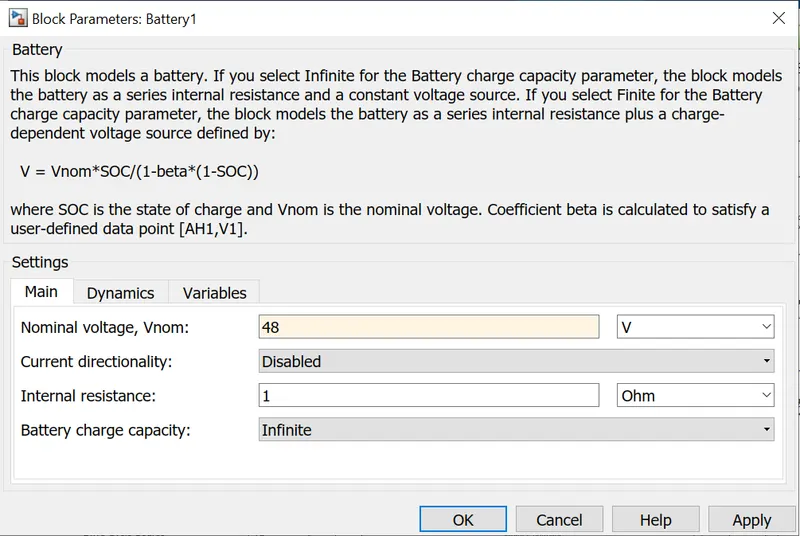
Battery Block Parameter -
- SOC Subsystem -
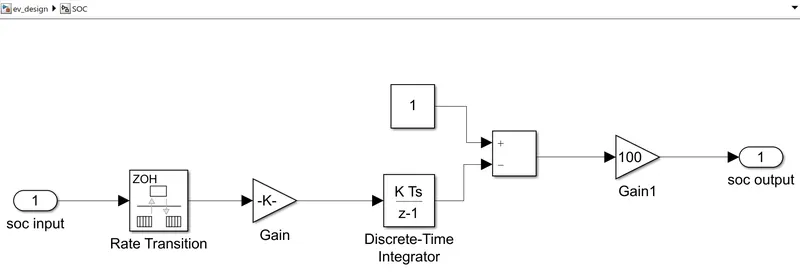
Block Used -
1. Rate Transition -
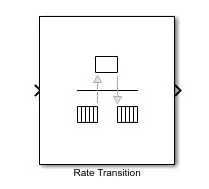
The Rate Transition block transfers data from the output of a block operating at one rate to the input of a block operating at a different rate. Use the block parameters to trade data integrity and deterministic transfer for faster response or lower memory requirements.
2. Discrete Time Integrator Block -
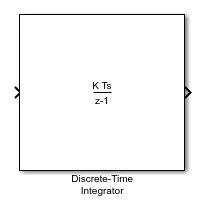
Use the Discrete-Time Integrator block in place of the Integrator block to create a purely discrete model. With the Discrete-Time Integrator block, we can:
-
Define initial conditions on the block dialog box or as input to the block
-
Define an input gain (K) value
-
Output the block state
-
Define upper and lower limits on the integral
-
Reset the state with an additional reset input
3.Gain Block -
The Gain block multiplies the input by a constant value (gain). The input and the gain can each be a scalar, vector, or matrix.
We specify the value of gain in the Gain parameter. The Multiplication parameter lets you specify element-wise or matrix multiplication. For matrix multiplication, this parameter also lets us indicate the order of the multiplicands.
Gain is converted from doubles to the data type specified in the block mask offline using round-to-nearest and saturation. The input and gain are then multiplied, and the result is converted to the output data type using the specified rounding and overflow modes.
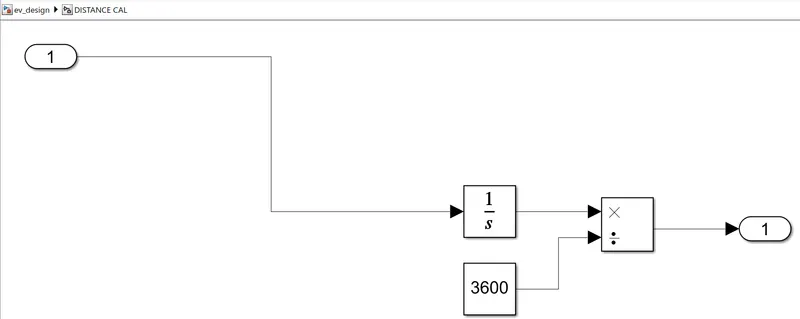
- Distance Subsystem -
RESULTS -
1. Velocity Feedback Output -
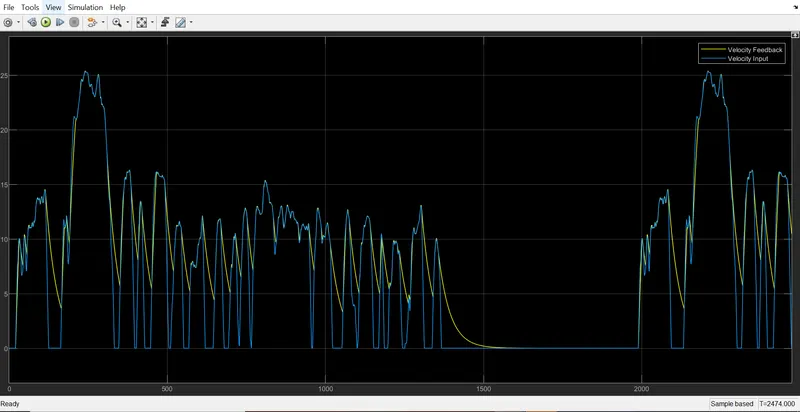
From the above figure it is concluded that Velocity Input Plot (use FTP75 Drive Cycle) and Velocity Feedback plot are almost overlap each other most of the time , but when vehicle speed reduces or vehicle decelerates there will be slightly variation in the graph.
2. SOC Output -
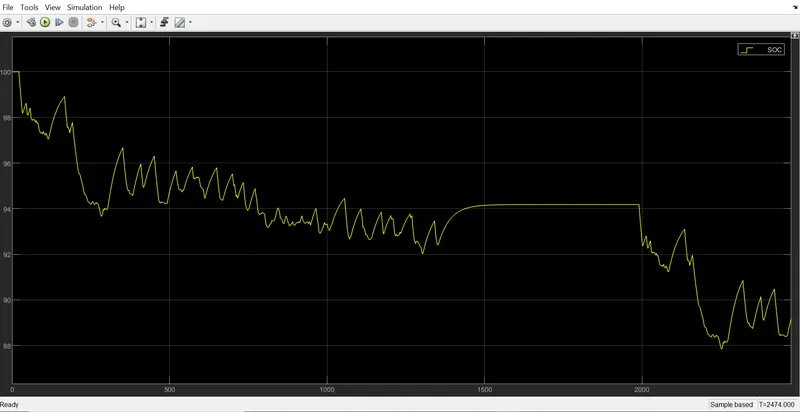
From the above figure it is concluded that the battery will discharge when vehicle accelerate , there are certain instances when Battery of vehicle get charged due to regenerative braking .
3. Current Output -
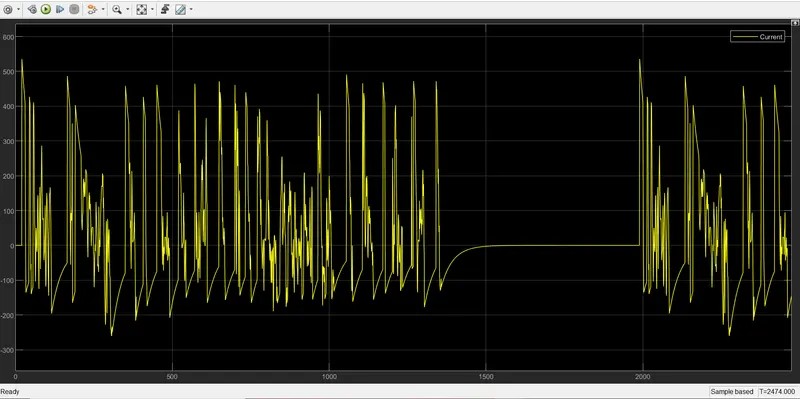
Above Figure shows the flow of current from battery to motor .Current varies with the time .
4.Distance Calculation
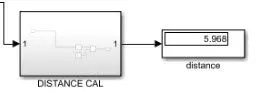
Total distance travelled by the Vehicle is 5.96 Km .
CONCLUSION -
- Velocity Input Plot (use FTP75 Drive Cycle) and Velocity Feedback plot are almost overlap each other most of the time , but when vehicle speed reduces or vehicle decelerates there will be slightly variation in the graph.
- The battery will discharge when vehicle accelerate , there are certain instances when Battery of vehicle get charged due to regenerative braking .
- Total distance travelled by the Vehicle is 5.96 Km .