FINAL INDEPENDENT PROJECT
Amplitude Modulation Waveform
Aim : To plot out the modulation waveform in matlab.
Objective : To perform the calculation and expireriments in a graphical and more understandable format in various formats which make us to be user friendly to the systems we use in day by such as this one a waveform of the pusalting is hard to uderstand but once it is graphically plotted it becomes easire to understand.
Methodology: Open matlab and at the window by clear all commands, give the inputs formuate the equation , give the time frame and frame selection and the graph will be plotted..
clear all
close all
clc
%amplitude modulation
am=10;     %amp of modulating signals
ac=5;      %carrier magnitude
m=1;       %modulation of index
f=10;      %frequency
fc=10*f;   %carieer frequency
F=2000;    %samples
T=1/F;     %time
t=0:T:1;    %time range of graph
subplot(311);  %all plots in one window
xm=am*sin(2*pi*f*t);
plot(t,xm);
title('Message signal');
%carrier signal
xc=ac*sin(2*pi*fc*t);
subplot(312);
plot (t,xc);
title('Carrier signal');
y=ac+am*(1+m*sin(2*pi*pi*f*t)).*sin(2*pi*fc*t); %formula for amplitude
subplot(313);
plot(t,y);
title('Amplitude wave');
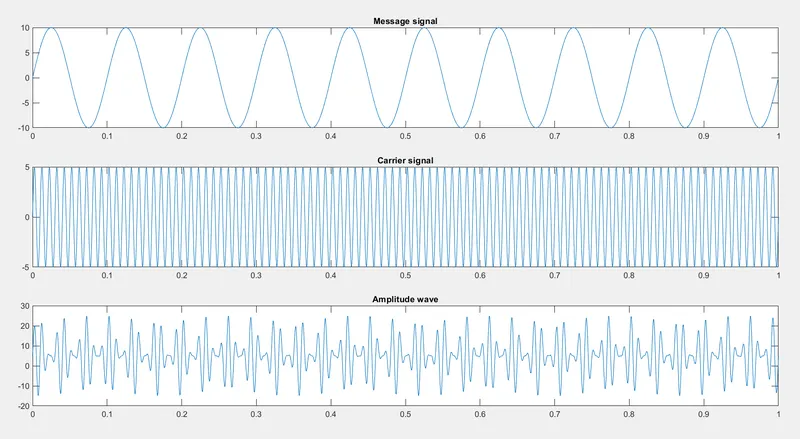
Amplitude modulation (AM) is a modulation technique used in electronic communication, most commonly for transmitting messages with a radio wave. In amplitude modulation, the amplitude (signal strength) of the wave is varied in proportion to that of the message signal, such as an audio signal.
1)message wave
2) Carrier wave
3) Amplitude Wave
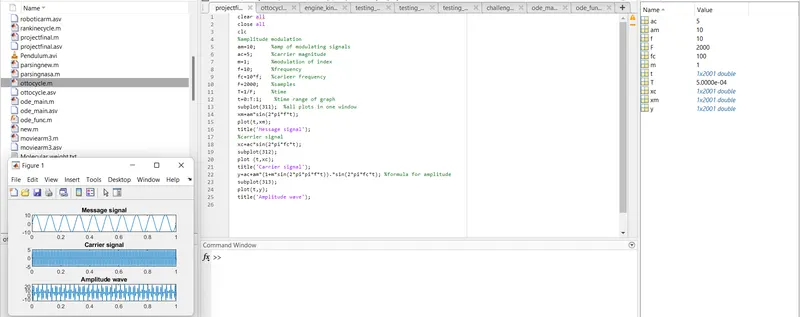
This is the window to show the program and the workspace editor and command window.
hence we conclude that the modulation waveform in matlab