Conjugate Heat Transfer Analysis on a graphics card.
Aim:
To perform a steady-state conjugate heat transfer analysis on a model of a graphic card.
Pre-processing:
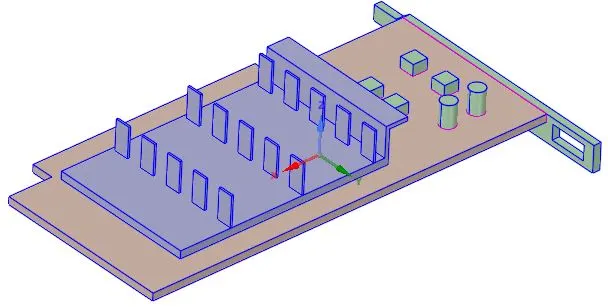
The model of this graphic card consists of 3 main components, namely, base, processor, and the fins, each made up of the material steel, silicon, and copper respectively. The physical properties of each material are given in the table below.
| Steel | Copper (Cu) | Silicon (Si) | |
|
Density (Kg/m^3) |
8030 | 8978 | 2330 |
| Specific heat at constant pressure (Cp) (J/Kg-K) | 502.48 | 381 | 710 |
| Thermal conductivity (W/m-K) | 16.27 | 387.6 | 150 |
The processor is sandwiched in between the base and the fins as shown above. The processor produces heat with its usage. The base is used to support the overall assembly. The fins conduct the heat produced by the processor and thereby cooling the processor. The fins are cooled by the application of air, the air at room temperature (25 C) passes over the graphic card assembly and the heat is carried away by it through convection. The fins provide extra surface area so as to increase the convection process.
Let the thermal design power (TDP) of the processor be 10W. Then the heat generated by the processor is given by:
`W=(TDP)/(V_p)=10/(64e-9)=1.5625e8 W/m^3`
Where Vp is the volume of the processor(m^3)
Solution:
To perform the conjugate heat transfer analysis, the simulation was first run using the baseline mesh. This is done to check whether the conditions set initially are correct or not. Even if the conditions are wrong, the simulations can be rerun since running the simulations on the baseline mesh takes lesser time.
Baseline mesh:
The baseline mesh is generated, the mesh element size for baseline mesh was taken as 1.028e-2m. There was a total of 15743 nodes and 83616 elements. The share topology feature was enabled in the SpaceClaim so that the generated mesh is conformal.
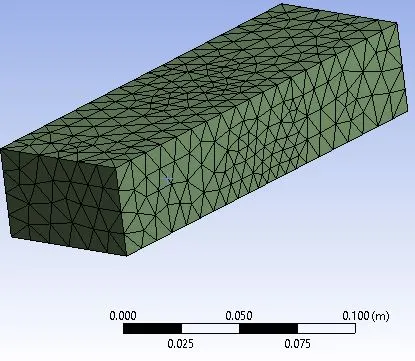
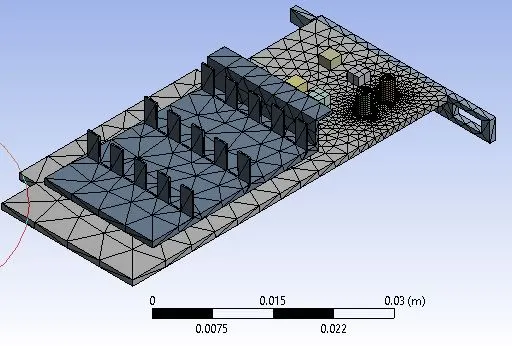
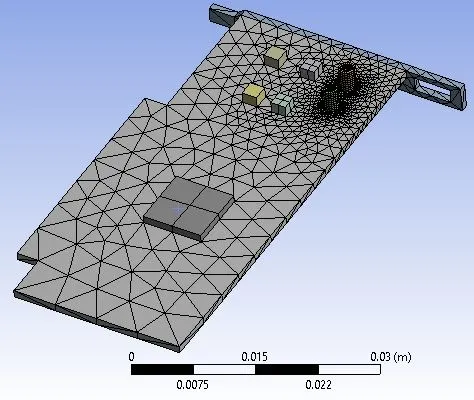
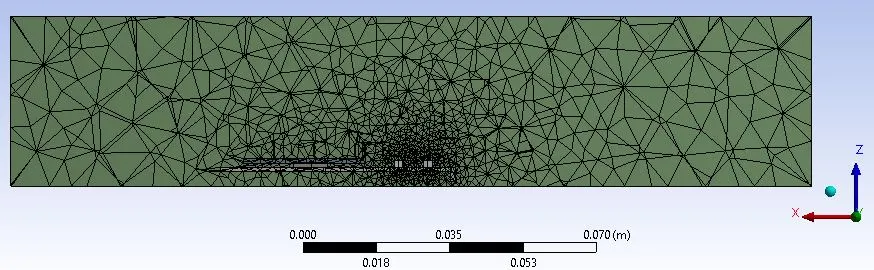
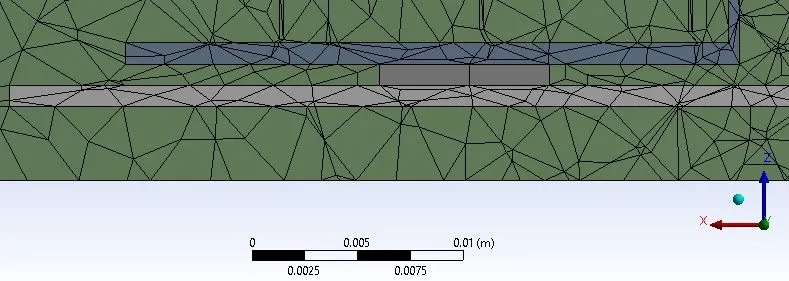
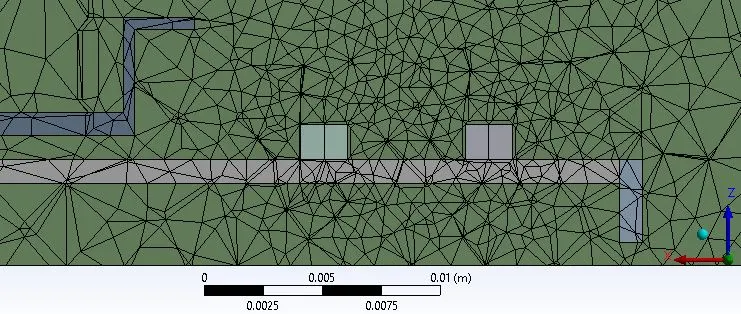
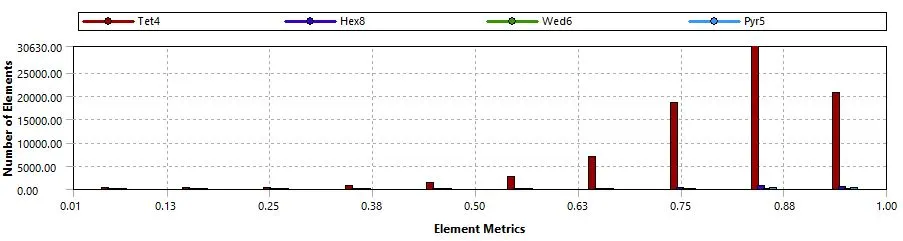
The mesh quality is checked, and since a majority of the mesh elements have mesh quality greater than 50%, the mesh is said to be suitable to perform CHT analysis.
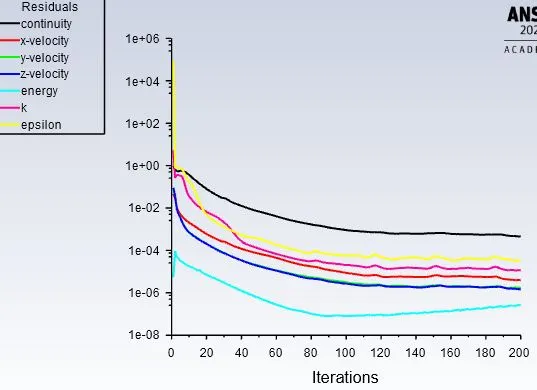
The graphic card geometry is divided into 3 components so that different materials may be assigned to it. The K-epsilon realizable turbulence model used to solve this problem since the solution converges faster. The velocity at the inlet (the free-stream velocity) is 1m/s and the temperature 25 C. The heat generation term is added to the processor in the cell conditions tab. The solution was run for 200 iterations and from the trend of the plot, we can say that the solution got converges after performing around 100 iterations.
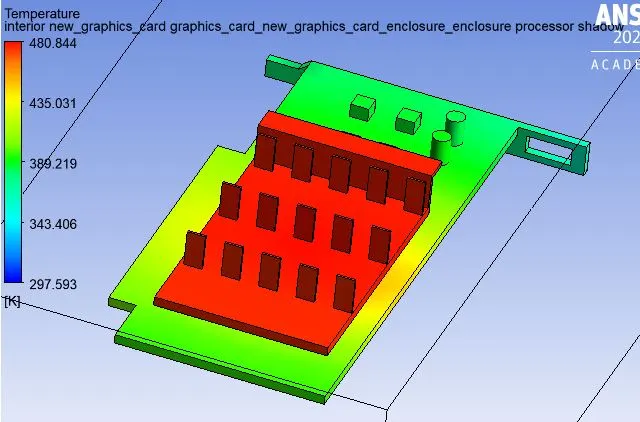
The highest temperature attained by the graphic card for this condition is 480.844K. From the temperature contour shown above, we can see that the temperature of the fins is comparatively higher than that to the base. This is simply because the copper material used for the fins has a greater thermal conductivity than that of steel which is used for the base. This is desirable since the main application of the fins is to dissipate the heat, and if the temperature of the fins is high, the more heat can be dissipated.
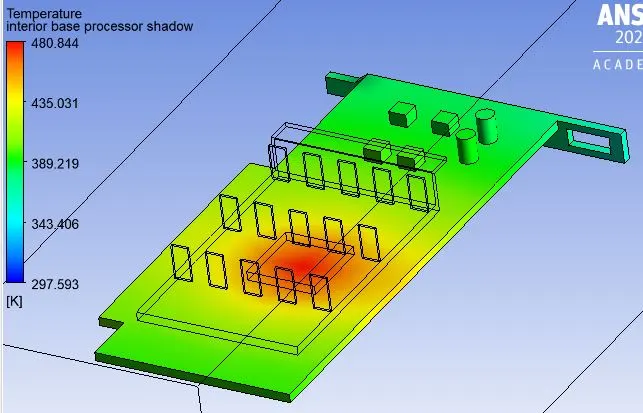
The potential hotspot in the graphic card is the processor and the region which is in direct contact with it since it is the only heat-generating part in the entire assembly. The temperature of the remaining components in the assembly is influenced by the heat generated by the processor. In turn, the processor produces a higher amount of heat as its workload increases. In this simulation, the heat generation is kept constant.
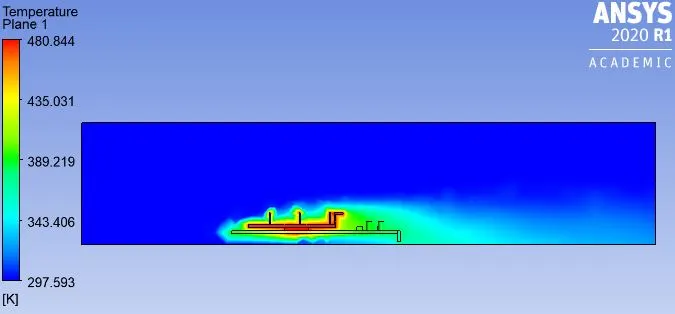
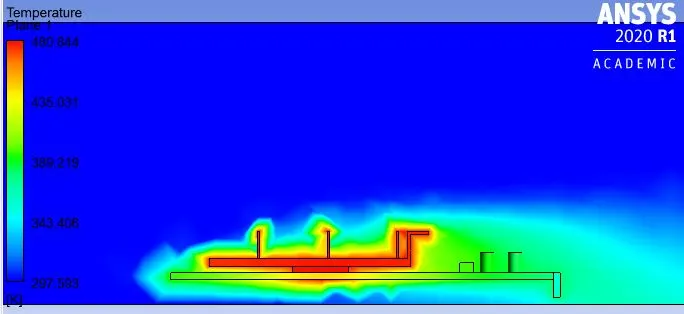
The above temperature contours are on the plane passing through the graphic card assembly. The temperature from the inlet fairly remains constant until it encounters the graphic card assembly. The temperature of air dramatically increases as it passes over the graphic card assembly due to the phenomenon of convection, wherein the heat is transferred from the solid to the fluid. This heat is carried away by air and the temperature at the fins is maintained.
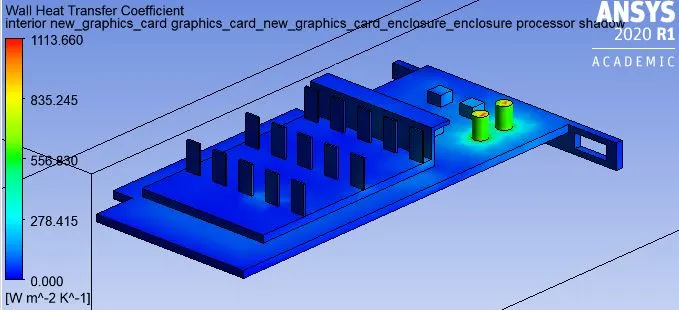
The highest wall heat transfer coefficient obtained was 1113.66 W/m^2K.
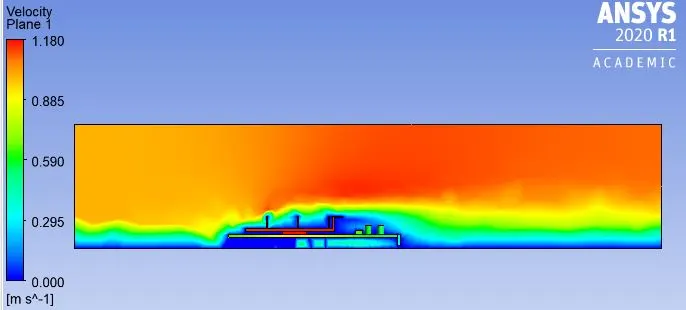
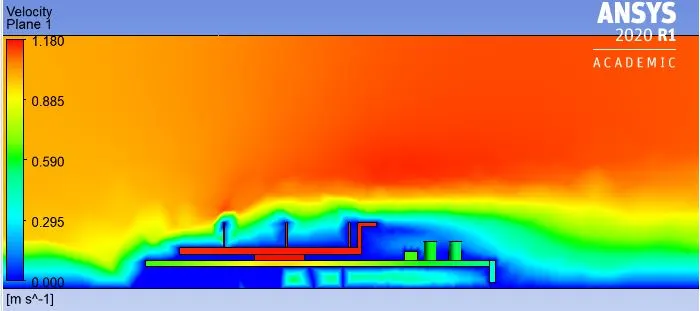
The above velocity contours are on the plane passing through the graphic card assembly. The three walls of the enclosure were given symmetry boundary condition, whereas the wall present below the base of the graphic card was given wall no-slip boundary condition. This is because the base of the graphic card is resting on a surface, which will have a similar boundary condition as we defined. Hence the velocity magnitude at the bottom of the wall is zero. Since the mesh is coarse, the boundary layers cannot be visualized clearly.
Now that we have got desired results by running the simulations using the coarse mesh, we can run the same simulations at different flow velocities using the refined mesh. By doing so, the accuracy of the solution improves and the boundary layer separation can be visualized more clearly.
Refined mesh:
To generate a refined mesh, the mesh element sizing was reduced. Here separate mesh element sizing is provided for the solid and fluid domain. The mesh element size for the solid and fluid domain is 6e-4m and 5e-3m respectively. Once the mesh was generated with the said specifications, a total of 83279 nodes and 481203 elements were created. The share topology feature was enabled in the SpaceClaim so that the generated mesh is conformal.
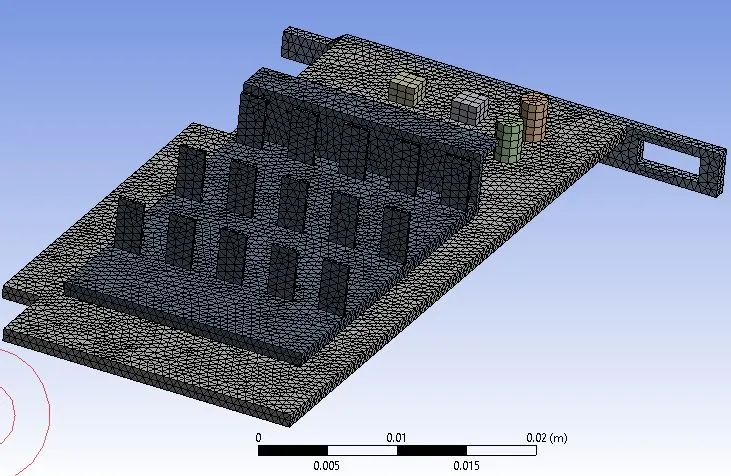
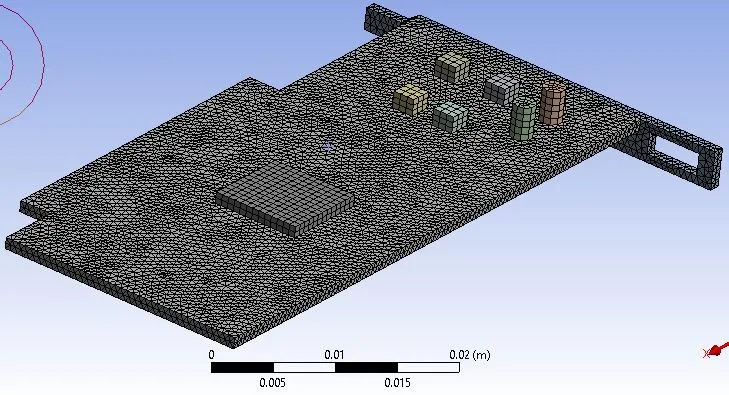
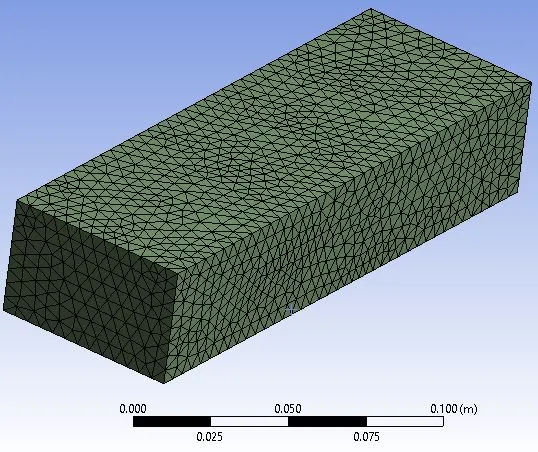
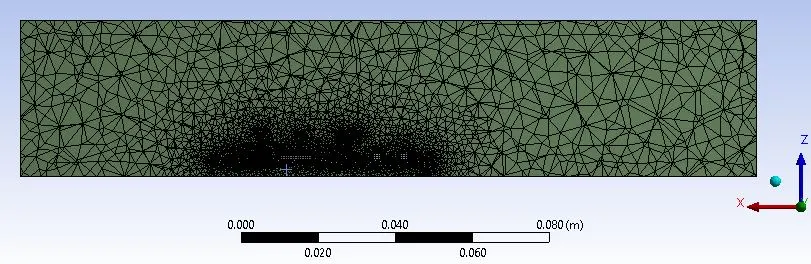
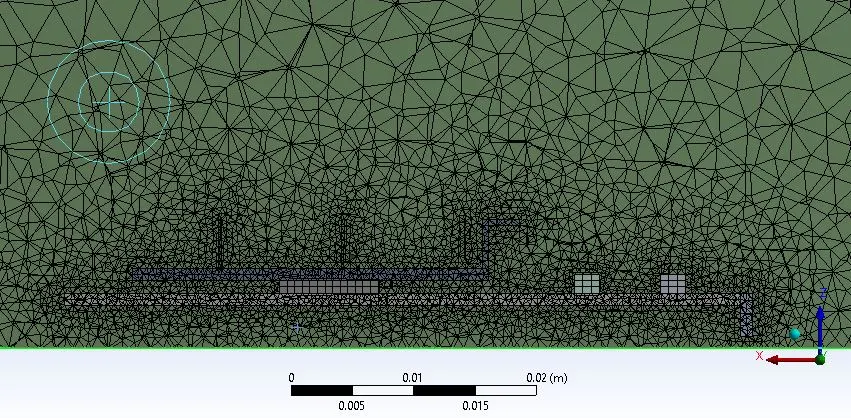
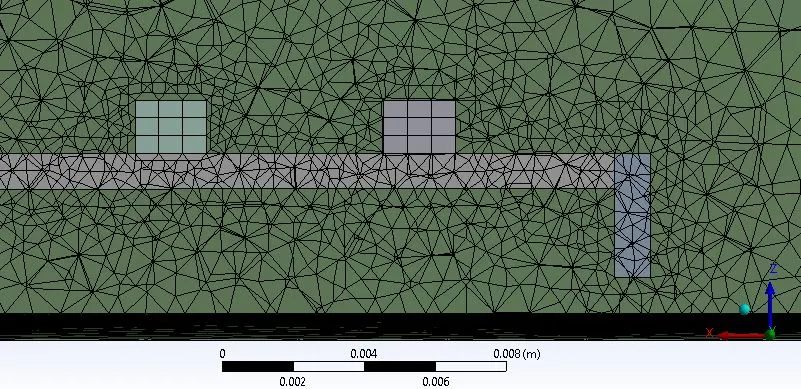
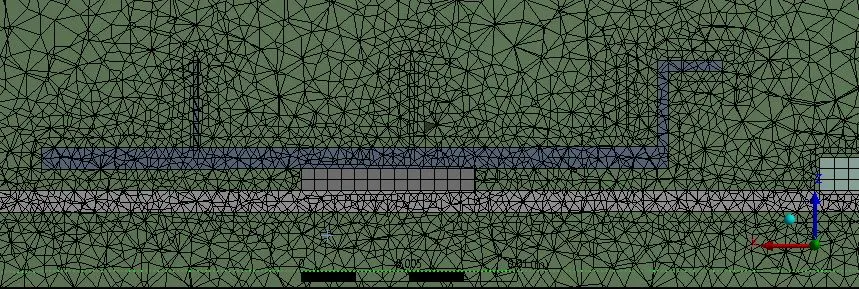
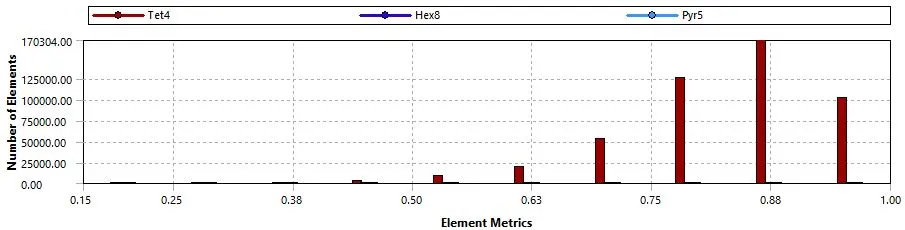
The mesh quality is checked, and since a majority of the mesh elements have mesh quality greater than 50%, the mesh is said to be suitable to perform CHT analysis.
Case1: velocity= 1m/s
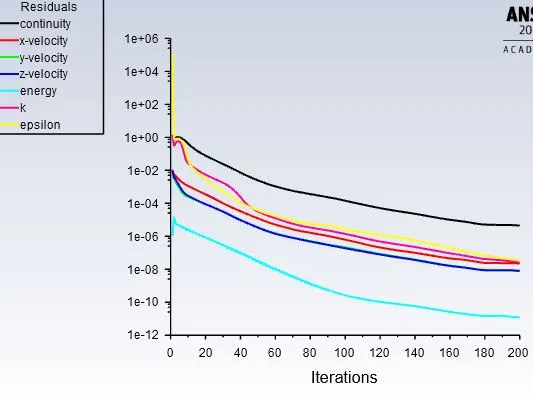
The K-epsilon realizable turbulence model used to solve this problem since the solution converges faster. The velocity at the inlet (the free-stream velocity) is 1m/s and the temperature 25 C. The heat generation term is added to the processor in the cell conditions tab. The solution was run for 200 iterations and from the trend of the plot, we can say that the solution got converges after performing around 150 iterations.
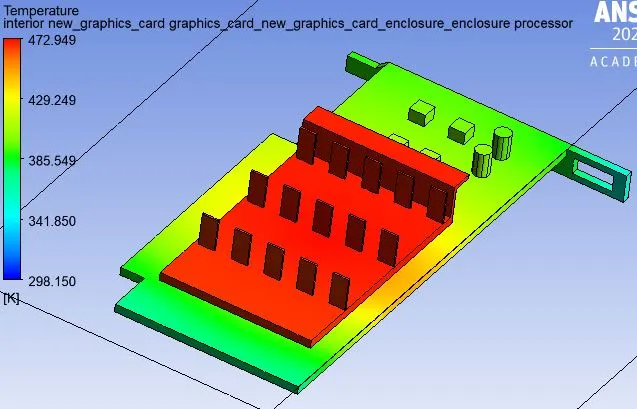
The highest temperature attained by the graphic card for this condition is 472.949K. From the temperature contour shown above, we can see that the temperature of the fins is comparatively higher than that to the base. This is simply because the copper material used for the fins has a greater thermal conductivity than that of steel which is used for the base. This is desirable since the main application of the fins is to dissipate the heat, and if the temperature of the fins is high, the more heat can be dissipated.
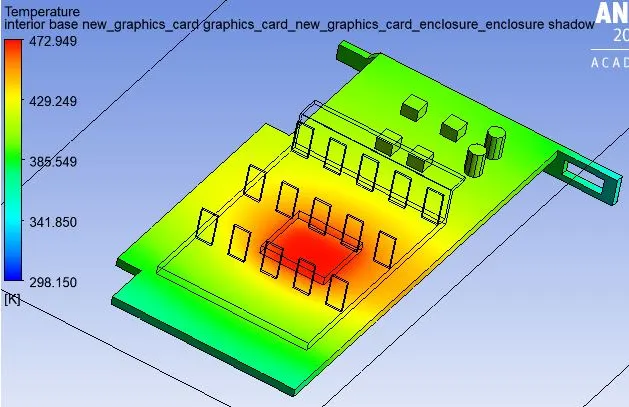
The potential hotspot in the graphic card is the processor and the region which is in direct contact with it since it is the only heat-generating part in the entire assembly. The temperature of the remaining components in the assembly is influenced by the heat generated by the processor. In turn, the processor produces a higher amount of heat as its workload increases. In this simulation, the heat generation is kept constant.
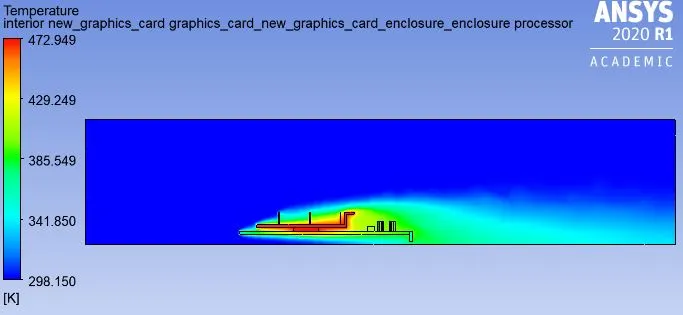
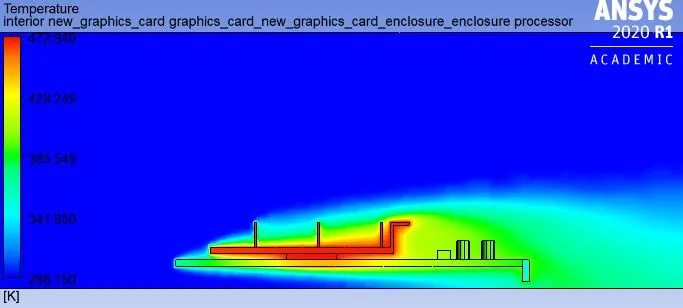
The above temperature contours are on the plane passing through the graphic card assembly. The temperature from the inlet fairly remains constant until it encounters the graphic card assembly. The temperature of air dramatically increases as it passes over the graphic card assembly due to the phenomenon of convection, wherein the heat is transferred from the solid to the fluid. This heat is carried away by air and the temperature at the fins is maintained.
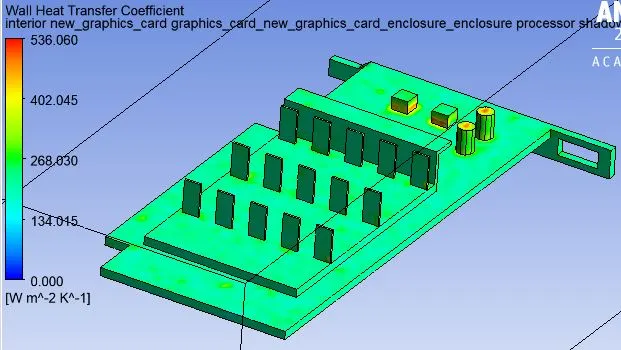
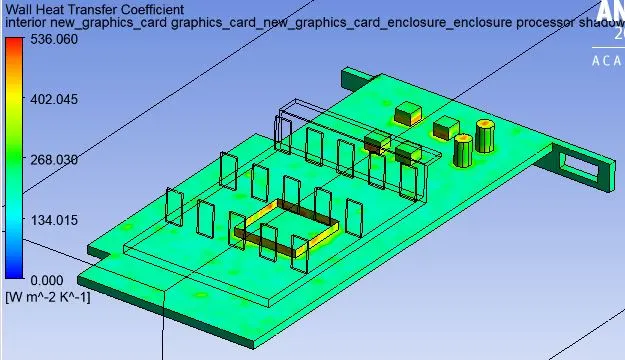
The highest wall heat transfer coefficient obtained was 536.06 W/m^2K.
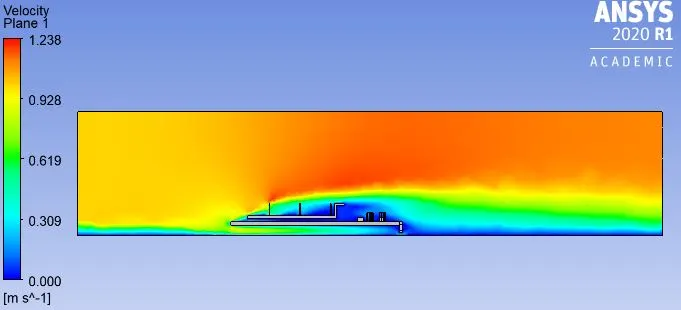
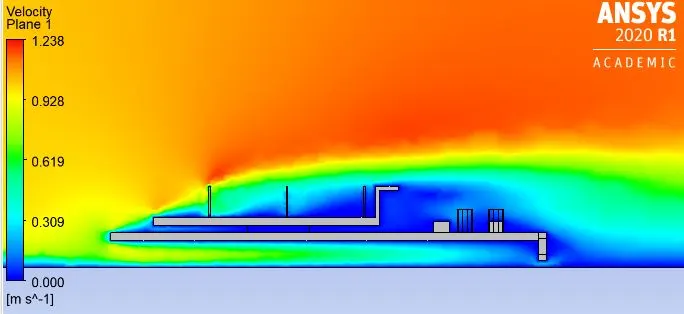
The above velocity contours are on the plane passing through the graphic card assembly. The three walls of the enclosure were given symmetry boundary condition, whereas the wall present below the base of the graphic card was given wall no-slip boundary condition. This is because the base of the graphic card is resting on a surface, which will have a similar boundary condition as we defined. Hence the velocity magnitude at the bottom of the wall is zero.
Case2: velocity 3m/s
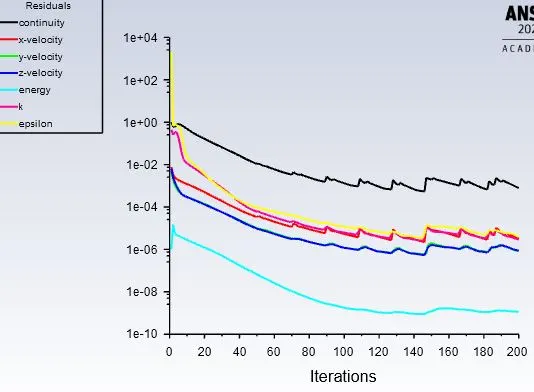
The K-epsilon realizable turbulence model used to solve this problem since the solution converges faster. The velocity at the inlet (the free-stream velocity) is 3m/s and the temperature 25 C. The heat generation term is added to the processor in the cell conditions tab. The solution was run for 200 iterations and from the trend of the plot, we can say that the solution converges after performing around 130 iterations.
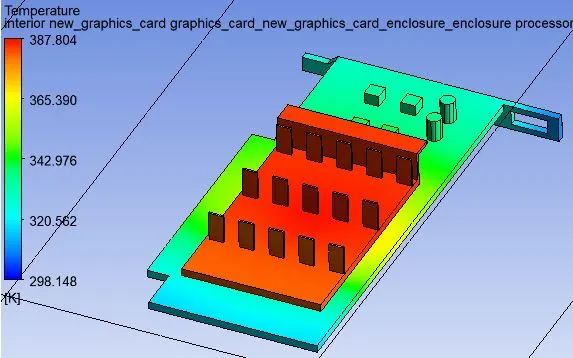
The highest temperature attained by the graphic card for this condition is 387.804K. From the temperature contour shown above, we can see that the temperature of the fins is comparatively higher than that to the base. This is simply because the copper material used for the fins has a greater thermal conductivity than that of steel which is used for the base. This is desirable since the main application of the fins is to dissipate the heat, and if the temperature of the fins is high, the more heat can be dissipated.
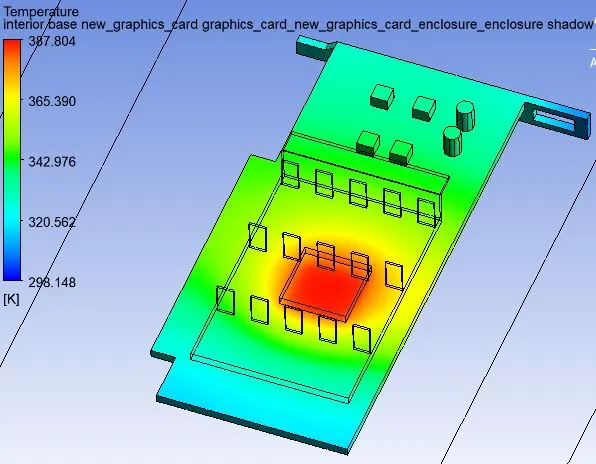
The potential hotspot in the graphic card is the processor and the region which is in direct contact with it since it is the only heat-generating part in the entire assembly. The temperature of the remaining components in the assembly is influenced by the heat generated by the processor. In turn, the processor produces a higher amount of heat as its workload increases. In this simulation, the heat generation is kept constant.
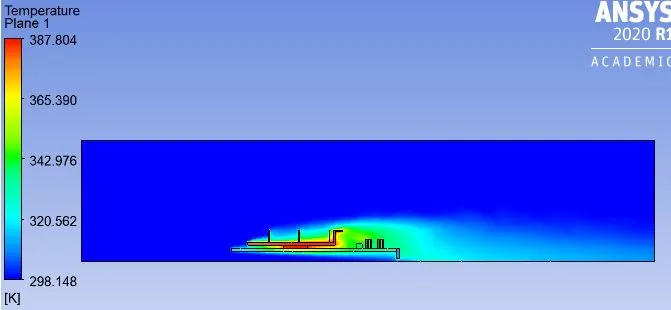
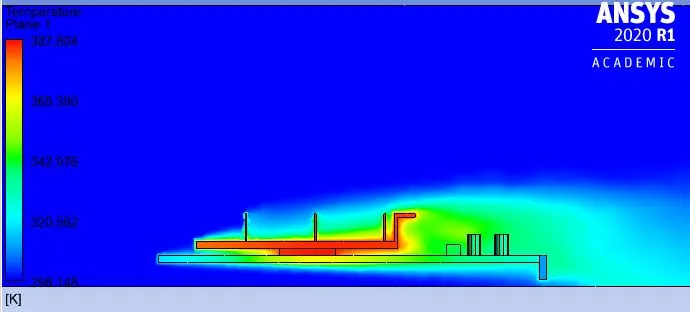
The above temperature contours are on the plane passing through the graphic card assembly. The temperature from the inlet fairly remains constant until it encounters the graphic card assembly. The temperature of air dramatically increases as it passes over the graphic card assembly due to the phenomenon of convection, wherein the heat is transferred from the solid to the fluid. This heat is carried away by air and the temperature at the fins is maintained.
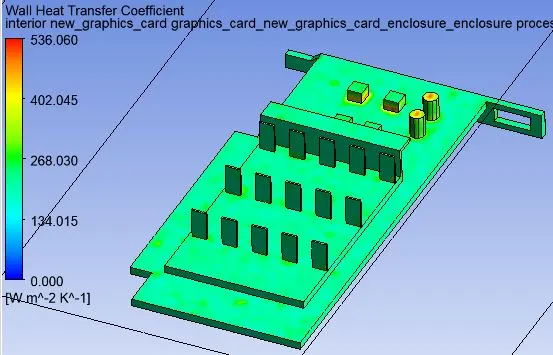
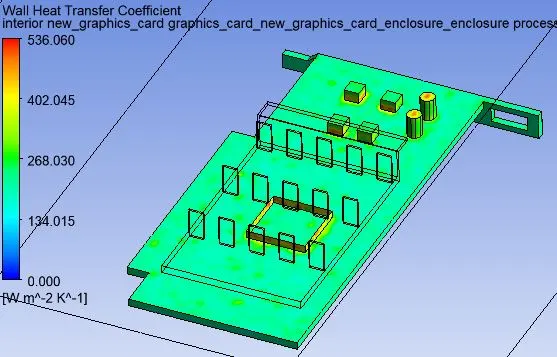
The highest wall heat transfer coefficient obtained was 536.06W/m^2K.
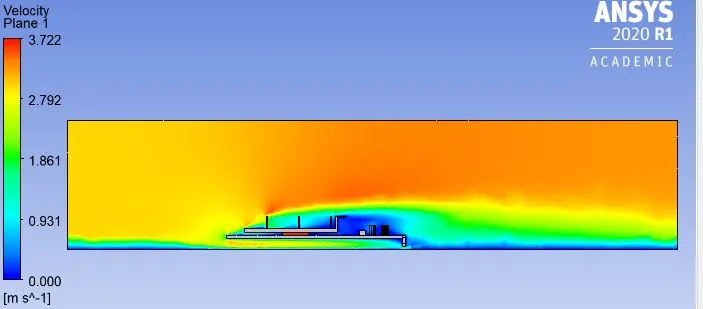
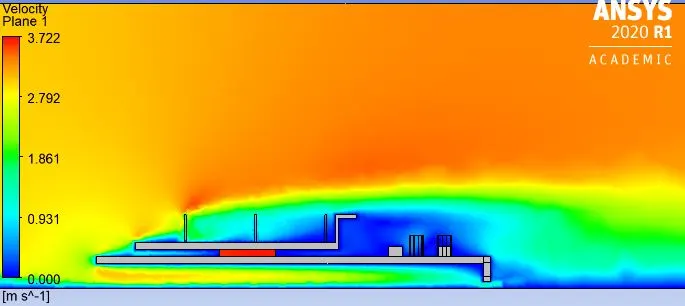
The above velocity contours are on the plane passing through the graphic card assembly. The three walls of the enclosure were given symmetry boundary condition, whereas the wall present below the base of the graphic card was given wall no-slip boundary condition. This is because the base of the graphic card is resting on a surface, which will have a similar boundary condition as we defined. Hence the velocity magnitude at the bottom of the wall is zero.
Case3: velocity 5m/s
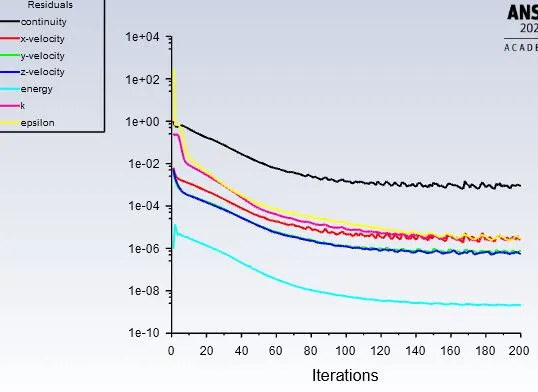
The K-epsilon realizable turbulence model used to solve this problem since the solution converges faster. The velocity at the inlet (the free-stream velocity) is 5m/s and the temperature 25 C. The heat generation term is added to the processor in the cell conditions tab. The solution was run for 200 iterations and from the trend of the plot, we can say that the solution converges after performing around 130 iterations.
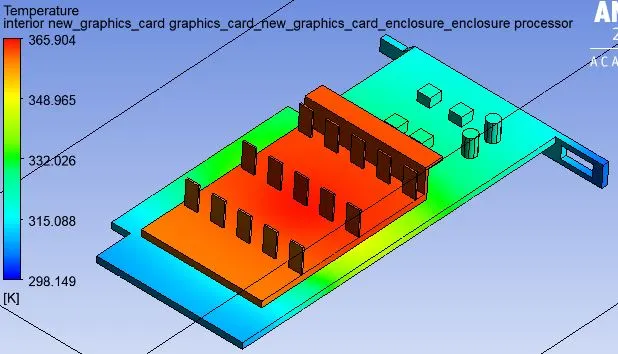
The highest temperature attained by the graphic card for this condition is 365.904K. From the temperature contour shown above, we can see that the temperature of the fins is comparatively higher than that to the base. This is simply because the copper material used for the fins has a greater thermal conductivity than that of steel which is used for the base. This is desirable since the main application of the fins is to dissipate the heat, and if the temperature of the fins is high, the more heat can be dissipated.
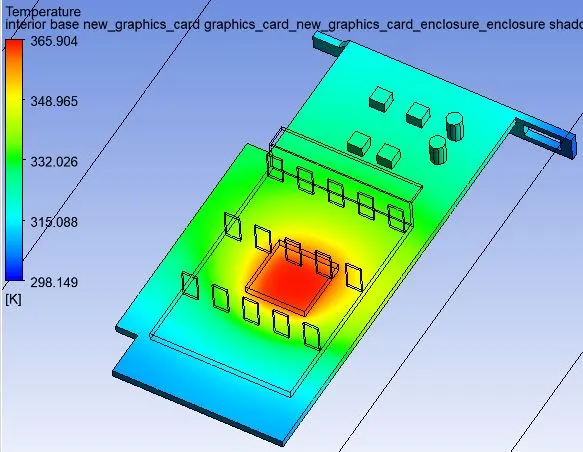
The potential hotspot in the graphic card is the processor and the region which is in direct contact with it since it is the only heat-generating part in the entire assembly. The temperature of the remaining components in the assembly is influenced by the heat generated by the processor. In turn, the processor produces a higher amount of heat as its workload increases. In this simulation, the heat generation is kept constant.
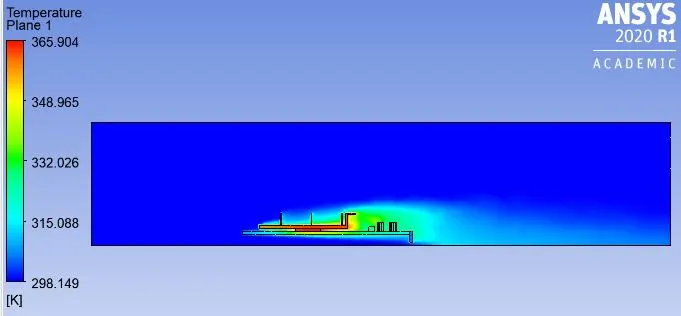
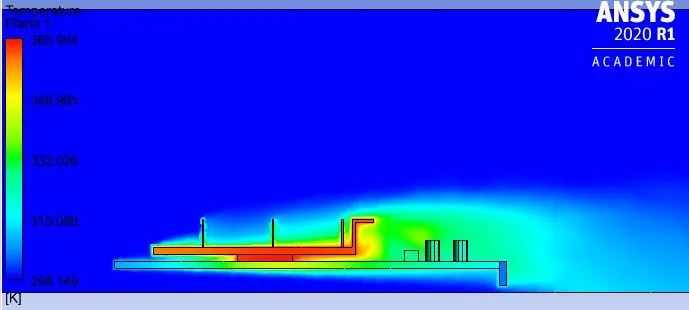
The above temperature contours are on the plane passing through the graphic card assembly. The temperature from the inlet fairly remains constant until it encounters the graphic card assembly. The temperature of air dramatically increases as it passes over the graphic card assembly due to the phenomenon of convection, wherein the heat is transferred from the solid to the fluid. This heat is carried away by air and the temperature at the fins is maintained.
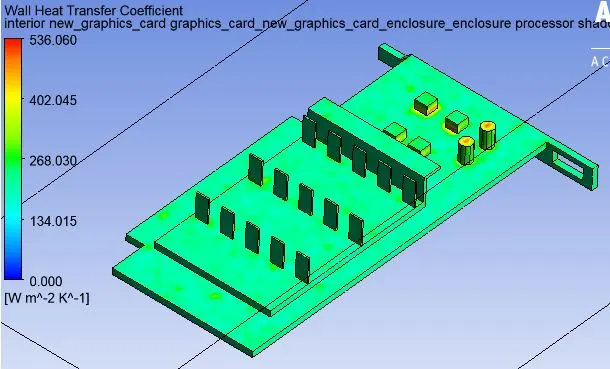
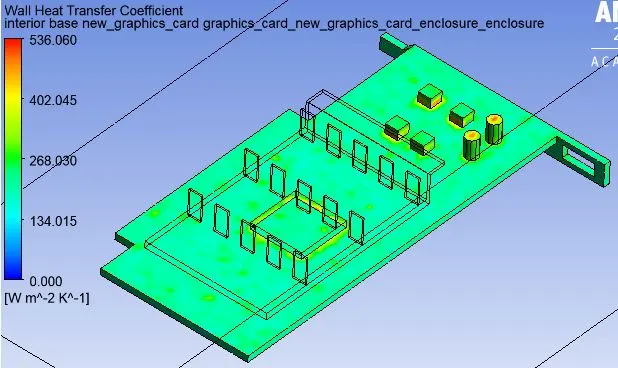
The highest wall heat transfer coefficient obtained was 536.06 W/m^2K.
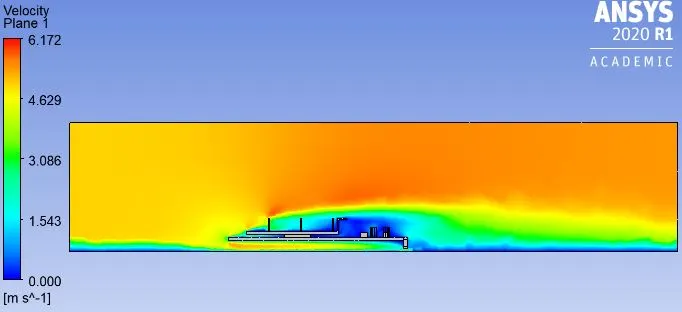
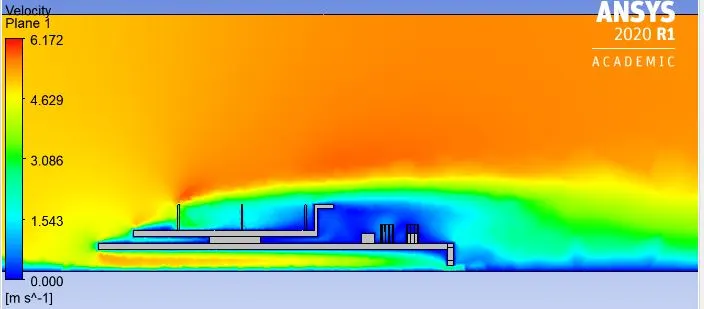
The above velocity contours are on the plane passing through the graphic card assembly. The three walls of the enclosure were given symmetry boundary condition, whereas the wall present below the base of the graphic card was given wall no-slip boundary condition. This is because the base of the graphic card is resting on a surface, which will have a similar boundary condition as we defined. Hence the velocity magnitude at the bottom of the wall is zero.
Results:
| Type of mesh used | Fluid flow velocity(m/s) | Maximum temperature(K) | Maximum wall heat transfer coefficient(W/m^2 K) |
| Coarse | 1 | 480.844 | 1113.66 |
| Refined | 1 | 472.949 | 536.06 |
| Refined | 3 | 387.804 | 536.06 |
| Refined | 5 | 365.904 | 536.06 |
From the above table, we can say that the refined mesh gives more accurate results compared to the coarse mesh. The maximum temperature of the graphic card assembly reduces with the increase in the flow velocity. This is because as the velocity of flow is increased, more amount of heat is carried away by air. The heat transfer coefficient is the highest in the regions which are in contact with the processor. This region is not affected by the change in flow velocity since there is no airflow present, hence, the maximum heat transfer coefficient remains the same for all the flow velocities. But this does not mean that the maximum wall heat transfer coefficient remains the same in the regions exposed to the fluid flow. In the regions which are exposed to the fluid flow, the wall heat transfer coefficient increases with the increase in fluid flow velocity.
Conclusions:
- The refined mesh provides more accurate results compared to the coarse mesh. This accuracy can be increased by increasing the number of mesh elements.
- The temperature of the graphic card assembly decreases with the increase in fluid flow velocity because as the velocity of flow increases, more heat is carried away by it, hence cooling the graphic card.
- The highest wall heat transfer coefficient was obtained neat the processor walls, which is 536.06 W/m^2K. This region is not affected by the fluid flow, since these walls are in contact with each other and there is no space for air to flow in between them. In the regions which experience fluid flow, the wall heat transfer coefficient increases with the increase in fluid flow velocity.
- The processor is the potential hotspot of the graphic card assembly since it is the only heat generating part of the entire assembly. The temperature and wall heat transfer coefficients of the processor and other parts are influenced by the heat generated by the processor. Also, the heat generated by the processor depends on its workload. Higher the workload, the higher the heat generated by the processor.