Comparative study of different storey buildings for Seismic forces
Comparision 1
Aim: To compare the effect of stiffness on natural period of buildings E & F and G & H using ETABS
Building E:
1. Opening New model
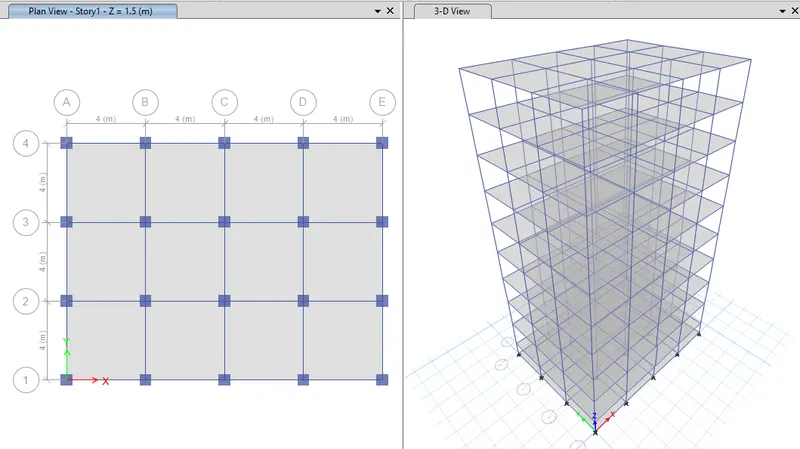
2. Setting the Building E & F storey as 10 and number of bays in X direction as 4 and in Y direction as 3
3. Defining the section property of column as 400X400mm for upper 5 storeys,Bottom 5 storeys as 600X600mm
4. And also defining the other section properties of Beam and slab
5. Assigning the Live load as 3kN/m2 .
6..Run the analysis
7. In Display tab selecting the show table option
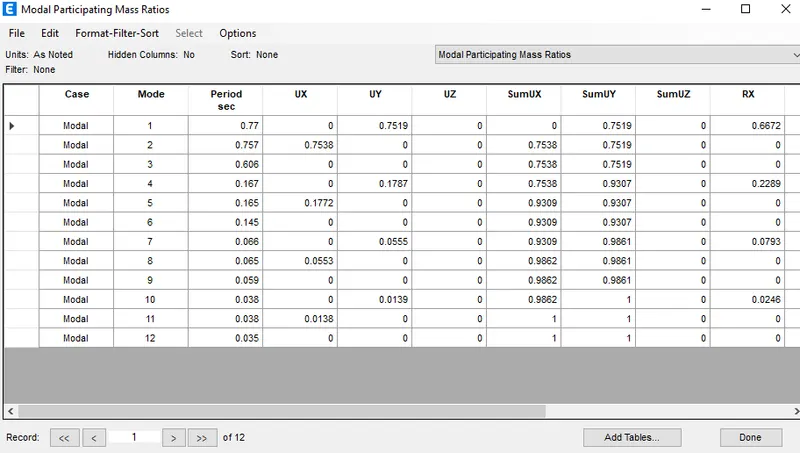
8. Checking in the modal participating ratio
Building F:
1. Opening New model
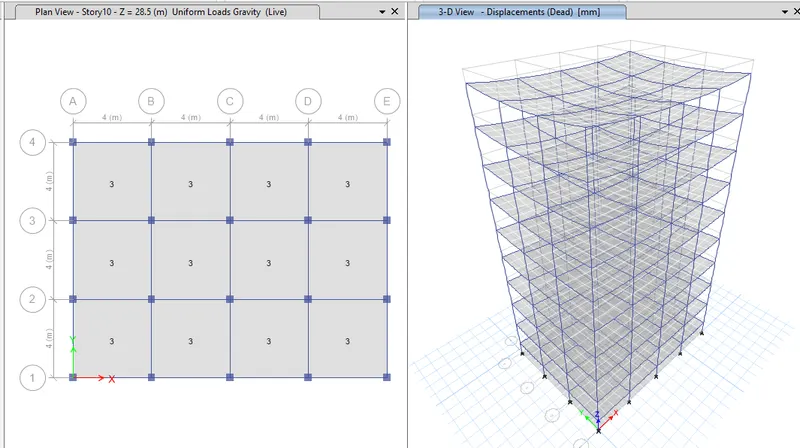
2. Setting the Building E & F storey as 10 and number of bays in X direction as 4 and in Y direction as 3
3. Defining the section property of column as 600X600mm
4. And also defining the other section properties of Beam and slab
5. Assigning the Live load as 3kN/m2 .
6..Run the analysis
7. In Display tab selecting the show table option
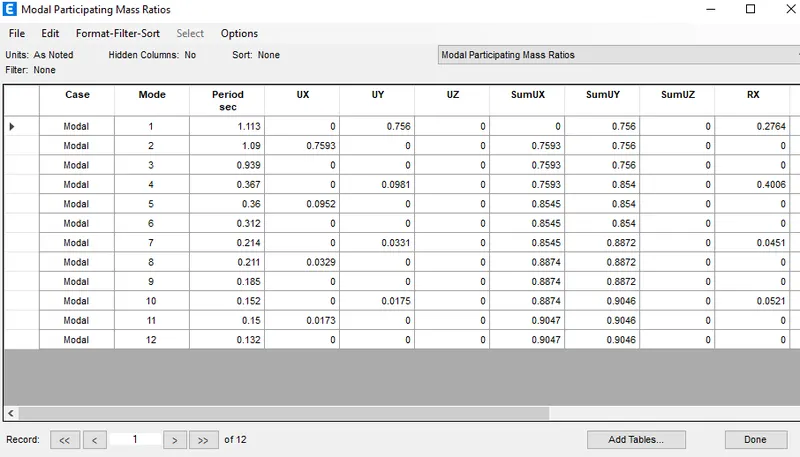
8. Checking in the modal participating ratio
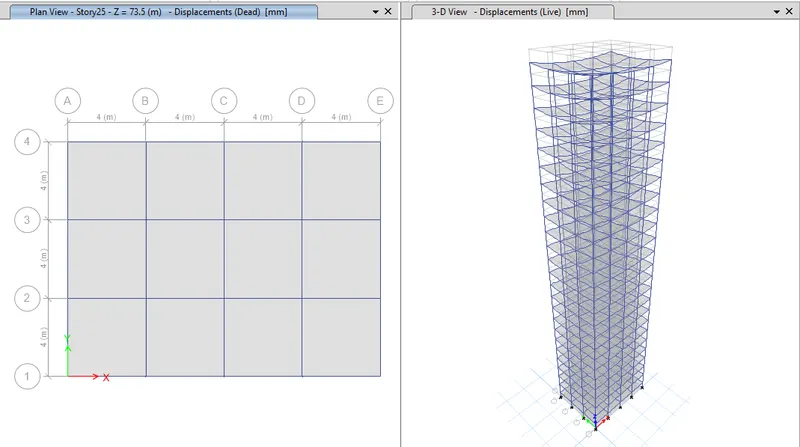
Building G:
1. Opening New model
2. Setting the Building E & F storey as 10 and number of bays in X direction as 4 and in Y direction as 3
3. Defining the section property of column as 400X400mm for upper 5 storeys,Middle 10 storeys as 600X600mm and Bottom 10 storey as 800X800mm
4. And also defining the other section properties of Beam and slab
5. Assigning the Live load as 3kN/m2 .
6..Run the analysis
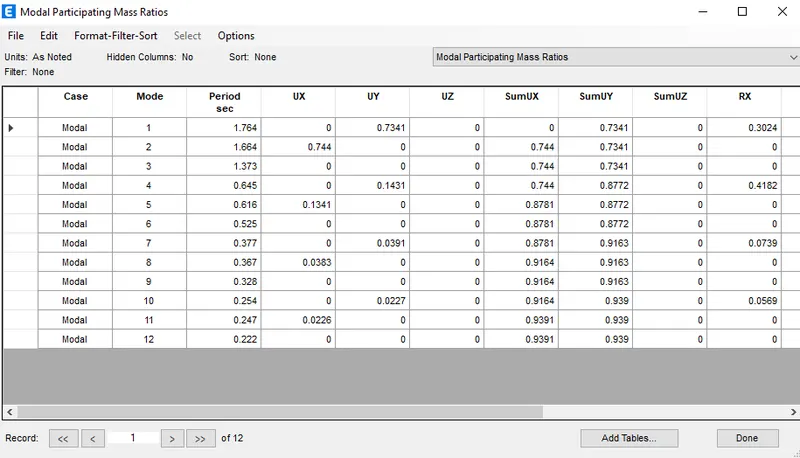
7. In Display tab selecting the show table option
8. Checking in the modal participating ratio
Building H:
1. Opening New model
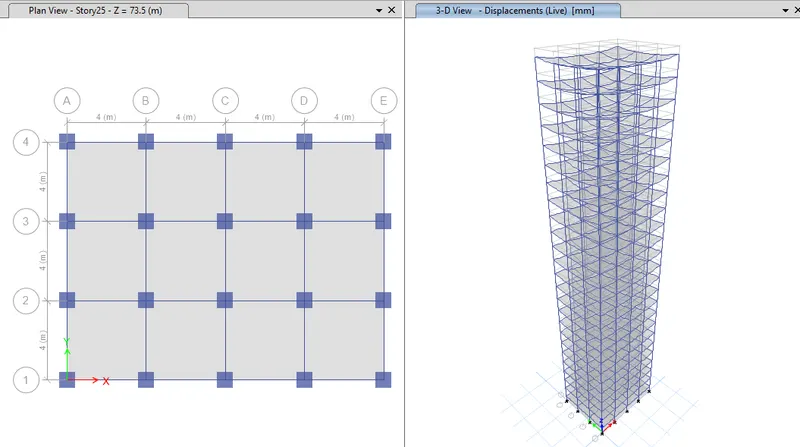
2. Setting the Building E & F storey as 10 and number of bays in X direction as 4 and in Y direction as 3
3. Defining the section property of column as 600X600mm
4. And also defining the other section properties of Beam and slab
5. Assigning the Live load as 3kN/m2 .
6..Run the analysis
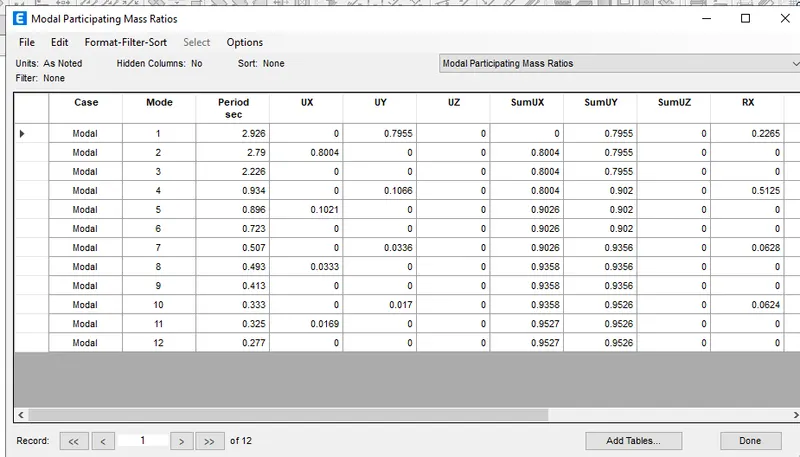
7. In Display tab selecting the show table option
8. Checking in the modal participating ratio
Conclusion:
Time period of E=0.77
Time period of F=1.113
Time period of G=1.764
Time period of H= 2.926
As the Height and the sectional dimensions of the column and building changes the Time period also varies
Comparision 2
Aim: To compare the effect of mass on natural period of buildings H,J and K using ETABS
Building H:
1. Opening New model
2. Setting the Building H storey as 25 and number of bays in X direction as 4 and in Y direction as 3
3. Defining the section property of column as 800X800mm
4. And also defining the other section properties of Beam and slab
5. Assigning the Live load as 3kN/m2 .
6..Run the analysis
7. In Display tab selecting the show table option
8. Checking in the modal participating ratio
Building J:
1. Opening New model
2. Setting the Building J storey as 25 and number of bays in X direction as 4 and in Y direction as 3
3. Defining the section property of column as 800X800mm
4. And also defining the other section properties of Beam and slab
5. Assigning the Live load as 3.3kN/m2 .
6..Run the analysis
7. In Display tab selecting the show table option
8. Checking in the modal participating ratio
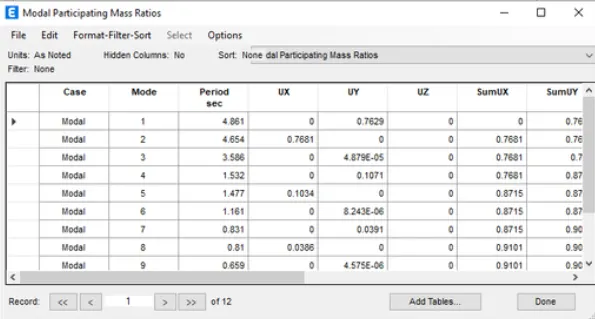
Building K:
1. Opening New model
2. Setting the Building J storey as 25 and number of bays in X direction as 4 and in Y direction as 3
3. Defining the section property of column as 800X800mm
4. And also defining the other section properties of Beam and slab
5. Assigning the Live load as 3.6kN/m2 .
6..Run the analysis
7. In Display tab selecting the show table option
8. Checking in the modal participating ratio
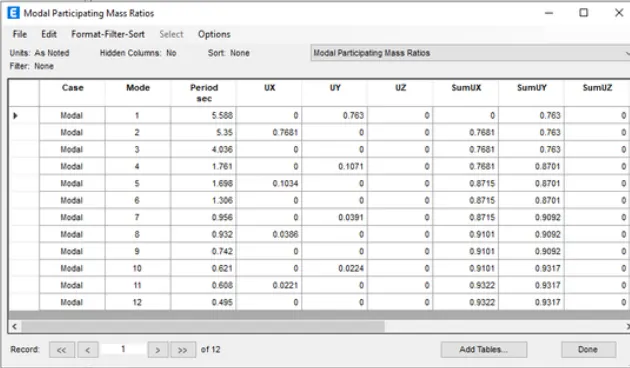
Conclusion:
Time period of H=2.962
Time period of J=4.861
Time period of K=5.588
As the mass of the building is gradually increased that is the like load is incremented 10% and 20% the natural period also increases
Comparision 3
Aim: To compare the effect of Height on natural period of buildings A , B, F & H using ETABS
Building A:
1. Opening New model
2. Setting the Building A storey as 2 and number of bays in X direction as 4 and in Y direction as 3
3. Defining the section property of column as 400X400mm
4. And also defining the other section properties of Beam and slab
5. Assigning the Live load as 3kN/m2 .
6..Run the analysis
7. In Display tab selecting the show table option
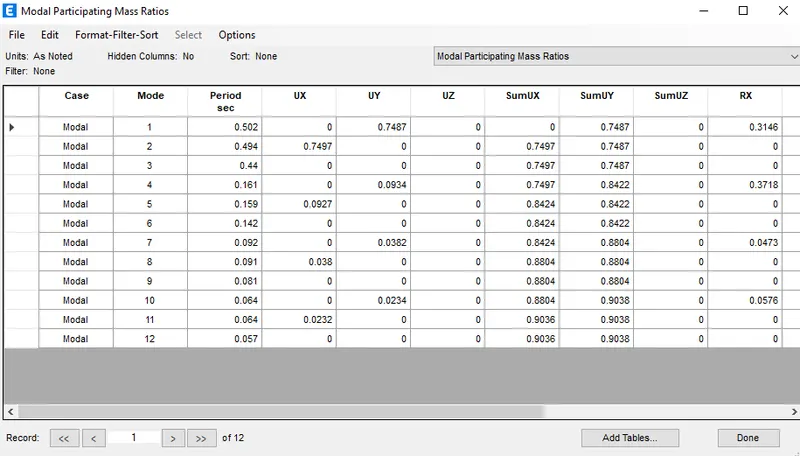
8. Checking in the modal participating ratio
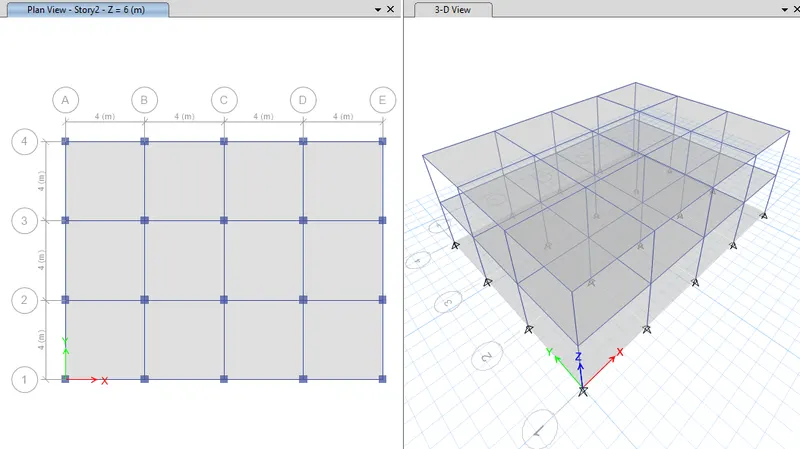
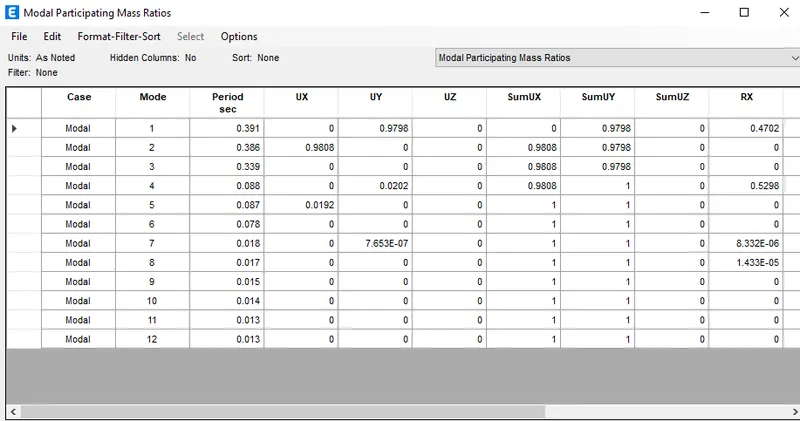
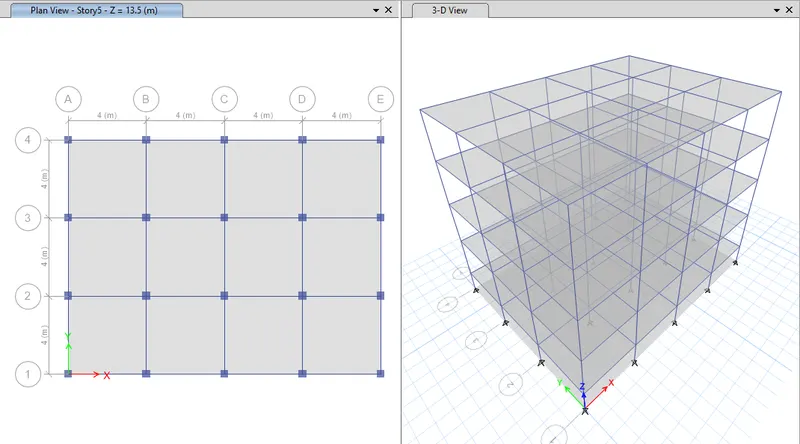
Building B:
1. Opening New model
2. Setting the Building B storey as 5 and number of bays in X direction as 4 and in Y direction as 3
3. Defining the section property of column as 400X400mm
4. And also defining the other section properties of Beam and slab
5. Assigning the Live load as 3kN/m2 .
6..Run the analysis
7. In Display tab selecting the show table option
8. Checking in the modal participating ratio
Building F:
1. Opening New model
2. Setting the Building E & F storey as 10 and number of bays in X direction as 4 and in Y direction as 3
3. Defining the section property of column as 600X600mm
4. And also defining the other section properties of Beam and slab
5. Assigning the Live load as 3kN/m2 .
6..Run the analysis
7. In Display tab selecting the show table option
8. Checking in the modal participating ratio
Building H:
1. Opening New model
2. Setting the Building H storey as 25 and number of bays in X direction as 4 and in Y direction as 3
3. Defining the section property of column as 800X800mm
4. And also defining the other section properties of Beam and slab
5. Assigning the Live load as 3kN/m2 .
6..Run the analysis
7. In Display tab selecting the show table option
8. Checking in the modal participating ratio
Conclusion:
Time period of A=0.391
Time period of B=0.502
Time period of F=1.113
Time period of H= 2.926
COMPARISION 4
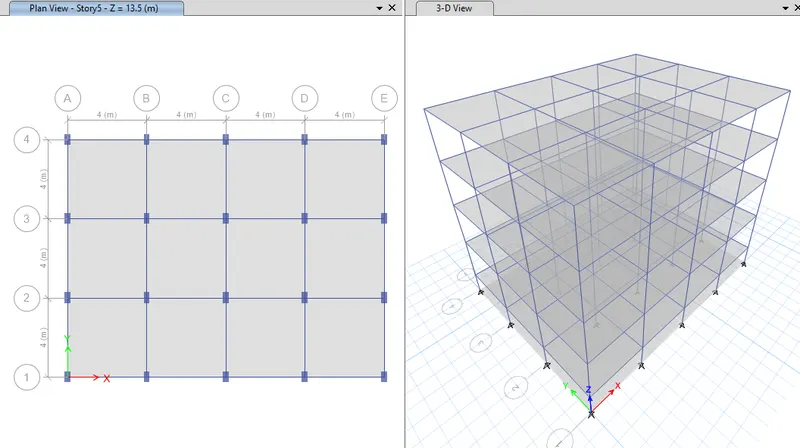
Aim: To compare the effect of Height on natural period of buildings B, C & D using ETABS
Building B:
1. Opening New model
2. Setting the Building B storey as 5 and number of bays in X direction as 4 and in Y direction as 3
3. Defining the section property of column as 400X400mm
4. And also defining the other section properties of Beam and slab
5. Assigning the Live load as 3kN/m2 .
6..Run the analysis
7. In Display tab selecting the show table option
8. Checking in the modal participating ratio
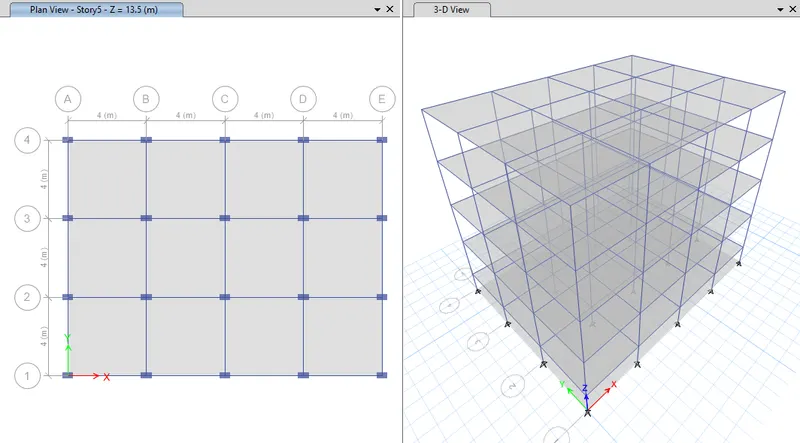
Building C:
1. Opening New model
2. Setting the Building C storey as 5 and number of bays in X direction as 4 and in Y direction as 3
3. Defining the section property of column as 550X300mm
4. And also defining the other section properties of Beam and slab
5. Assigning the Live load as 3kN/m2 .
6..Run the analysis
7. In Display tab selecting the show table option
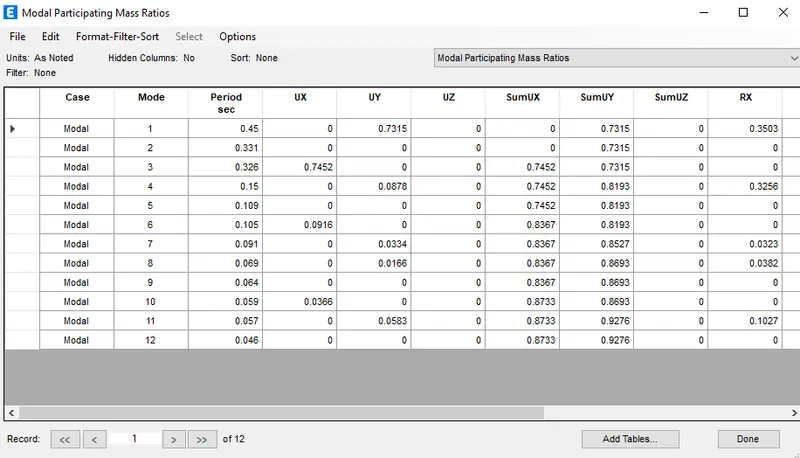
8. Checking in the modal participating ratio
Building D:
1. Opening New model
2. Setting the Building D storey as 5 and number of bays in X direction as 4 and in Y direction as 3
3. Defining the section property of column as 300X550mm
4. And also defining the other section properties of Beam and slab
5. Assigning the Live load as 3kN/m2 .
6..Run the analysis
7. In Display tab selecting the show table option
8. Checking in the modal participating ratio
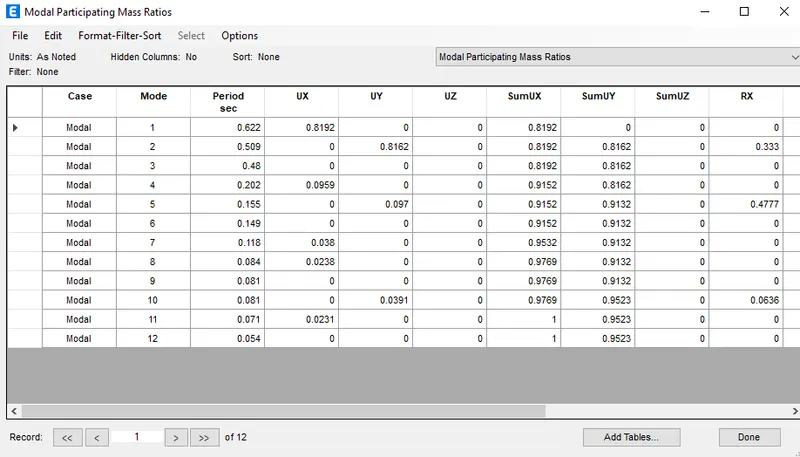
Time period of B=0.502
Time period of C=0.450
Time period of D= 0.622