Challenge 1
Q-Plot stress-strain curve of concrete per modified Hognestad method and per IS 456-2000. Clearly show the characterisitic features of the stress-strain curves in both methods and compare them.
AIM AND INTRODUCTION : Stress -Strain curve of concrete per modified Honestad method and per IS 456-2000 is reqiured to be plotted. Also characterstic features of stress-strain curves in both method along with the comparision to be narrated.
PROCEDURE IN DETAIL :
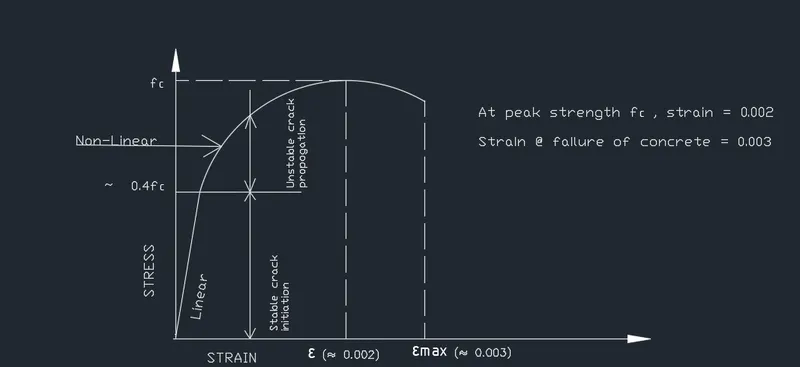
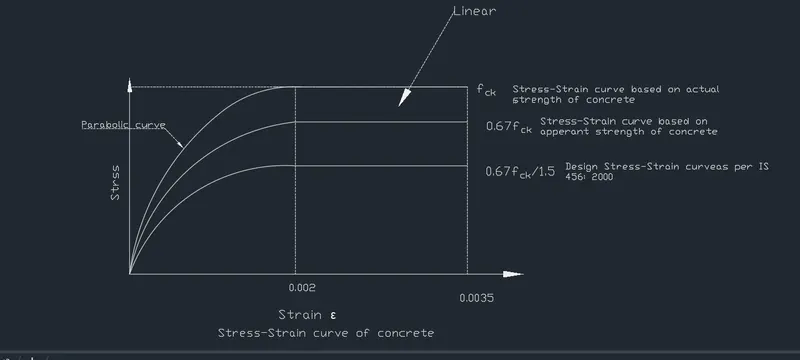
- As per IS 456 :2000 sress-strain curve for concrete is parabolic-linear as shown in the plot
- Stress- strain curve for concrete is linear up to 40% of its strength
- When concrete specimen is loaded progressively , crack development is initiated which remain vertical and stable up to 40% of its strength and on removal of load cracks gets closed.
- When stress in concrete increases beyond 40% of its strength, crack starts propogating in haphazard way which remain vissible even after removal of loading. This portion of curve is non linear and cracks are unstable.
- Maximum strength of concrete is achieved at strain of approximately 0.002. Thereafter strength decreases and finally at a strain of approximately 0.003 , concrete gets crushed that is fails.
- Secant modulus of concrete `E_c = 5000* sqrt f_(ck)` as per clause 6.3.2.1 of IS 456 :2000
- The stress-strain realationship is parabolic for strain upto 0.002 and linear thereafter upto failure strain of 0.0035
- Failure strain of concrete for direct compression is limited to 0.002 and for flexure it is 0.0035.
- Apperant strength of concrete for Practical structures such as beam , column etc. subjected to different types of loading is consindered as 0.76`f_(ck)`
- Design strength of concrete is consided as `0.67 *f_(ck)//gamma_m` where `gamma_m` is material factor of safety which is 1.5
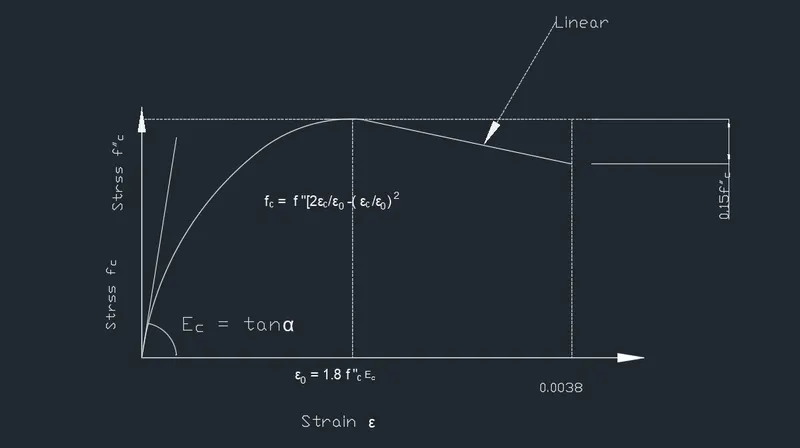
Modified Hognestad parabola can be generated based on three parameters -
- Modulus of elasticity of concrete `E_c- 5000*sqrtf_(ck)`
- `f^"` , the ultimate strength of concrete
- Strain of concrete at any point.
Stress-strain curve is parabola upto f" ( ultimate strength) and then it follows straight line i.e. at constant stess, strain keep on increasing upto failure of concrete which occur at strain of 0.0038.. This curve is mostly used for Research purposes and not much used for design purposes.
RESULT : Thus plot stress- strain curve for concrete as pae IS 456 : 2000 and Honestad method has been plotted as above . Silent features of each has also beeb narrated including the differences.