Basics of ML & AL Week 2 Challenge
1)
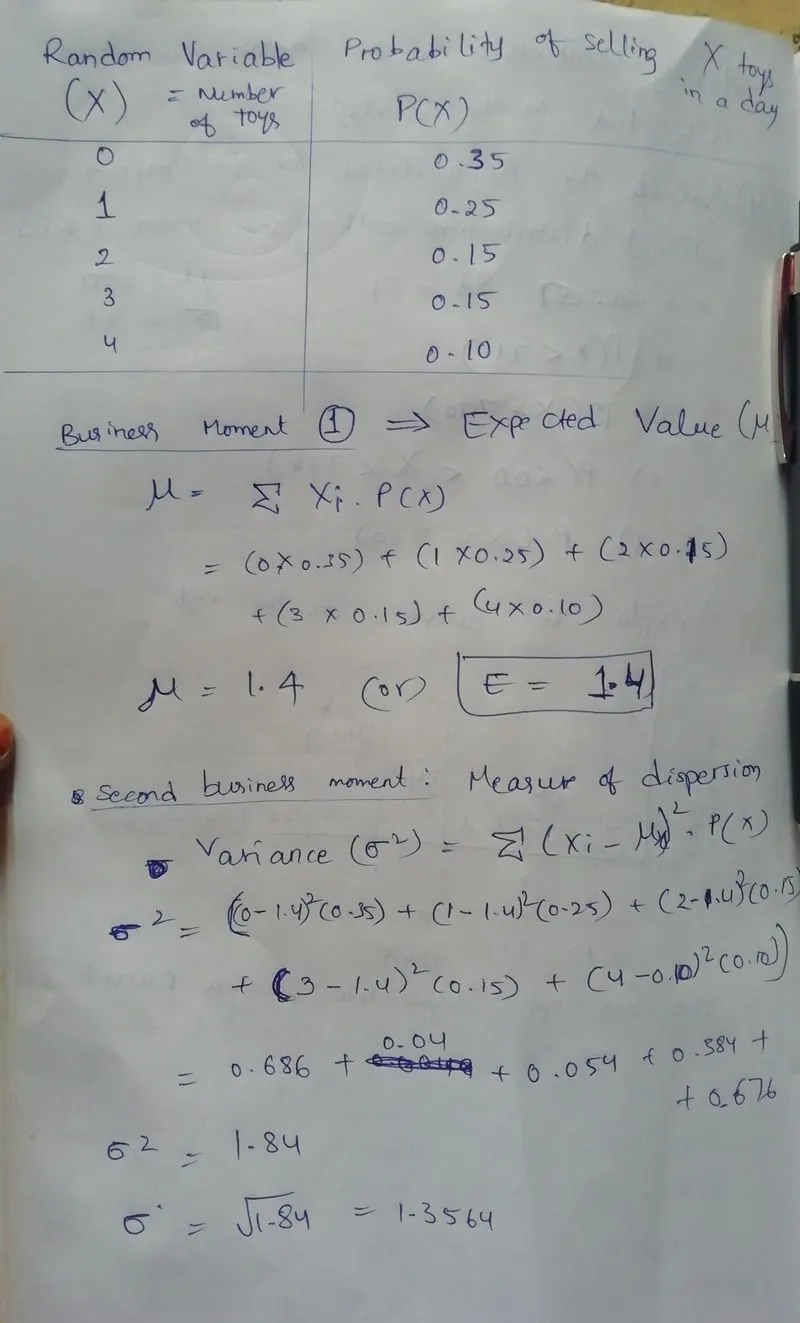
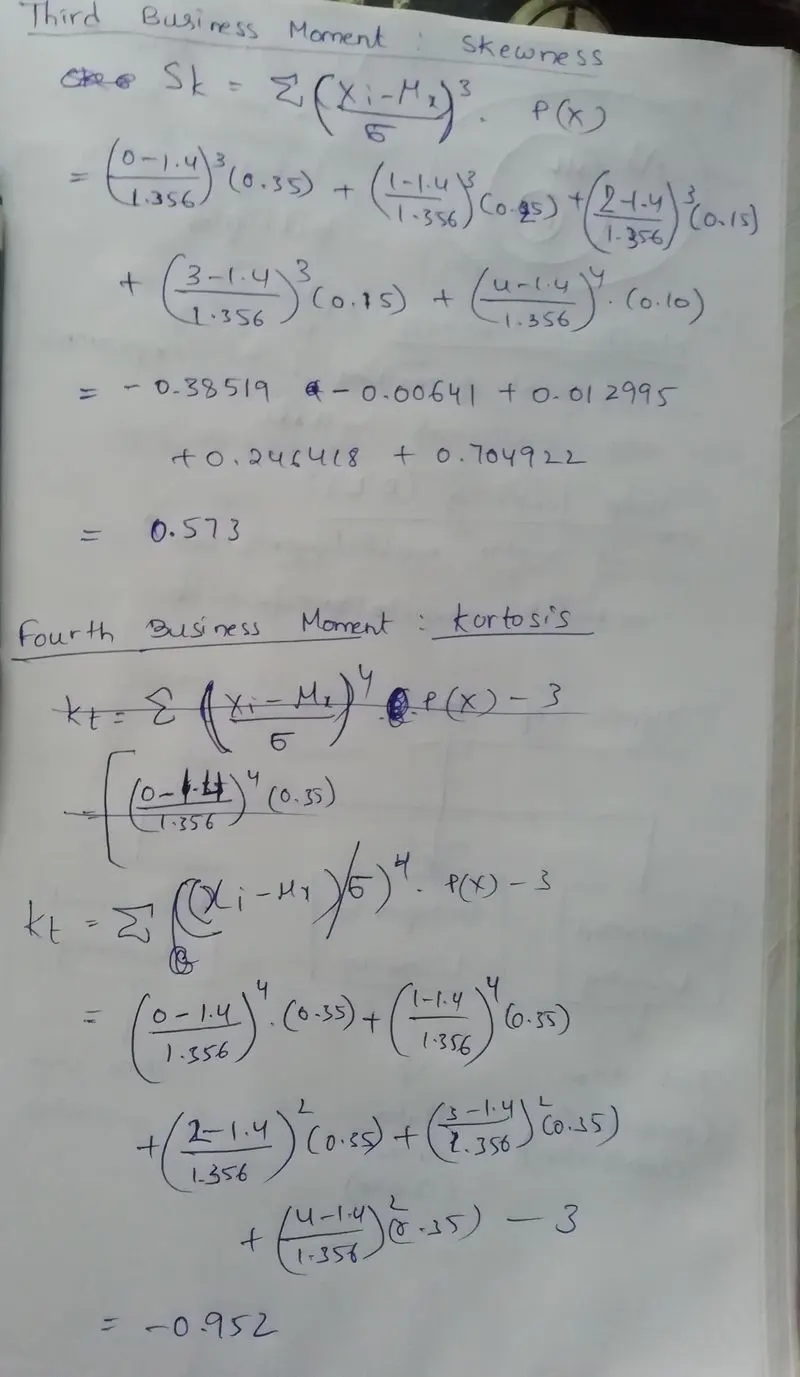
2)Significance ofExpected value:
Expected Value is defined as the weighted average of the values in the range, denoted by E(X). An expected value gives a quick insight into the behaviour of a random variable without knowing if it is discrete or continuous.
`E ( X ) = X i ⋅ P ( X )`
3)
Skewness refers distortion or asymmetry that deviates from the symmetrical bell curve. If the curve is shifted to the left or right, it is said to be skewed. Skewness can be quantified as a representation of the extent to which a given distribution varies from a normal distribution. A normal distribution has a skew of zero
fig: normal distribution 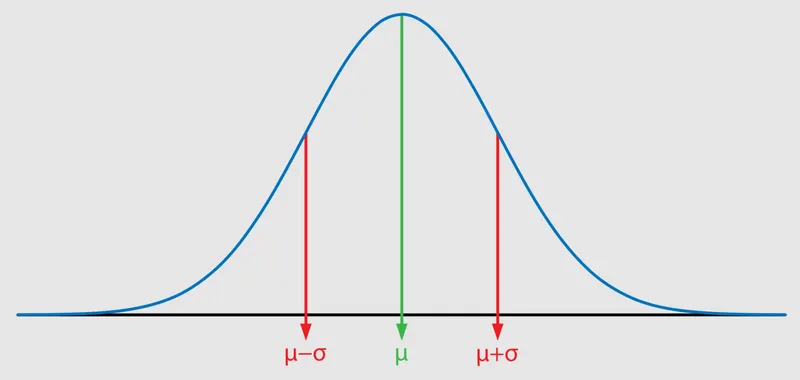
Skewness in curve shows asymmetry of data in analysis
If skewness is negative and it represents bad analysis, and skewness is positive it represents good analysis
4)For a given mean = 680, standard deviation=31
a) assuming x=700 for x<711 P(X) = 0.01045
b) x=750 for x>740, P(X) = 0.00100
c) x=650 for 600<X<720, P(X) = 0.008059
d) x=720, P(X) = 0.00559
5) The curve showing in the figure is Normal Distribution Curve or probabilty bell curve. It has 'zero' skewness or symmetric about standard deviation it is normal distribution curve as it has zero skewness.
In the given curve approximately
68.2 % of the data falls within a distance of one standard deviation from the mean on either side and
95.4% within two standard deviations
99.6% within three standard deviations and 8
99.8% within four standard deviations