Basics of ML & AL Week 2 Challenge
Basics of ML & AL Week 2 Challenge
1)Calculate all 4 business moments using pen and paper for the below data set?
The 4 business moments are , 1.Measure of central tendency , 2.Measure of dispersion, 3.Skewness , 4. Kurtosis
1.Measure of central tendency:
A measure of central tendency is a summary statistic that represents the typical or central value of a dataset. It is used to describe the center of a distribution of data. The three most commonly used measures of central tendency are the mean, median, and mode.
| x | p(x) | x.p(x) |
| 0 | 0.35 | 0 |
| 1 | 0.25 | 0.25 |
| 2 | 0.15 | 0.3 |
| 3 | 0.15 | 0.45 |
| 4 | 0.10 | 0.40 |
| 1.4 |
Here the mean is µ=∑xP(x)= 0 +0.25+0.3+0.45+0.40= 1.4
2.Measure of dispersion:
Describes how much the values in a dataset vary from each other. It is used to quantify the extent to which the data are spread out or clustered around a central value.
∑(x-µ)^2X(p(x)) = (0-1.4)^2x(0.35) + (1-1.4)^2x(0.25) + (2-1.4)^2x(0.15) + (3-1.4)^2x(0.15) + (4-1.4)^2x(0.10)
= 0.686 + 0.04 + 0.09 + 0.384 + 0.676
σ^2 = 1.876
σ =1.36
3.Skewness:
Skewness is the measure of the asymmetry of an ideally symmetric probability distribution and is given by the third standardized moment.
∑((x-µ)/σ)^3Xp(x) = (0-1.4/1.36)^3x(0.35) + (1-1.4/1.36)^3x(0.25) + (2-1.4/1.36)^3x(0.15) + (3-1.4/1.36)^3x(0.15) + (4- 1.4/1.36)^3x(0.10)
(-1.029)^3x(0.35) + (-0.294)^3x(0.25) + (0.441)^3x(0.15) + (1.176)^3x(0.15) + (1.911)^3x(0.10)
-0.3811 - 0.0062 + 0.0128 + 0.2445 + 0.6978
= 0.5678
4. Kurtosis:
Kurtosis is a statistical measure that describes the shape of a probability distribution. It measures the degree to which the tails of a distribution differ from those of a normal distribution.
∑((x-µ)/σ)^4Xp(x) = [(0-1.4/1.36)^4x(0.35) + (1-1.4/1.36)^4x(0.25) + (2-1.4/1.36)^4x(0.15) + (3-1.4/1.36)^4x(0.15) + (4- 1.4/1.36)^4x(0.10)]-3
= (-1.029)^4x(0.35) + (-0.294)^4x(0.25) + (0.441)^4x(0.15) + (1.176)^4x(0.15) + (1.911)^4x(0.10)
= 0.392 + 0.0039 + 0.0056 +0.287+1.33
= 2.0185 - 3
= -0.9815
2)What is the significance of expected value when simple mean (Sum of all observations/number of observations) is already in place.
The sample mean is often used as an estimate of the population mean, and the expected value is used to compute various measures of variability and to make predictions about the future behavior of the random variable, The significance of expected value provides a measure of central tendency of the probability distribution of the random variable.
3) Having skewness in the curve considered to be bad in the analysis?
Skewness is the measure of the asymmetry of an ideally symmetric probability distribution and is given by the third standardized moment. in simple words, skewness is the measure of how much the probability distribution of a random variable deviates from the normal distribution.It depends on the type of analysis that we are perfoming, it is had to determine whether skewness is bad or not.
4)Evaluate the probabilities for continuous normal distribution with given mean = 680 and standard deviation = 31
µ = 680 , σ = 31
a)P(X<711)
z = (x- µ)/σ
= ( 711-680)/31
z = 1
p(z <1) = 0.8413
b)P(X>740)
z = (x- µ)/σ
z = ( 740-680)/31
z =
p(z >1.935) = 0.9732
1 - 0.9732
= 0.0268
c)P(600 < x < 720)
z = (600- 680)/31 = -2.581
z = (720- 680)/31 = 1.290
P(600 < x < 720) = p(-2.581 < z < 1.290)
= p(z<1.290) - p(z<-2.581)
= 0.9015 - 0.0049
= 0.8966
d)P(X=720)
z = (x- µ)/σ
z = ( 720-680)/31 = 1.935
P(X=720) = p(1.935<z<1.935)
= 0.9015 -0.9015
= 0
5)Explain the curve on the right side.
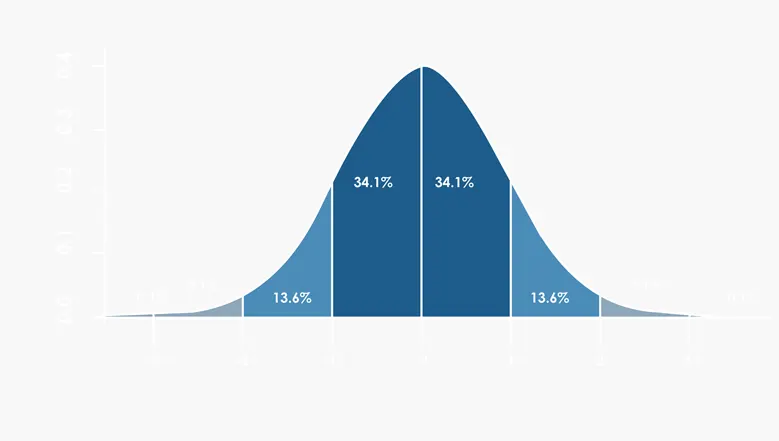
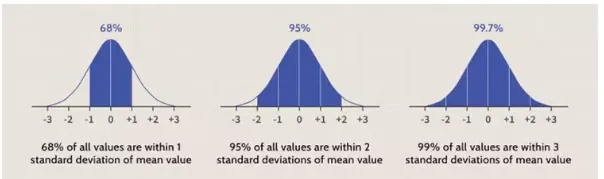
The empirical rule is also known as the three-sigma rule, as "three-sigma" refers to a statistical distribution of data within three standard deviations from the mean on a normal distribution (bell curve), For all normal distributions, 68.2% of the observations will appear within plus or minus one standard deviation of the mean; 95.4% of the observations will fall within +/- two standard deviations; and 99.7% within +/- three standard deviations. This fact is sometimes referred to as the " empirical rule," a heuristic that describes where most of the data in a normal distribution will appear.The empirical rule is used often in statistics for forecasting final outcomes. After calculating the standard deviation and before collecting exact data, this rule can be used as a rough estimate of the outcome of the impending data to be collected and analyzed.