Assignment 7-Side Pole Crash Simulation Challenge
Side Pole Crash Simulation Challenge
Objective:- To perform side pole crash analysis in the neon model with the recommended parameters and output requests.
Problem Specification:-
Neon side crash -BIW
- Check the unit system and either follow [Mg mm s] or [Kg mm ms].
- Create an appropriate interface, friction 0.2, and recommended parameters.
- Make sure of no penetration and intersections.
- Create a rigid wall with friction 0.1 as per the reference model.
- Compare the model weight with the reference model and use added masses to reach the target weight of 700kg while getting CG about the required range.
- Initial velocity - 20mph, as per the standards.
- Use a model checker to ensure good quality.
- Timestep :0.5 to 0.1 microseconds.
- Run 80ms.
Output requests:
- Sectional force in the cross member.
- The intrusion at the B pillar, hinge pillar, and fuel tank region. Provide recommendations on what can help to reduce Fuel tank intrusion.
- Peak velocity of an inner node of the door.
Procedure
1) Check the unit system
Open the BEGIN_CARD to check the unit system.
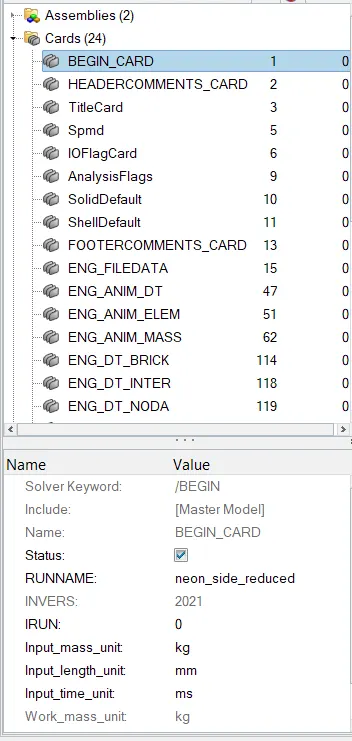
2) Check the intersections and penetrations
Go to Tools>Penetrations Check> Select the components
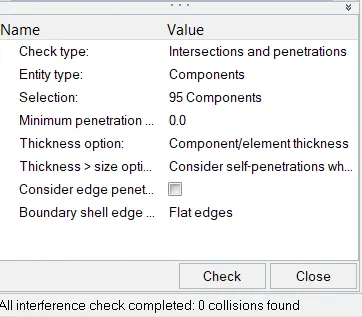
( There were no penetrations and intersections found in the model)
3) Interface creation
Create a type 7 interface for all the components of the model. Go to Solver>Create>Inter>Type7. Set the recommended parameters.
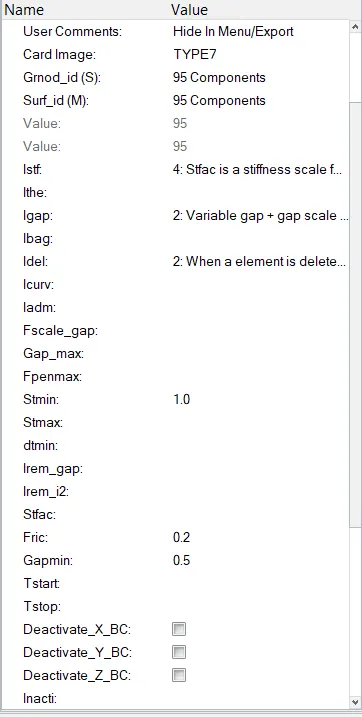
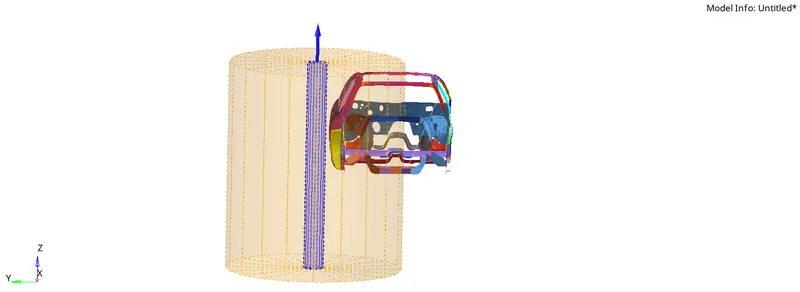
4) Rigid wall creation:
Create the outermost node on the side door of the car using the temp node option
Right-click on the solver browser and go to Create>Rwall>Cylindrical.
For the location of the rigid wall select the created temp node and provide some translation on the axis so that wall cannot touch the model. Define the normal in the Z-direction.
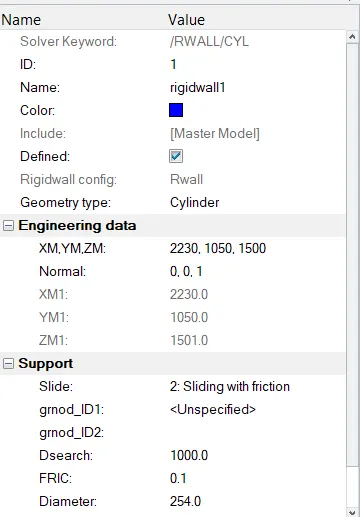
5) Mass Balancing
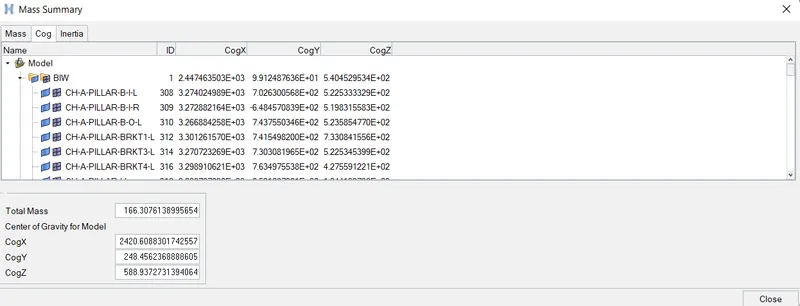
Go to Tools>Mass Details> Mass, Cog, and Inertia
Initially mass of the model is 166 Kg, in order to represent the scaled model into a full car model, the mass should be converted to 700 Kg.
Right-click on the Solver deck and create ADmas card to add mass to the model.
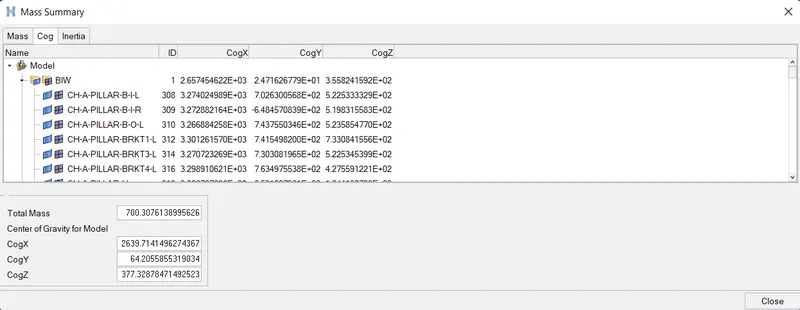
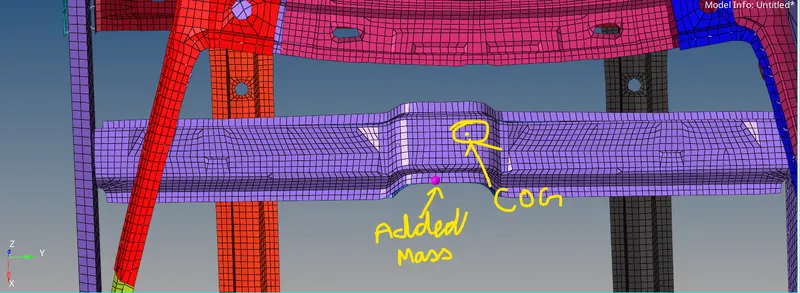
An additional mass of 51.2 kg is added so that the full car model is represented.
(Here COG is located exactly near the driver's seat)
6) Initial Velocity
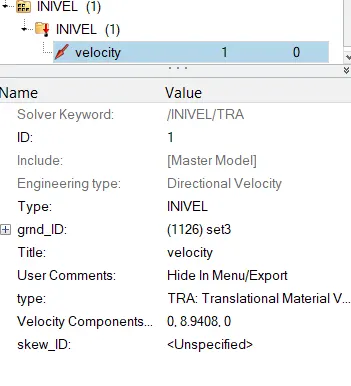
To create initial velocity right click on the solver browser and then navigate to Create>BOUNDARY CONDITION>INIVEL.
Under the INIVEL card select all the components as the entity for grnd_ID.
Specify the velocity of 8.9408 mm/ms in the y-direction.
Run Time and Time step:
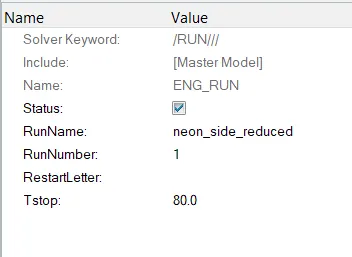
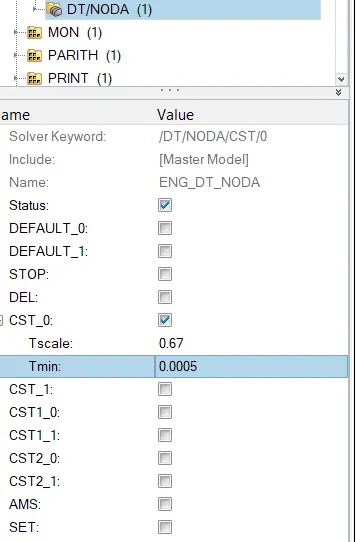
Go to Cards under Model browser, To check the run time open the ENG RUN card and set the Tstop as 80 ms. For the time step, open the ENG_DT_NODA card and change the Tmin value to 0.5 microseconds or 0.0005 ms.
Output requests:
Cross-sections:-
The results which we want on required cross-sectional parts will be calculated based on the frame of reference. So before creating cross-sections create the moving frame on a particular node of that section.
To create the moving frames right-click in the Solver browser and navigate to Create > FRAME> MOV. Select the nodes for the x-axis and XY plane and then click on create.
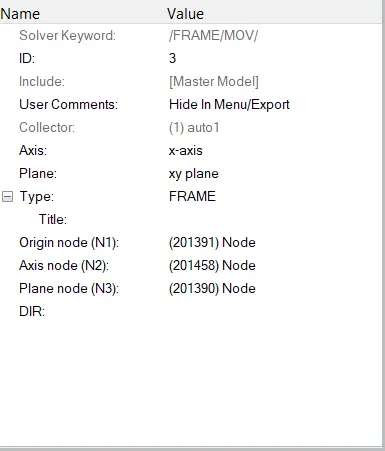
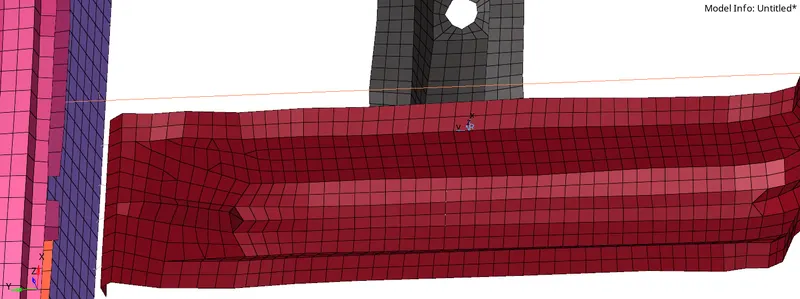
Thus a moving frame will be created. Now create the cross-section for this frame. To create a cross-section, right-click on the Solver browser and navigate to Create > SECT> SECT. In the section, the panel specify the Frame_ID as the moving frame, delta value as 0.1, and specify alpha as 0.628 Then select the elements for cross-sectional results
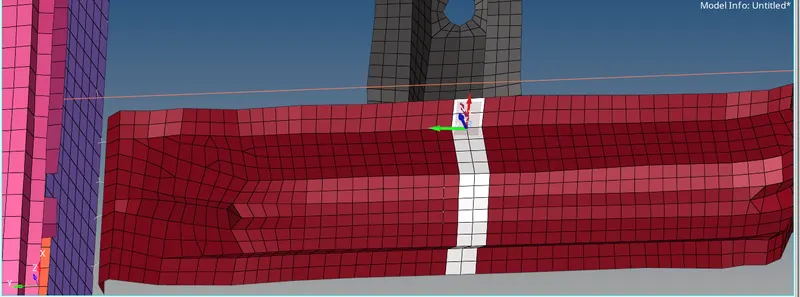
Similarly, create the cross-section at another cross member.
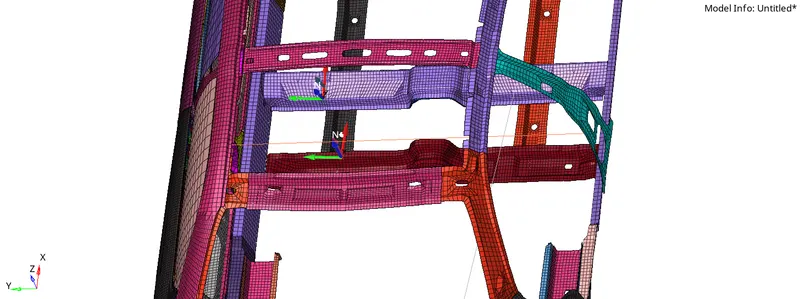
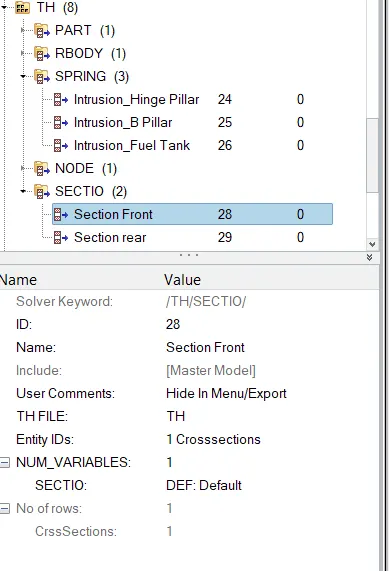
After creating the cross-sections, to request the results in TH or time history go to Output Blocks under the Model browser. Then right click and create a new output block. Under the Entity IDs option, select the cross-section created and thus we will be able to plot graphs of the cross-sectional forces in HyperGraph.
Intrusion -
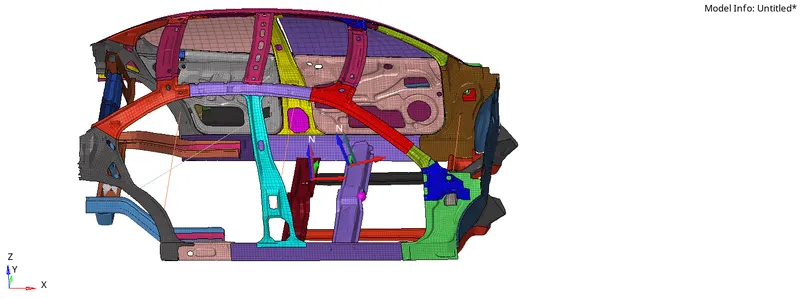
To calculate intrusion at B pillar,hinge pillar and fuel tank region create the 1D spring elements connecting the two nodes opposite to each other at these locations.
Go to 1D>spring>Select nodes and press create. Then make property card for spring and define the property to the elements.
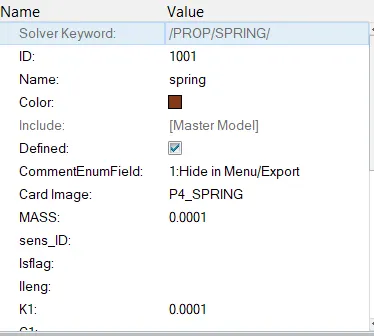
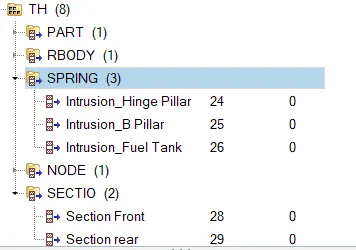
Then finally create the output blocks for the spring.
Peak velocity of an inner node of the door
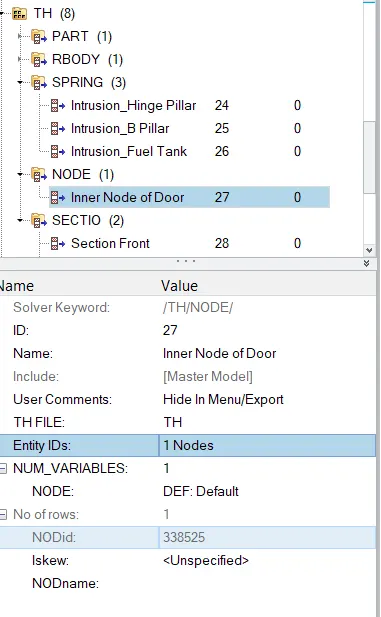
To calculate the Peak velocity of an inner node of the door select the node in the inner side of the door then creates its output block.
Model Checker:
Before starting to run the simulation, it is necessary to check for errors in the model. For this use Tools > Model Checker > Radioss Blocks.
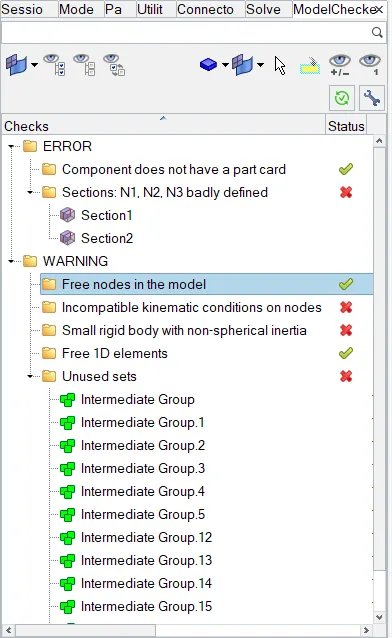
After running the checks, click on the Autocorrect command through which the software will automatically perform the possible corrections and give a green tick in the status bar From the above figure, we can ensure that the quality of the model is good for simulation. The error which says the nodes NI, N2, and N3 are badly defined, can be ignored as the sections are assigned to moving frames that are created separately. Other errors and warnings can also be ignored.
Simulation and Results
Now run the simulation Go to Analysis>Input file>Include connector>Options= -nt 4
Open. out engine file from the saved folder and check the final value of energy error, mass error, simulation time, and total no of cycles.
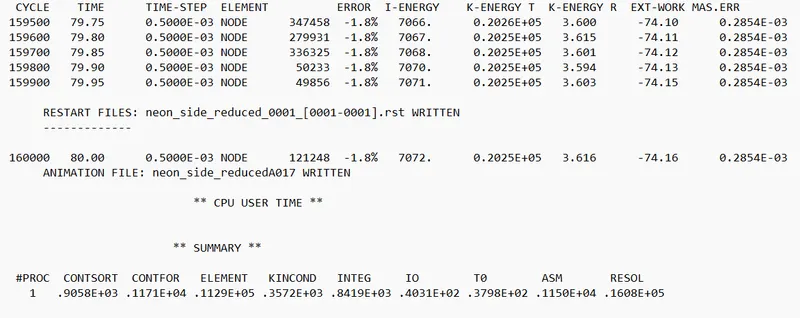
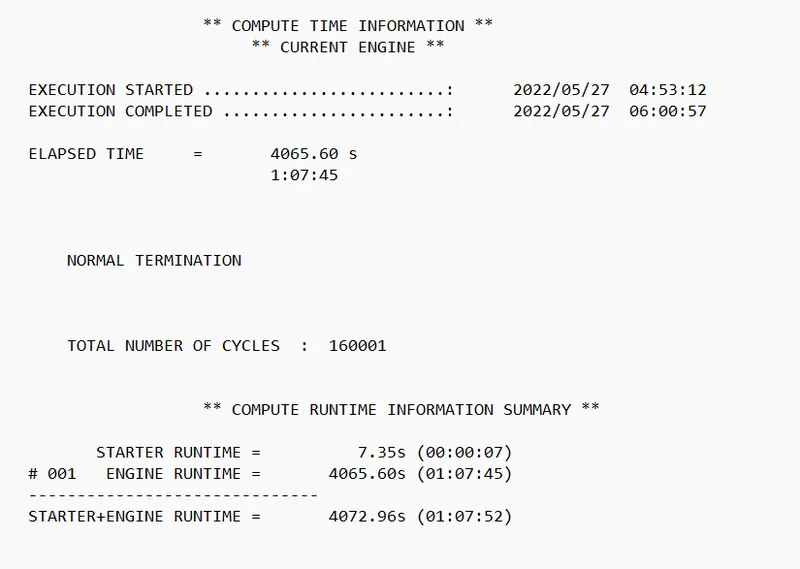
( In this case, the energy error is -1.8% and the mass error is 0.028% which are in the acceptable range)
Now Plot the required curves using Hypergraph 2D and the required animation using the Hyperview.
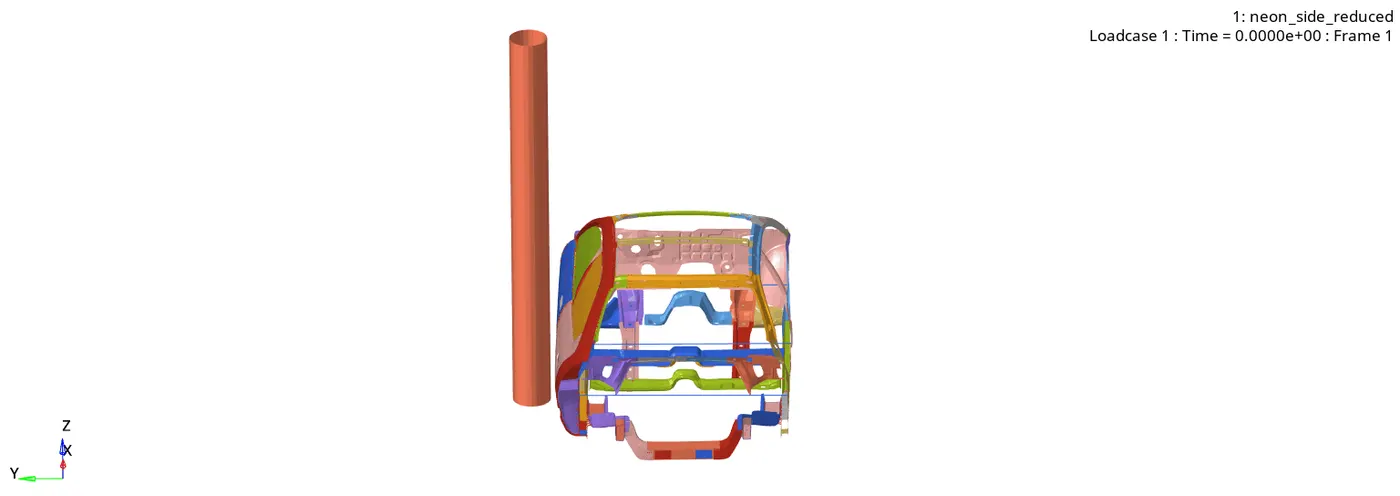
In the above crash simulation of the vehicle, we can see the vehicle body is impacting a Pole After the impact the frame of the vehicle deforms and the vehicle body gets contracted around the pole with the left B-Pillar as the pivot point. The CG of the vehicle is in the same axis or direction as the pole, so we can see even deformation of the frame around the pole.
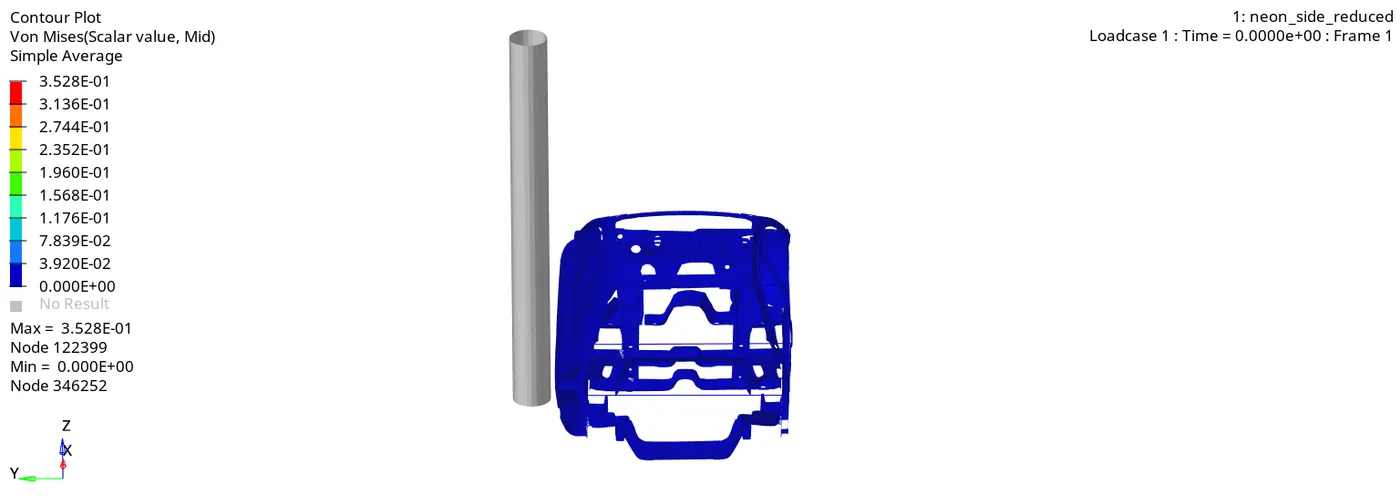
From the Von Mises stress plot we can say that the stress distribution is quite good in the vehicle after the crash. There are very few areas where we can see stress concentration. Generally, the stress is more in B- pillar and cross members as B- pillar takes the initial impact and then the impact is transferred to the cross members.
Energy curve
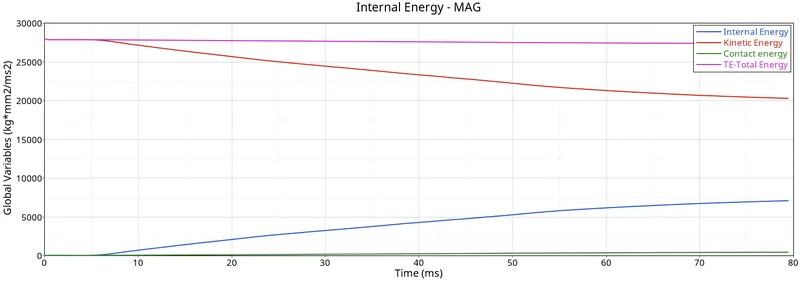
Observations:-
- The total energy is constant throughout the simulation.
- The kinetic energy is very high at the beginning of the simulation then after it gets converted into internal energy.
- Contact energy is generated because of the type 7 contact.
Cross-Sectional Forces
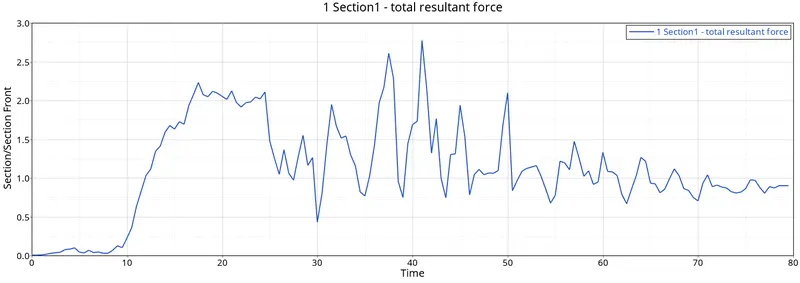
Front cross member
Rear cross member
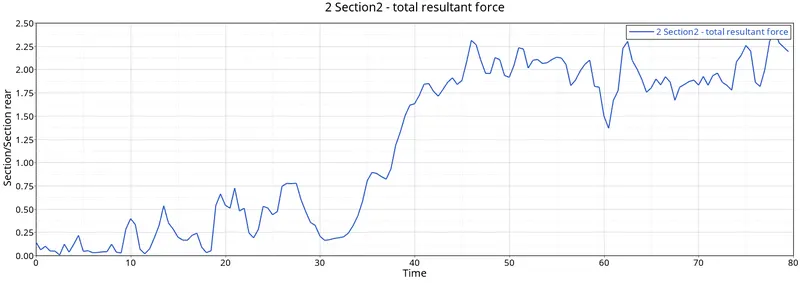
The resultant force on the rear cross member is more as compared to the front cross members.
Intrusion:-
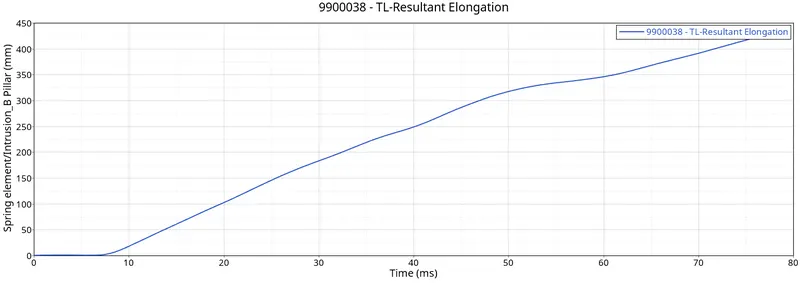
- At B Pillar
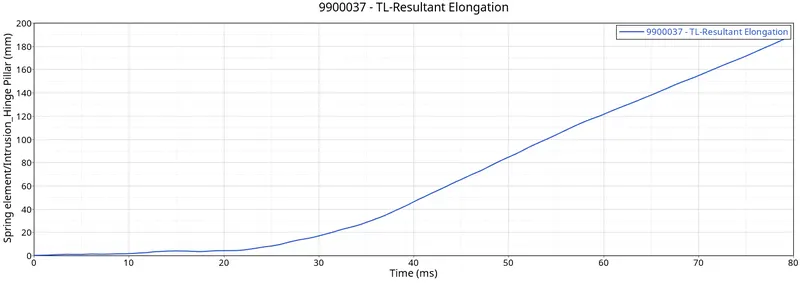
- At hinge pillar
- At the fuel tank region
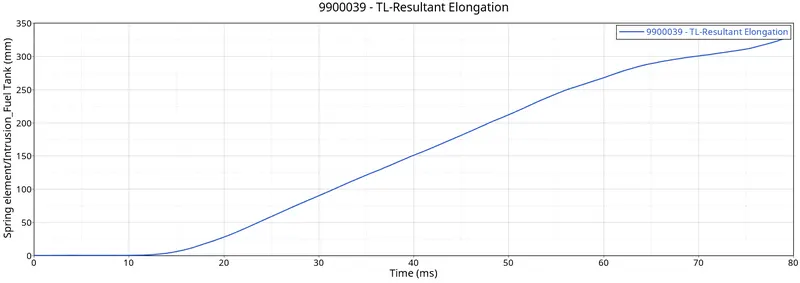
1D spring elements have been created to calculate the intrusion. The resultant elongation of the spring gives the value of intrusion.
Intrusion At B Pillar = 425 mm
Intrusion At hinge Pillar= 185 mm
Intrusion At fuel tank = 325 mm
In order to reduce the intrusion, we can achieve this by adding another cross member in the fuel tank region which can absorb some energy and resist the movement of the fuel tank region, and also the cross member can take some deformation Also we can increase the strength of the support element near the Fuel tank region by changing the material or by adding a small support bracket over that region.
Peak velocity of an inner node of the door
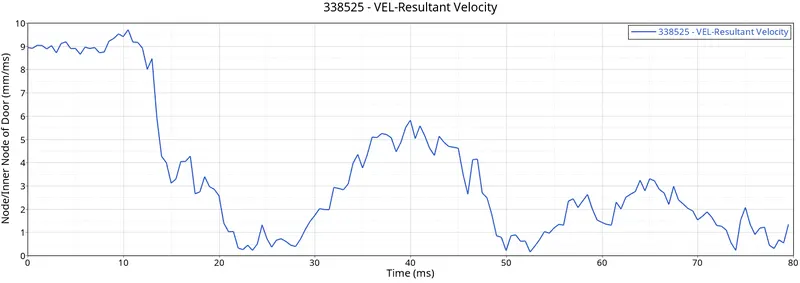
The peak velocity of the inner node of the door is close to 9 mm/ms initially after that velocity decreases and reaches up to 1 mm/ms at the end.
Conclusion:-
Thus, the model was simulated for a side pole crash test and the results were discussed. From the output file, the energy error and mass error are in the acceptable range so it concludes that the simulation is pretty stable. Results are not the most accurate even though the mass is balanced & COG is located at its exact position for more accurate results, it is advised to use a full-scale neon model for the simulation.