Assignment 7
objective:for the given assignment first made the model settings as per given in the questions and then run the simulation and then compare the results and plot the energy graphs and note the difference in the graphs.
procedure: 1.Import the given model and then check for thre unit system is in [kg,mm,ms] and then check the unit system using the begin card and change if not there in unit system.
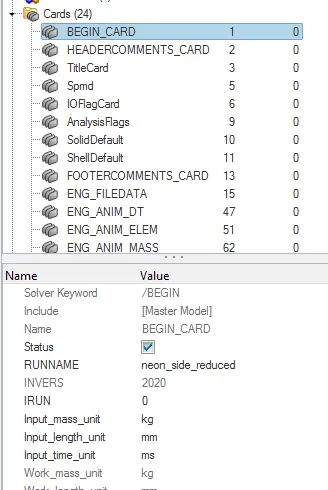
fig shows the begin card with the unit system
2.Create appropriate interface ,friction 0.2 and recommended parameters.
first go to the solver tab in that create the interface with the recommended properties and with the given friction value .
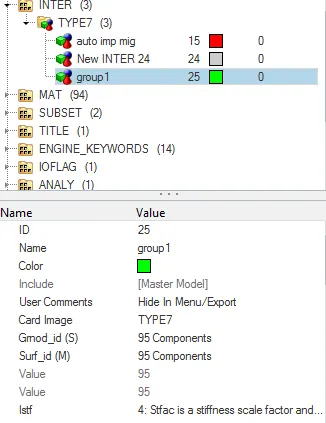
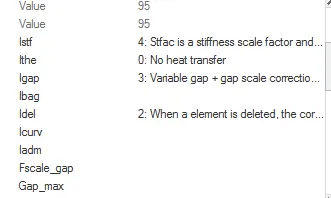
fig shows the interface craetaed with the recommended properties.
3.Make sure of no penetration and intersections.
first go to the tool command in that select the penetration and intersections option and then click on that to check the intersections and penetrations and if any fix by automatic or the manual option to be used.
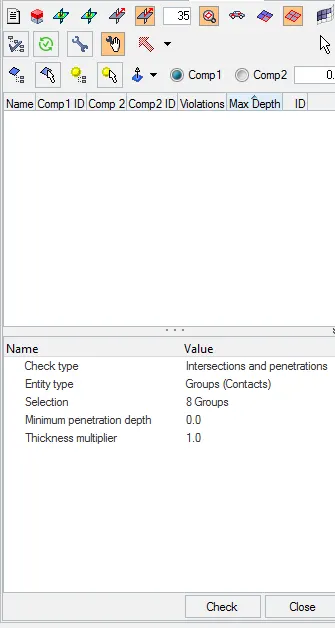
fig shows the check of no penetration and intersections.
4.Create rigid wall with friction 0.1 as per referance model.
first go to the solver tab in that select the rigid wall option in that select the type as cylinder and then select the axis xm,ym,zm with the diameter of the cylinder as the 254mm.
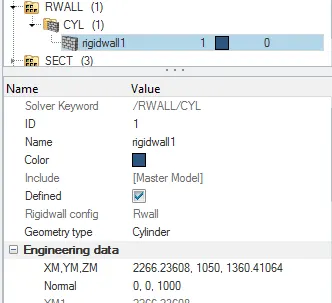
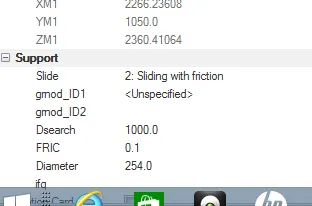
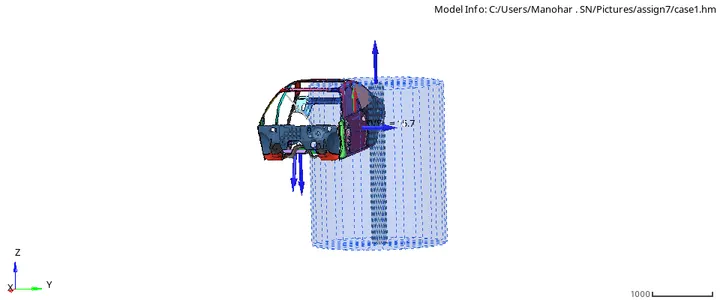
fig shows the creation of the rigid wall with the friction.
5.Compare the model weight with the referance model and use added masses to reach target weight 700kg while getting CG about the required range.
first go to the application>>hypercrash and then open the hyper crash and then import the model and then go to the mass balancing and balance the mass and the make the cog point to be visible and check the weight of the model using the mass option.
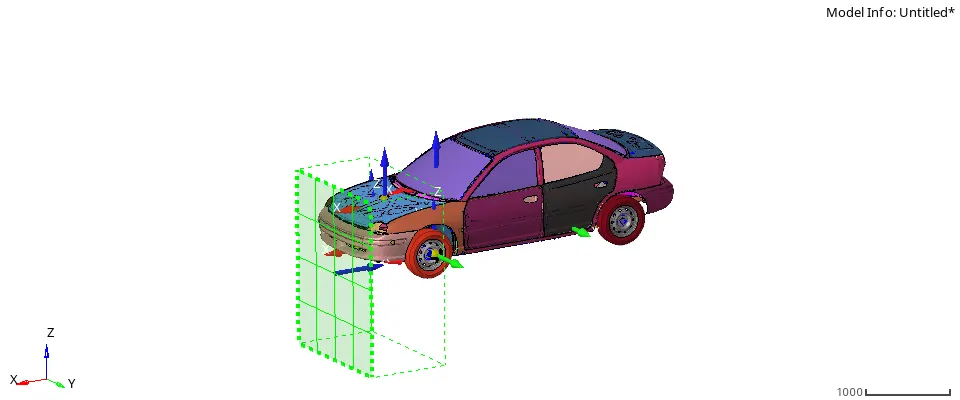
fig shows the full scale model .
In the hypermesh go to the solver tab in that create the add mass in that region selcect the nodes where want to add the mass in the particular region and then select the mass type as a zero and gmd id as the selected nodes and then add the mass after check the mass in the tool>>mass details and then add the remaining mass to the all the selected nodes i e remaining mass /no of selected nodes.
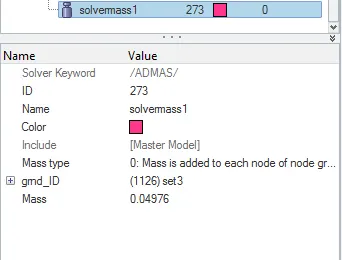
fig shows the mass details in the addmass tab
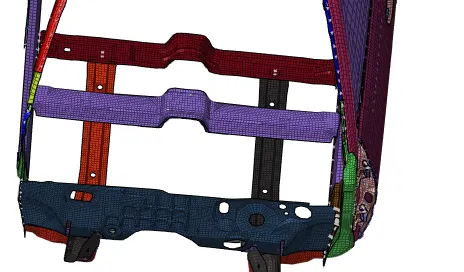
fig shows the location of the cog point
6.Initial velocity as shown in picture.
first go the solver tab in that select the intial velocity option in that give the velocity as the 15.64mm/sec as converted value in the Vy component that side crash occurs and gmd id as the select of the full components.
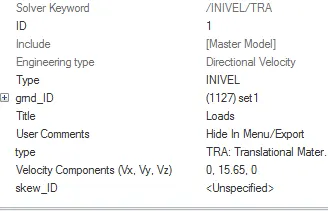
fig shows the velocity that is applied in the y direction.
7.Use model checker to ensure good quality.
In this first go to the tool command in that select the model checker that shows the errors and the warnings and the info tabs after that run the model checker if any errors or warnings is fix by auto fix or by the manual .
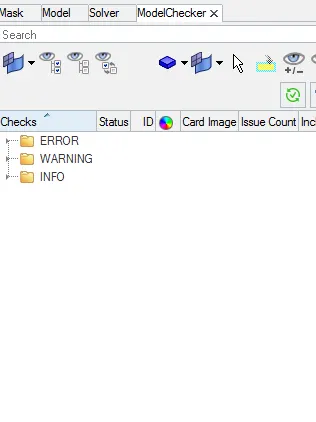
fig shows the model checker with errors and warnings
8.Timestep :0.5 to 0.1 microseconds.
In this first go to the eng dt/noda in that set the time atep value to the given value .
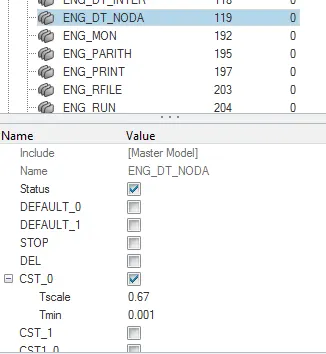
fig shows the time step value
9.Run 80ms.
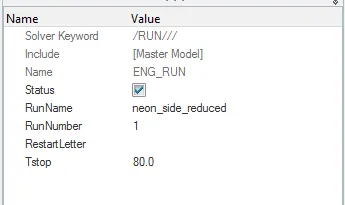
fig shows the running time for the model
output requests
- Sectional force in the cross member.
In this first go to the solver tab in that go to the section option in that create the cross section by select the two rows of elements and select the respective nodes as nodes n1,n2,n3 and delta value as the 0.1 and the alpha as 0.6 and then create the frame of reference for that particular node and then create the out put block for the two cross sections in that cross section to be selected.
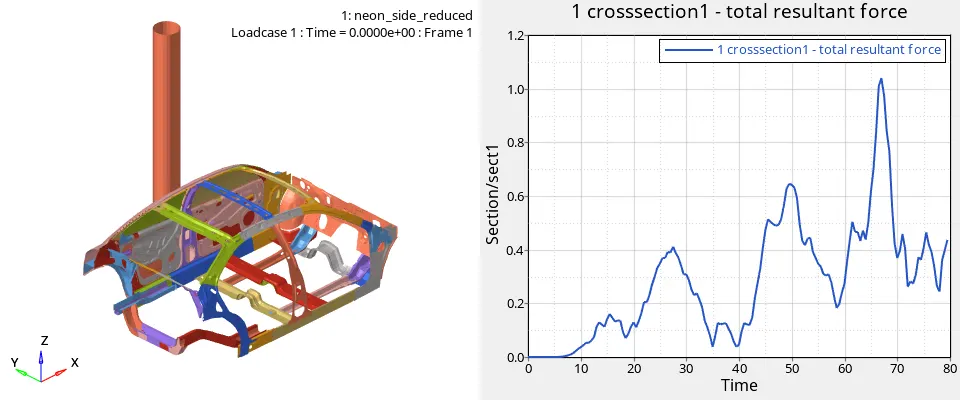
fig shows the max cross sectional force is that 1.05kn at the 68 m/sec
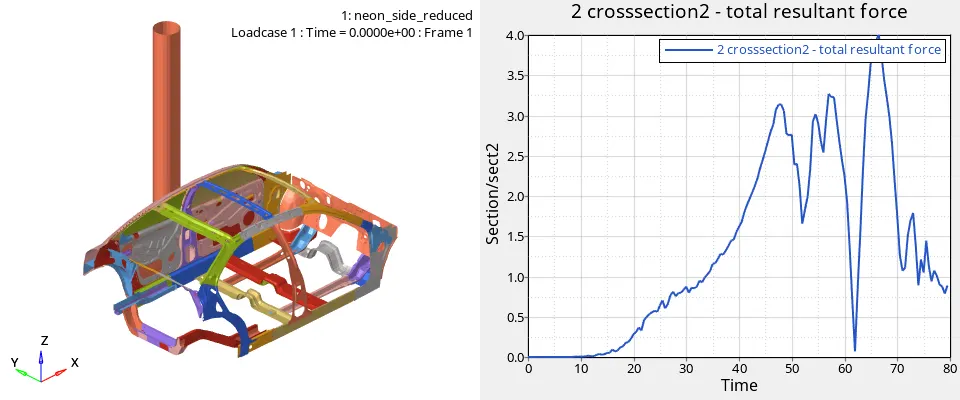
fig shows the max cross sectional force is that max of 4kn at the time of 68 m/sec
- Intrusion at B pillar,hinge pillar and fuel tank region.Provide recommendation on what can help to reduce Fuel tank intrusion.
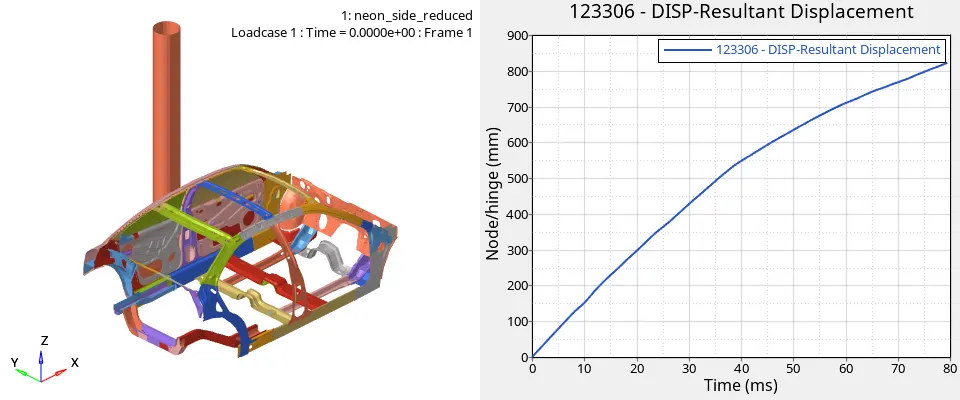
Intrusion at the hinge pillar is that at a distance of 840mm at the time of 78msec and also displacement increases with increase of the time
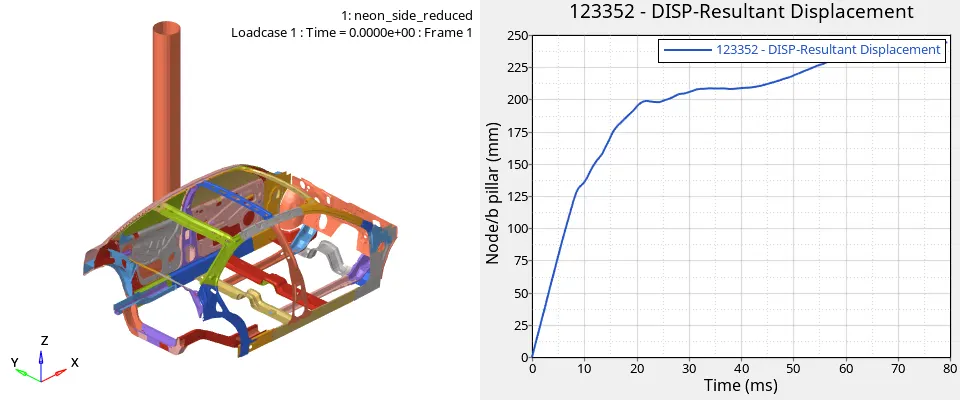
Intrusion at the b -pillar is that at a distance of 240mm at the time of 79msec and also displacement increases with increase of time.
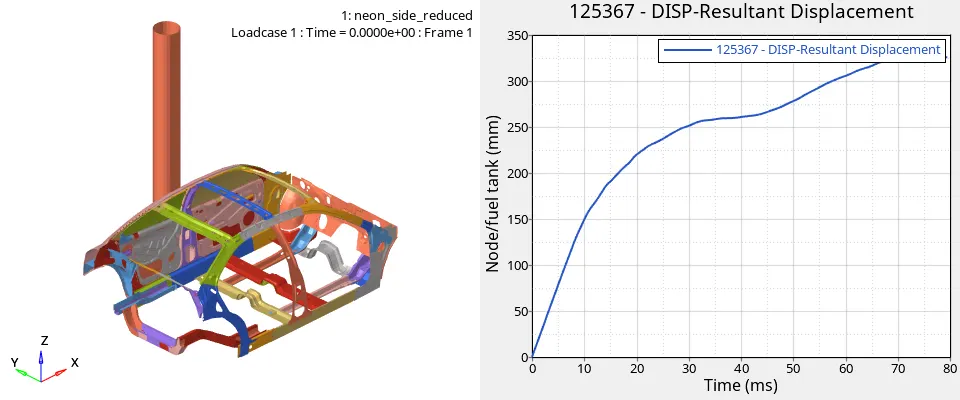
Intrusion at the fuel tank is that at the distance of 325mm at the time of 79msec and also displacement increases with increase of time
Increasing the side door strength by adding another anti-intrusion bar, we can reduce the amount of intrusion to the fuel tank. Also by adding another cross member near the fuel tank, we can reduce the intrusions.
- Peak velocity of inner node of the door.
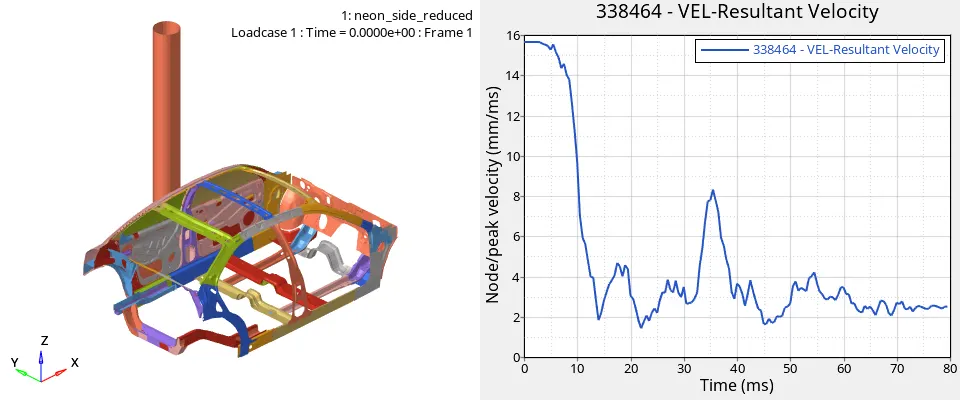
Peak Velocity is the highest velocity attained during the same concentric lift phase. Its a single point and will always be a much higher number then the mean.
The maximum peak velocity is of 8.2mm/ms at the time of 36msec.
Energy plots
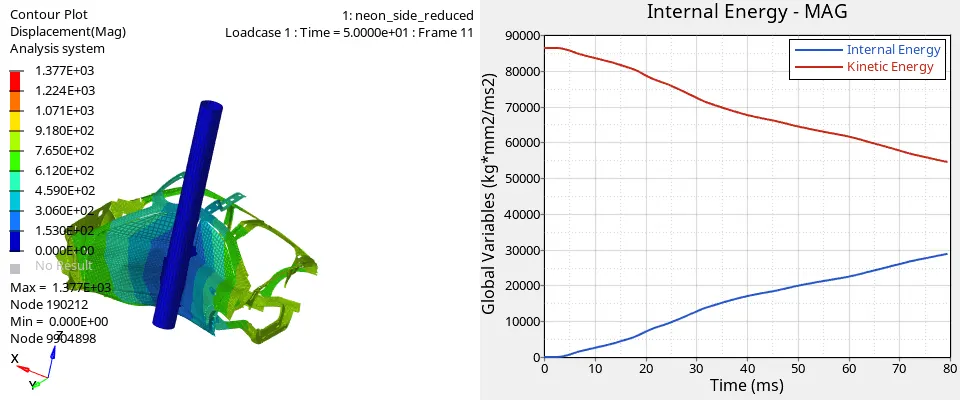
fig shows the internal energy increases with the increase of the time and kinetic energy decreases with the increase of the time due to the at intial the velocity increases and then at the last velocity decreases with increase of time.
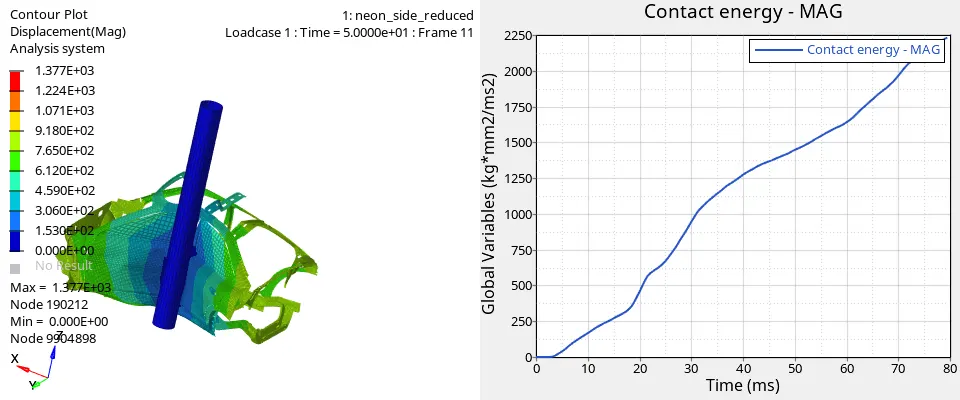
fig shows the contact energy increases with the increase of the time
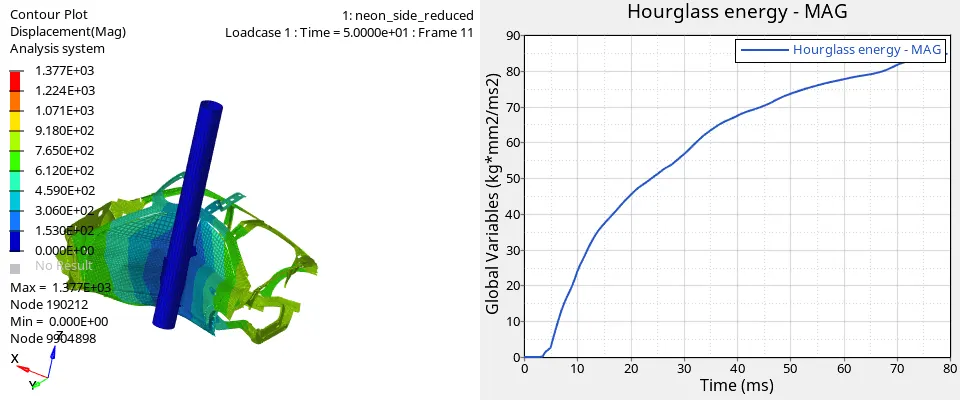
fig shows the hourglass energy increases with time and the displacement is max of 1.377E+03 at node 190212 and min of zero at the node 9904898
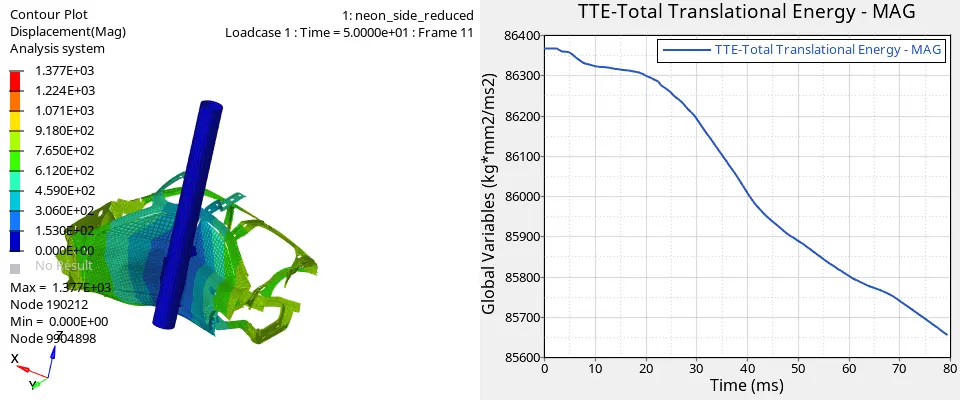
fig shows the total translational energy decreases with increase of time
Results
Time taken for the simulation:6267.00sec
Total no of cycles:80001
Energy error:-2.7%
Mass error:0.2892E+05
conclusion:
In this assignment learnt about the simulation of the side crash and the compare the results and the energy errors is discussed and the note the time taken and total no of cycles and the energy error and the mass error and the intrusions.