Assignment 6-Frontal Crash Simulation Challenge
AIM: To create deck setup for frontal crash of car BIW and request for Time History plots.
OBJECTIVE:
- Check unit system and either follow[Mg mm s] or [Kg mm ms].
- Create appropriate interface ,friction 0.2 and recommended parameters.
- Make sure of no penetrations and intersection.
- Correct rigid bodies if any issues.
- Create rigid wall with friction 0.1.
- Compare the model weight with the full scale 300k nodes model and use added masses to reach target weight 700kg while getting CG about the required range.
- Initial velocity 35 mph.
- Use model checker to ensure good quality.
- Time-step :0.5 to 0.1 microseconds.
- Run 80 ms.
Output requests:
- Sectional force in the rails at location of indicated node 174247.
- Axial force received on the rails from bumper.
- Shotgun cross sectional forces.
- A pillar cross section.
- Acceleration curve received on the accelerometer at base of B pillar (on B pillar rocker).
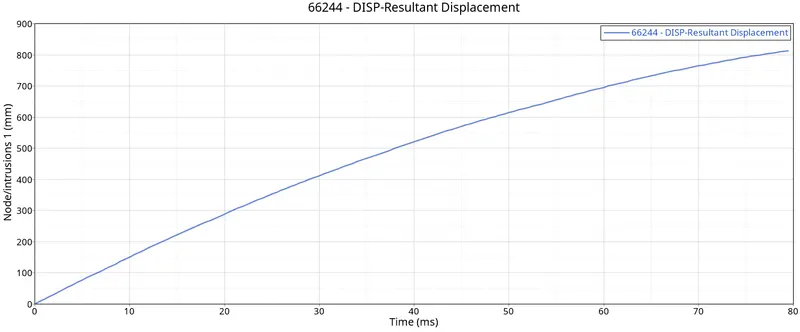
- Intrusions on the dash wall 66695,66244.
THEORY:
A crash simulation is a virtual recreation of a destructive crash test of a car using a computer simulation in order to examine the level of safety of the car and its occupants. which permits optimization of the design before a real prototype of the car has been manufactured. Using a simulation, problems can be solved before spending time and money on an actual crash test. The great flexibility of printed output and graphical display enables designers to solve some problems that would have been nearly impossible without the help of a computer.
During a crash simulation, the kinetic energy or energy of motion, that a vehicle has before the impact is transformed into deformation energy, mostly by Plastic deformation of the car body material, at the end of the impact.
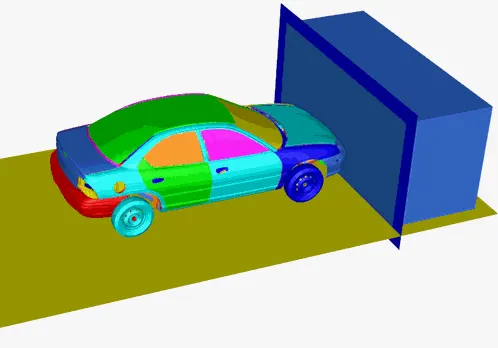
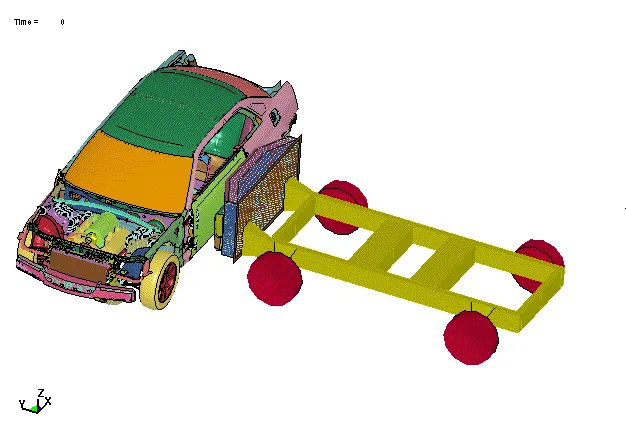
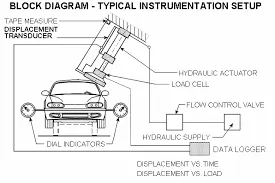
Crash simulations are used to investigate the safety of the car occupants during impacts on the front-end structure of the car in a "frontal impact", the lateral structure of the car in a “side impact”, the top of car by "roof crash impact" analysis.
Frontal impact:
Side impact:
ROOF CRASH IMPACT:
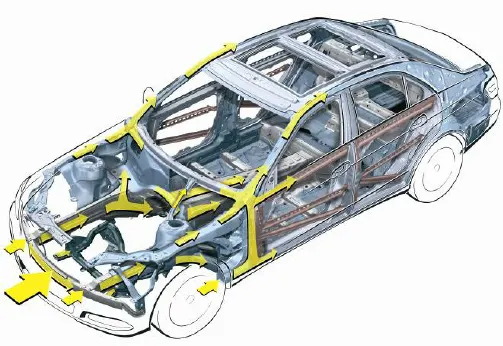
Distribution of forces:
Case set-up and execution:
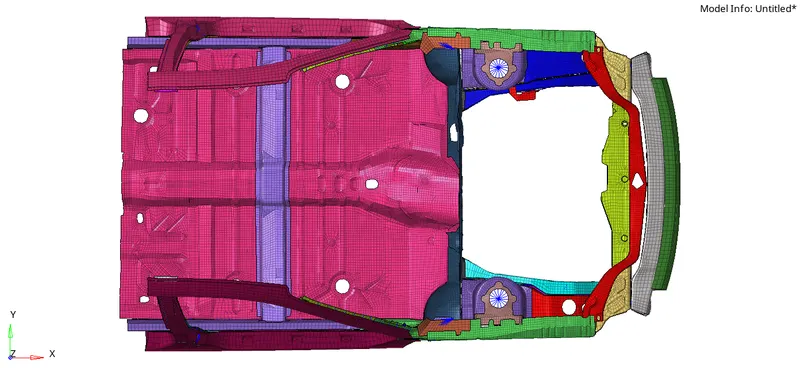
Import the given Neon_front_0000 file into hyperworks
The given model:
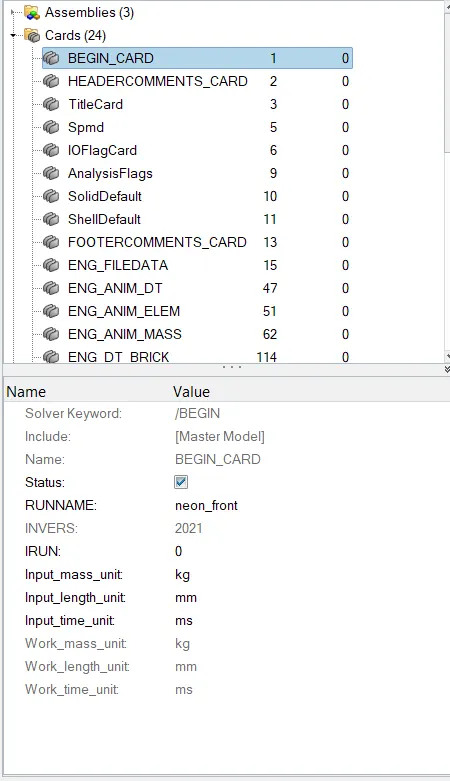
1. Check unit system and either follow[Mg mm s] or [Kg mm ms].
Go to Model Browser >>> Cards >>> Begin Card >>> Check for the units.
The unit system followed is Kg-mm-ms.
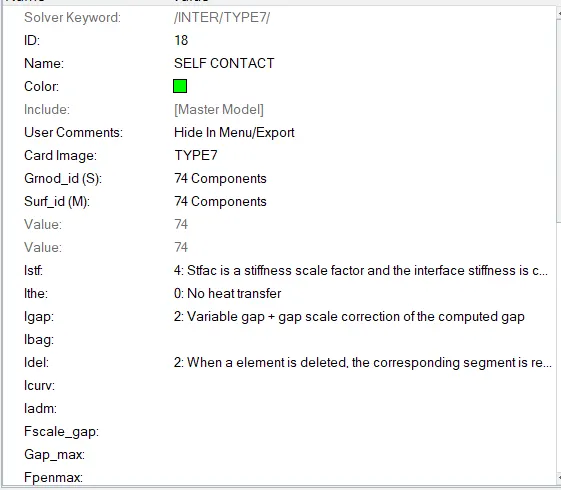
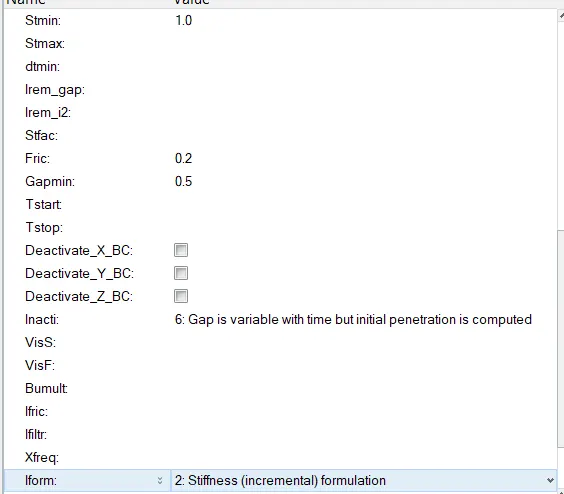
2.Create appropriate interface ,friction 0.2 and recommended parameters.
Type 7 contact is used with all recommended properties and with friction value of 0.2
For both slave and master, all 74 components are selected.
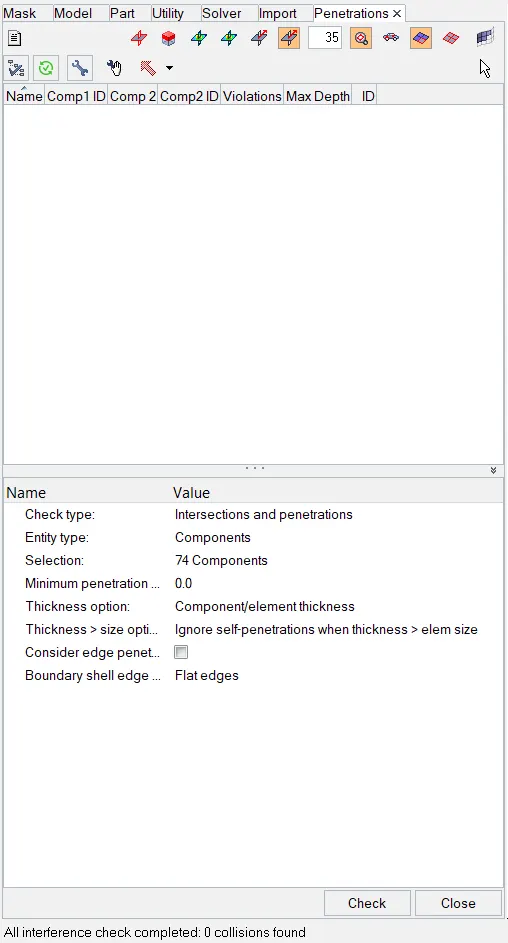
3. Make sure of no penetrations and intersection.
Go to Tools >>> Penetration Check >>> select check type as Intersections and Penetrations >>> Select all components >>> Check
The outpue result is: All interfaces check is completed: 0 collisions Found.
4.Correct rigid bodies if any issues.
As there are no penetrations and intersections, there is no issue with rigid bodies.
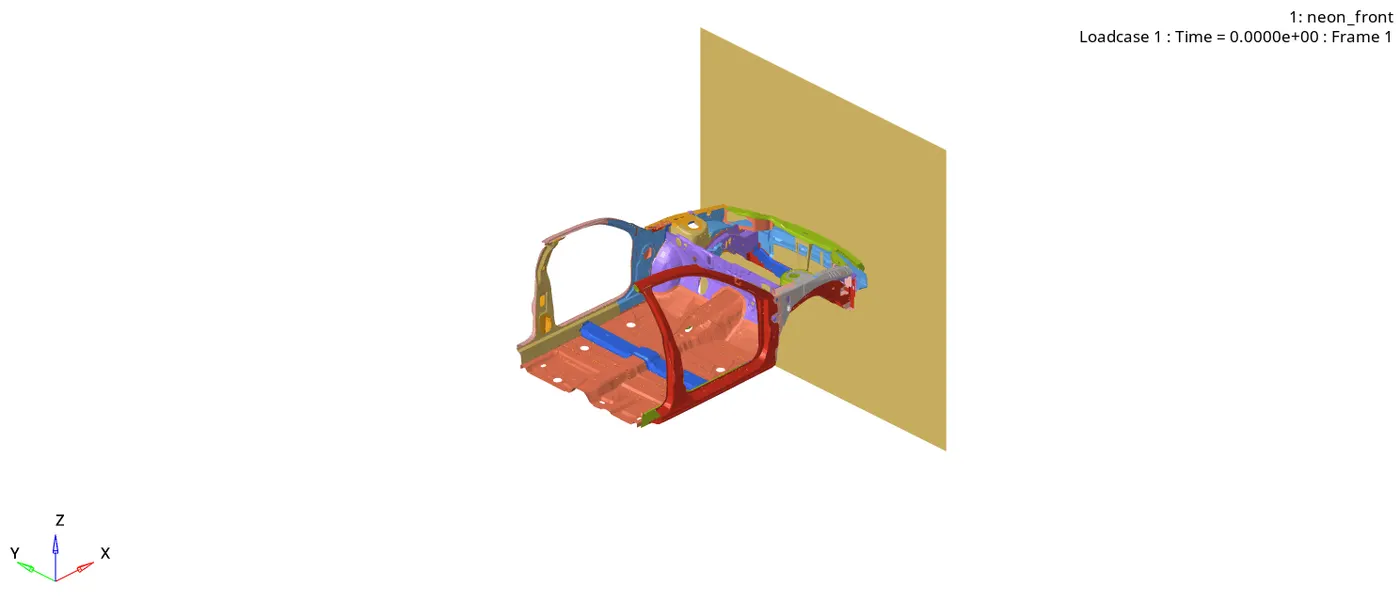
5. Create rigid wall with friction 0.1.
Go to Solver deck >>> Right click >>> create >>> Rwall >>> Plane
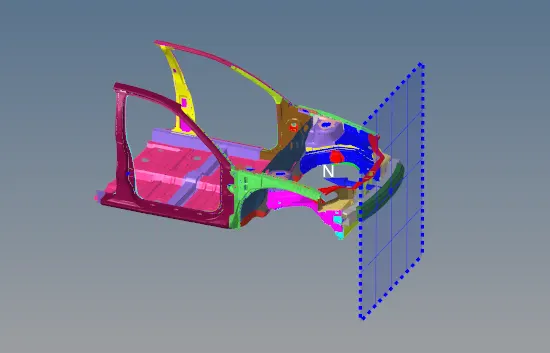
Select any node on the bumper and change the x-cordinate such tht a gap is maintained.
Prove the sliding friction with value of 0.1
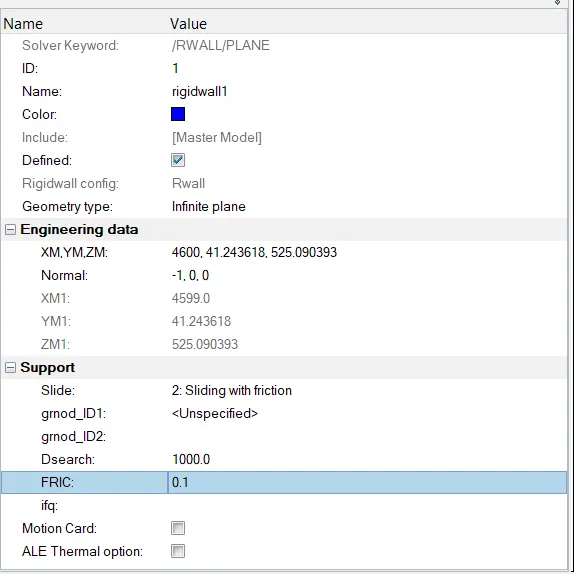
The Rigid Wall is shown below:
6. Compare the model weight with the full scale 300k nodes model and use added masses to reach target weight 700kg while getting CG about the required range.
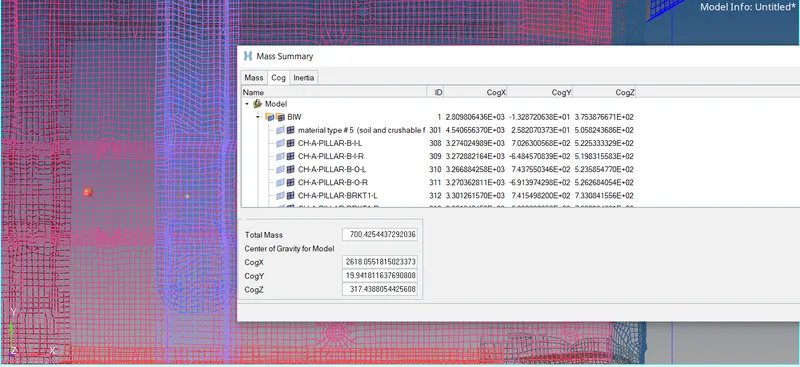
Check the mass and COG point:
Go to tools >>> Mass details >>> Mass, COG and inertia
Initial mass is 180 Kgs and Cog point is not desirable.
Add mass in the form of seat and dummy to get 700 kgs and desirable COG point.
Go to solver deck >>> Right click >>> ADMAS >>> Select the nodes on which the mass should act >>> Provide the value of mass.
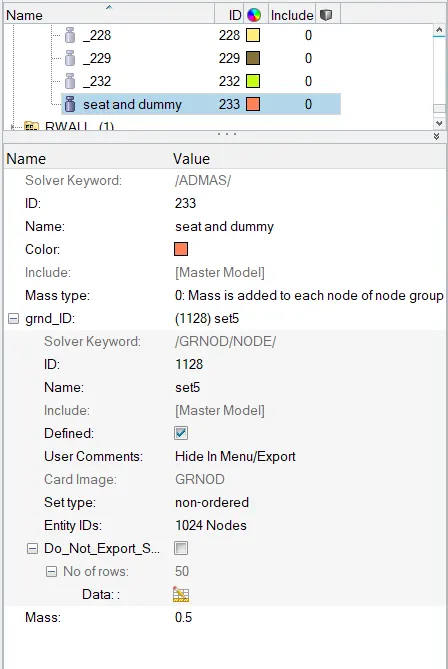
The yellow point is the COG which is at center of Seat connector pillar.
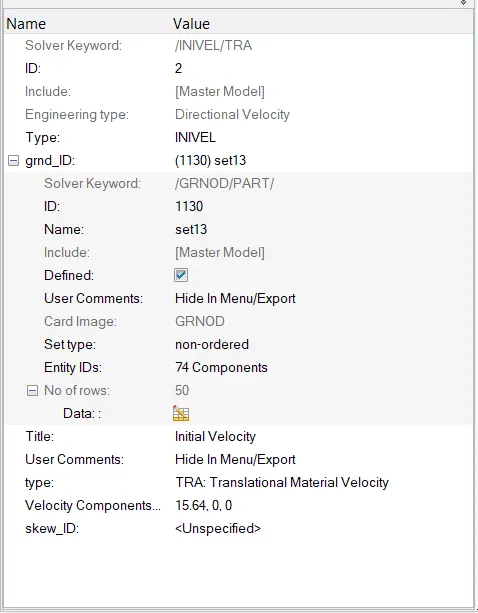
7. Initial velocity 35 mph.
Go to Solver deck >>> Right click >>> Create Inivel >>>Select all components and provide the value of velocity.
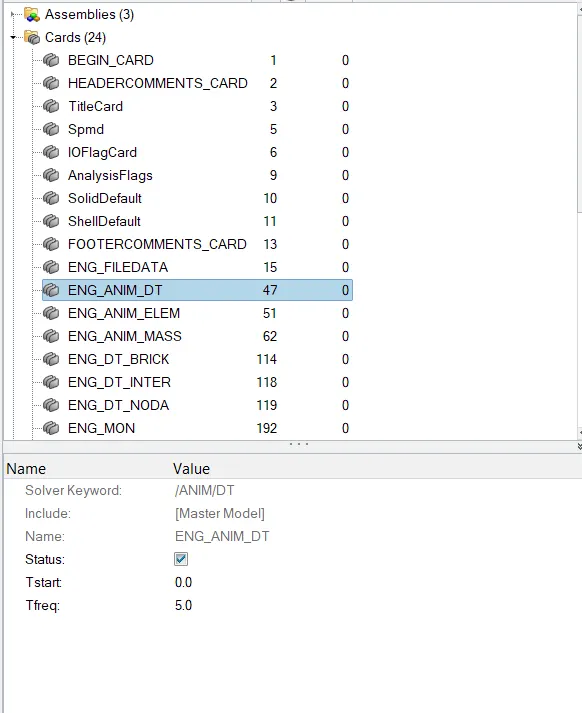
8. Time-step :0.5 to 0.1 microseconds.
Model browser >>> Cards >>> Anim_Dt >>> Tfreq = 5.
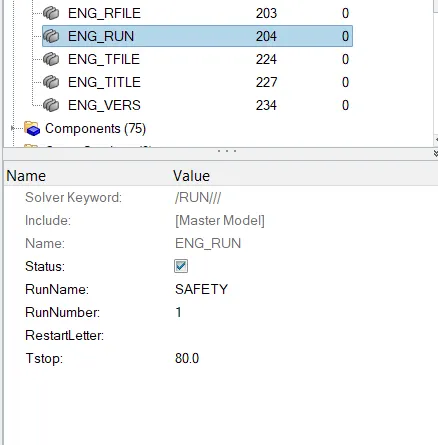
9. Run 80 ms.
Model browser >>> Cards >>> Eng_Run >>> Tstop = 80.
OUTPUT REQUESTS:
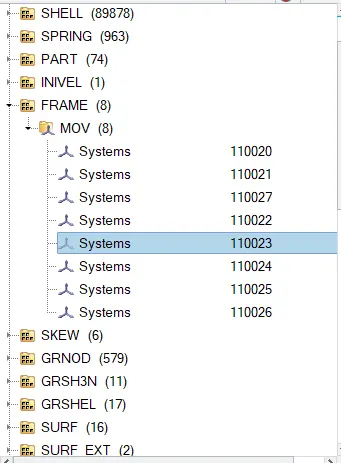
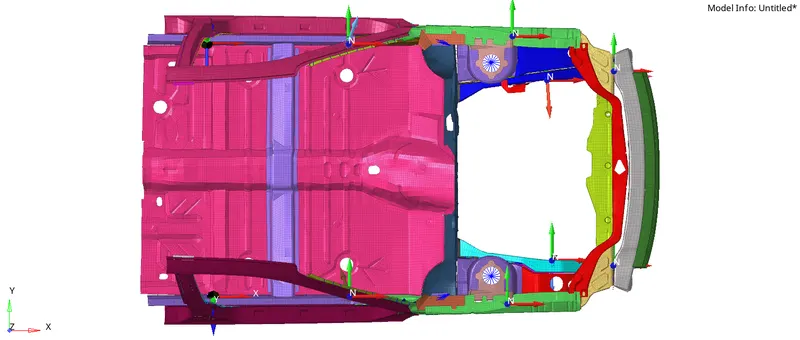
Create frames at each cross-section where forces are to be calculated.
go to solver deck >>> Right click >>> Create Frame >>> select N1, N2, N3 such that N1 and N2 are making x-axis and N3 x-y plane.
Create Sections at which cross-sectional forces are to be determined.
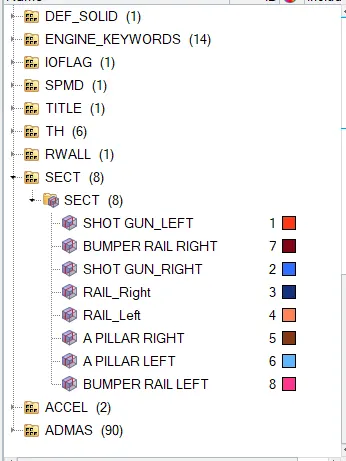
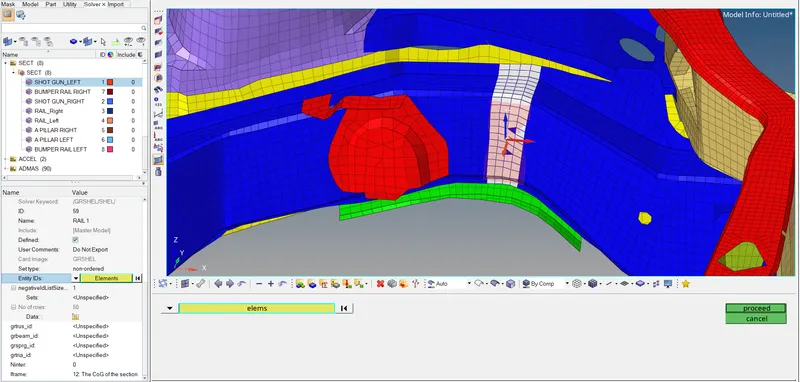
Isolate the respective component and create the section by selecting the respective elements and choose the respective frame in the frame id and set iframe = 12, the cog of the section.
Repeat the same at both sides of Shot gun, Bumper Rail, Rail component and A-pillar.
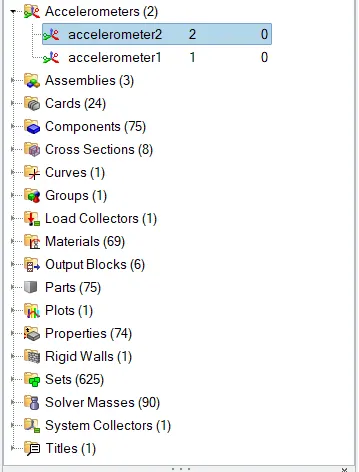
Acceleration curve received on the accelerometer at base of B pillar
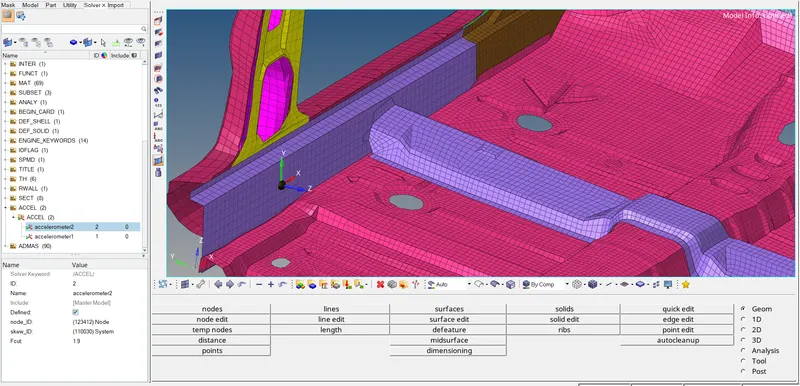
Create Accelerometer by right clicking in model browser.
Go to solver deck >>> ACCEL >>> Select the node and provide Fcut= 1.9.
Intrusions on the dash wall 66695,66244.
Create the Skew on Seat connector frame on either end as shown.
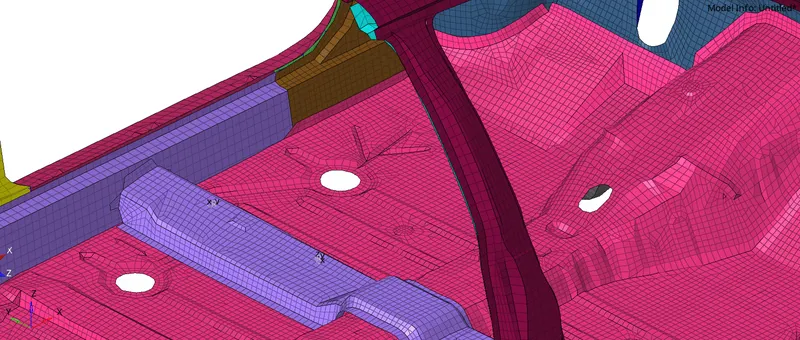
Create output block >>> Name it Intrusion and select the node by Node id as shown and select the respective skew.
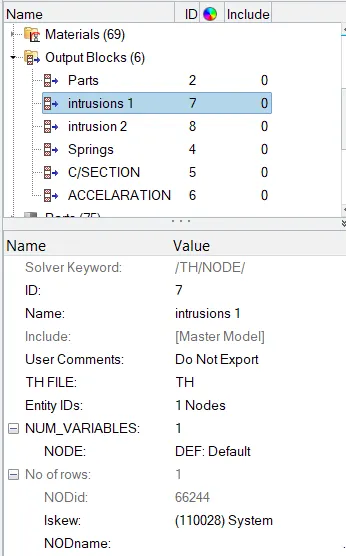
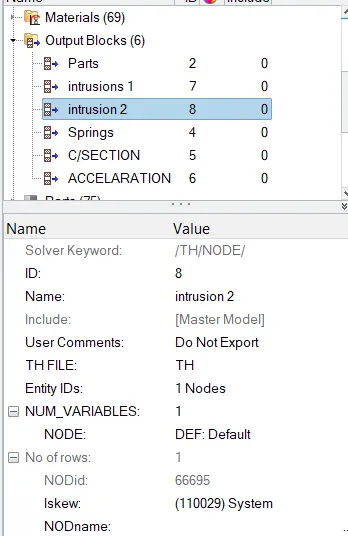
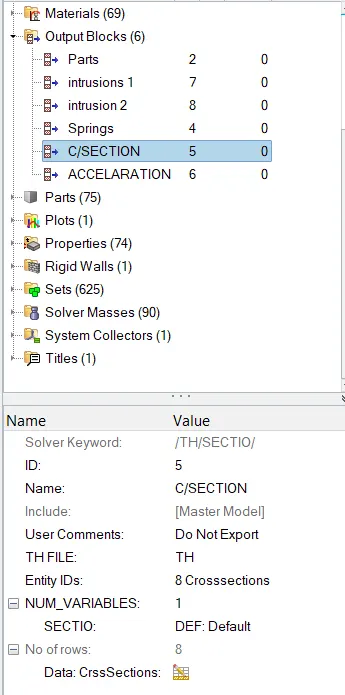
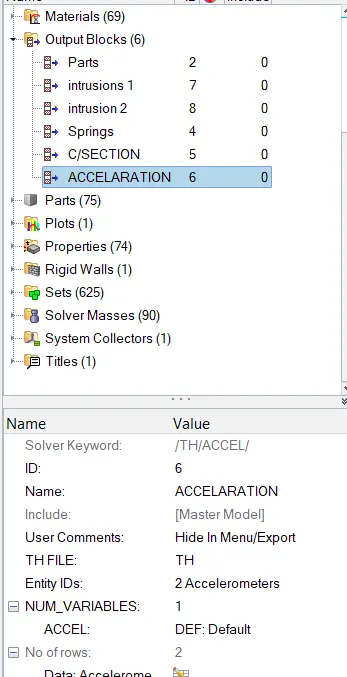
To get the special time history files,One must create output blocks and assign thier respective cross-sections or accelerometers.
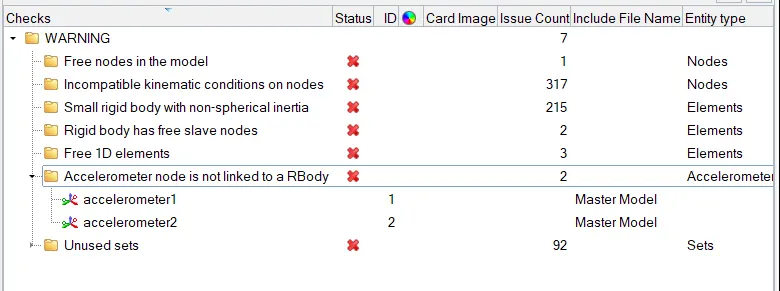
Use model checker to ensure good quality:
There are no errors in the model so we can proceed to the simulation
Results:
Go to Analysis >>> Radioss >>> Save the file >>> Include connectors >>> Prove the number of threads in options >>> Run.
Open Hyper View >>> Import the H3D file
The Animation is shown below:
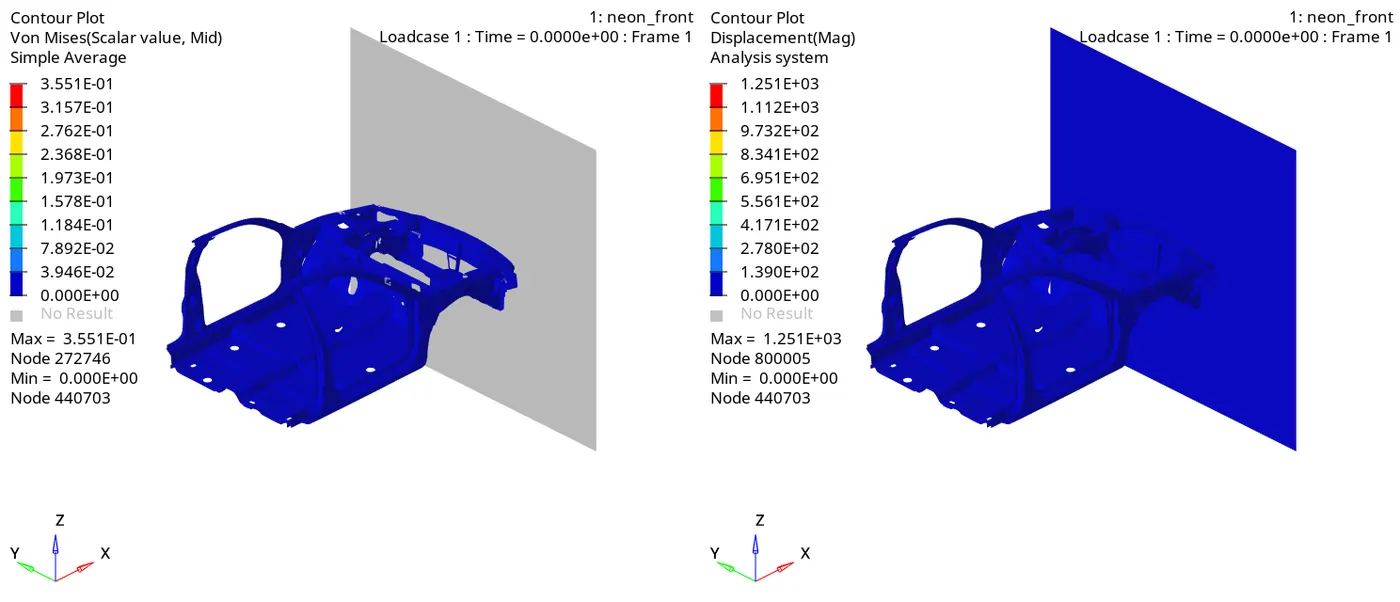
The Von-Mises stress and the displacement Contour is shown below:
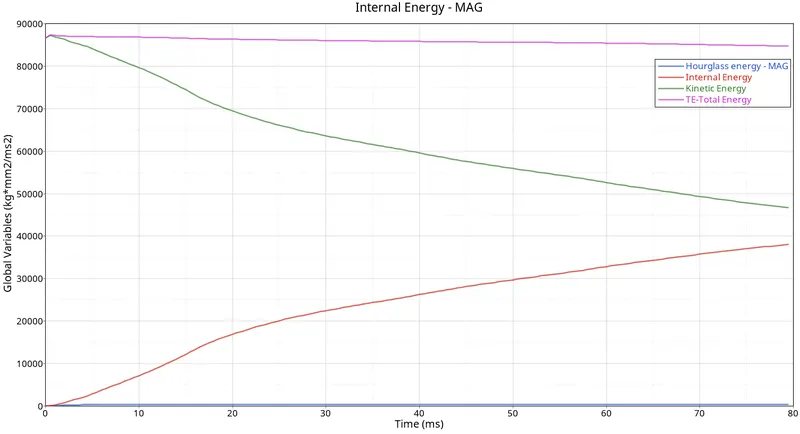
The Energy error, Mass error, Internal, Kinetic energy are shown below from 0.001_out file.
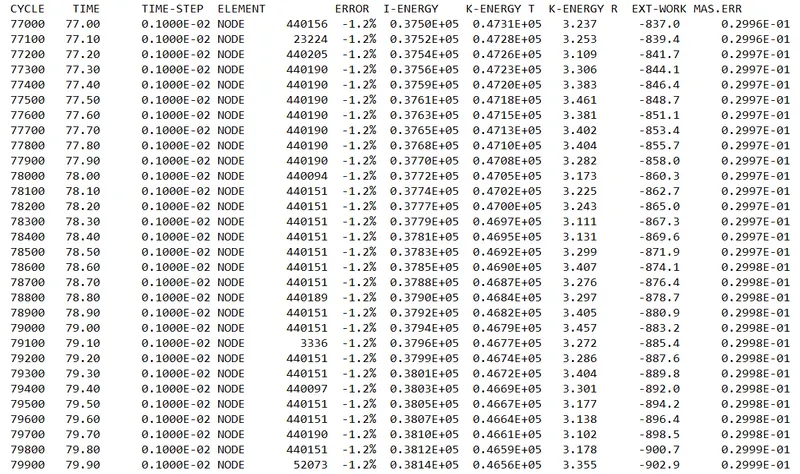
The Energy error is -1.2% and mass error is 0.03% which is acceptable.
The mass error is due to adding of mass for maintaining te time step value.
the maximum kinetic energy = 86970 Joules and minimum = 46560 J
the maximum internal energy = 38140J and minimum = 146.5J
We can see at the start of simulation the internal energy is minimum and K.E is max, as the deformation is taking place Internal enrgy increases and kinetic energy decreases thereby maintaining the total energy as constant.
The elapsed time, Number of cycles, Total run time is shown beow:
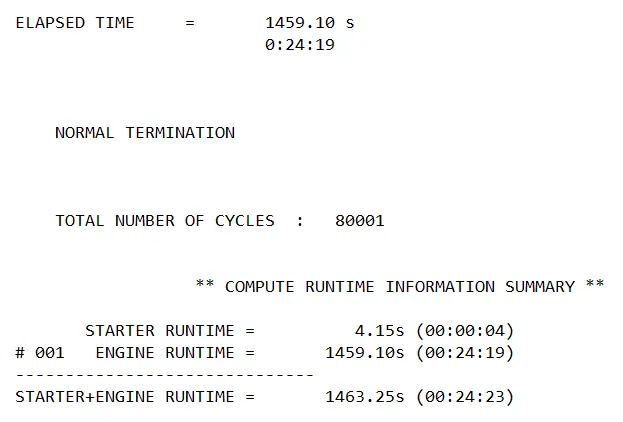
The time taken for the simulation = 1463.25 seconds
number of cycles = 80001.
Go to Hypergraph_2D >>> Import the T01 files
Graph below shows the Internal energy, kinetic Energy, Hourglass energy, total energy
Hourglass energy is less than 4% of total energy and is stabilized by using the recommended properties.
We can see at the start of simulation the internal energy is minimum and K.E is max, as the deformation is taking place Internal enrgy increases and kinetic energy decreases thereby maintaining the total energy as constant.
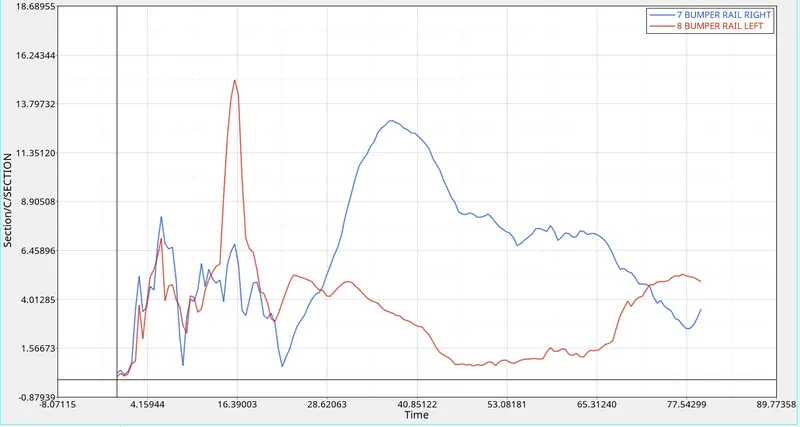
Sectional forces on the bumper rail bracket:
The maximum force on the left bracket = 14 kN.
the maximum force on the right bracket = 12 kN.
Initially, there is no axial force is transmitted from bumper to rail. Once the vehicle hits the rigid wall, Bumper starts deforming and transmits the strain energy to the rail section.
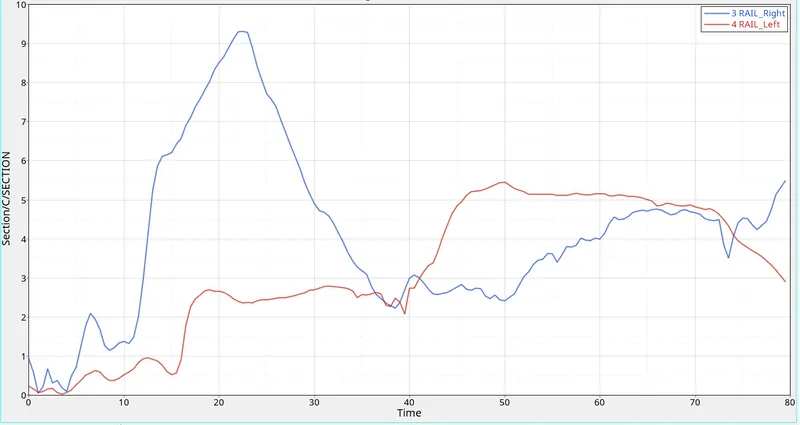
On rail component:
Maximum c/s force on the left rail = 5.5 KN
Maximum c/s force on the Right rail = 9.3 KN
the force acting on the rail is transmitted by the bumper. The deformation takes place by rail and is transformed to other components thereby decreasing the c/s force w.r.t time.
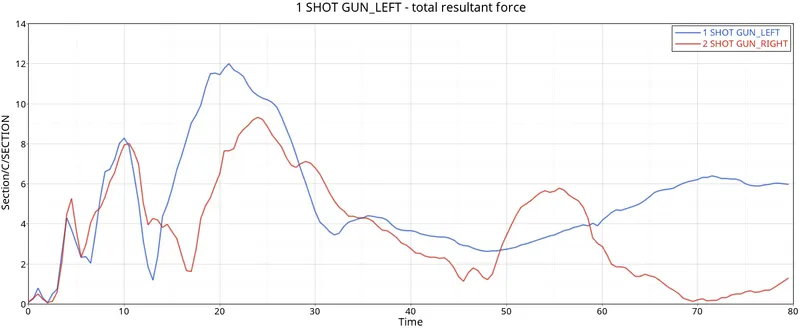
On Shotgun component:
The maximum c/s force on the left shotgun = 12KN
the minimum c/s force on the right shotgun = 9.3 KN.
The force that occuredat the shotgun is the force transmitted from the rail section. the force propogation on either ends are different causing different deformation.
Once the compressive forces reaches the max value it starts to deform rapidly. therefore, the compressive force is decreasing as reffered.
As crash happens continously, the shotgun will come into contact with rigid as shown in anime, the rigid wall also exerts the force directly on the shot gun and there is an increase in sectional force as sen in the graph.
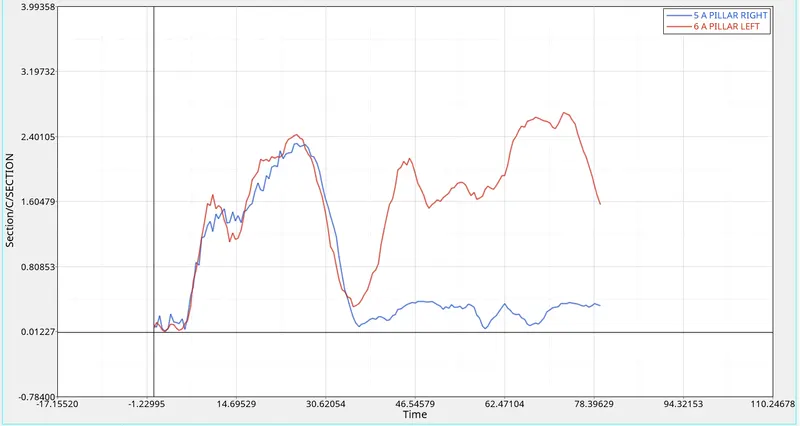
On A-pillar component:
The maximum force at the left c/s of A-pillar = 2.8 KN/mm, The maximum force at the right c/s of A-pillar = 2.3 KN/mm.
When crash happens, There will be some amount of force i.e., transmitted onto both ends of A-pillar. These forces are transmitted from the Rail component and shotgun component. Therefore the force at A-pillars is less than the Rail and Shotgun Component.
The force flowing on either ends are not equal and deformations are also not the same.
When the compressive force Between the wall and car is maximum, the rail and shot gun will get in contact with rigid wall which causes the shotgun and rail to exert more force. This force then propogates through A pillar and hence the force reaching the the A-pillar is increasing again.
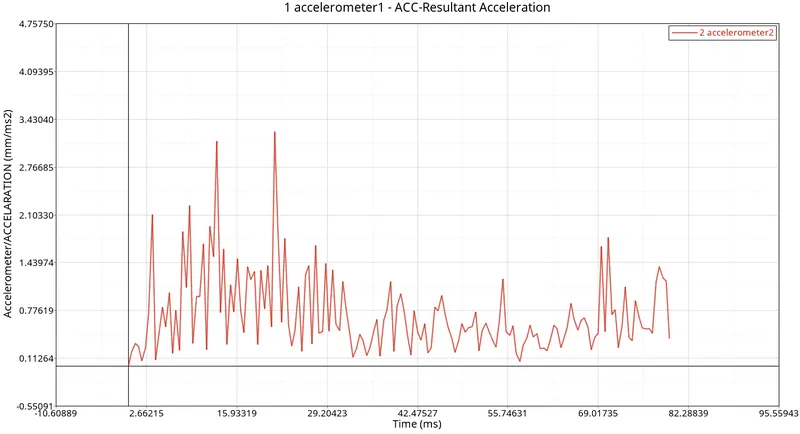
Accelerometer:
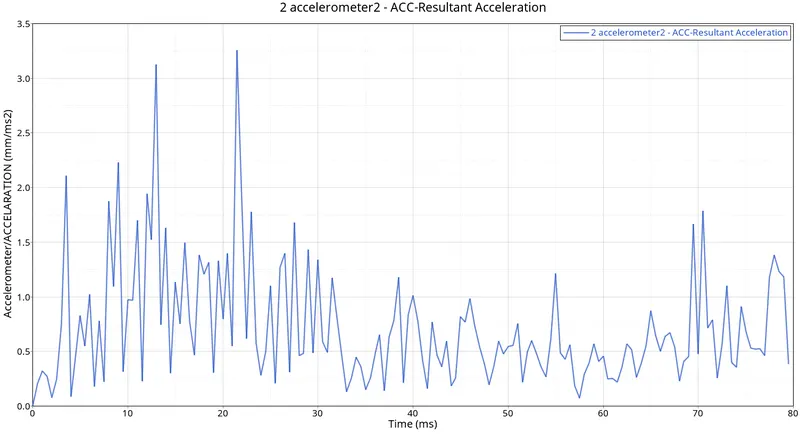
Accelerometer is placed on the either ends on rocker of B-pillar.
From the graph we can see that initially the acceleration is almost constant before crash. once car hit the rigid wall with initial velocity, the acc of vehicle during crash is not constant across the structure.
The front of the vehicle slows down immediatly as it hits the rigid wall, while the rest of structure deccelarates at slower rate
As seen there is sudden increase because of vibrations that occur during crash w.r.t point where accelerometer is place.
The maximum acceleration at left = 3.2 mm/s^2
The maximum acceleration at right = 3.25 mm/s^2
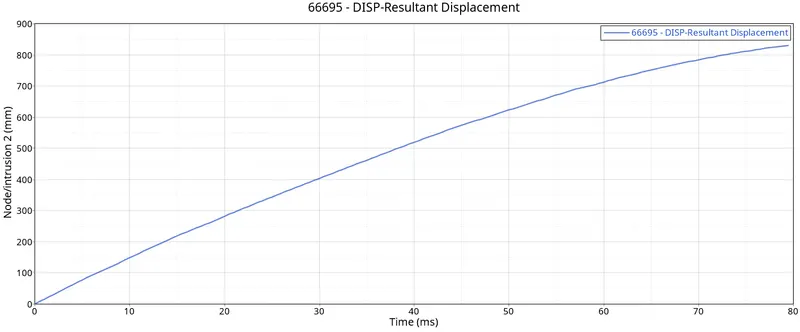
to check the intrusion of the dashwall at the particular nodes, we have created the skew and selectedthe particular node. The intrusion at this particular node is calculated in order to check whether crash will result in the safety of driver due to deformation that occured in the Component.
On the node 66695, The intrusion is 835 mm and on node 66244 is 815 mm
Practically this elongation referred to what extent the foot pedal will mov once the crash happens.
Learning Outcomes:
1. Learned how to set up a frontal crash test.
2.Learned how to create rigid wall, To generate sectional forces,.
3.Learned How the forces are distributed during the Frontal crash.
4. Learned how to check energy, mass and momentum balance
Conclusion:
The graphical results were plotted for all test cases.
From simulation it is observed that There is minimum deformation in the cabin, and minimum intrusion was found in the drivers seat area.