Assignment 6-Frontal Crash Simulation Challenge
AIM: The main aim of this challenge is to study the load path and intrusions in case of frontal crash analysis.
OBJECTIVE: The objectives of this challenge are as follows:
1. To create required interfaces and rigid wall.
2. To add mass to the model to reach target of 700kg and maintain the CG about required range.
3.To create sections and springs to measure load path and intrusions.
PROCEDURE:
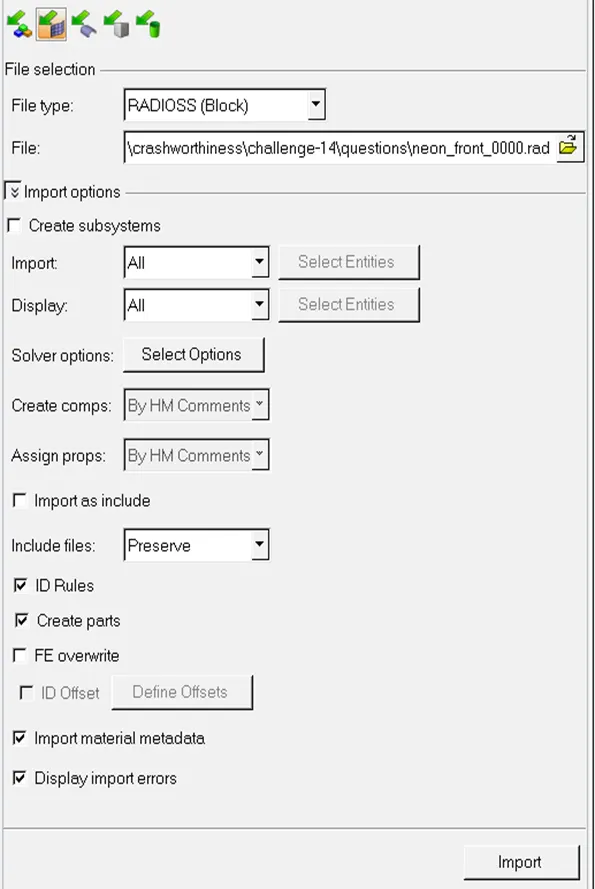
1. The neon_front_0000.rad file can be imported by using import solver deck option.
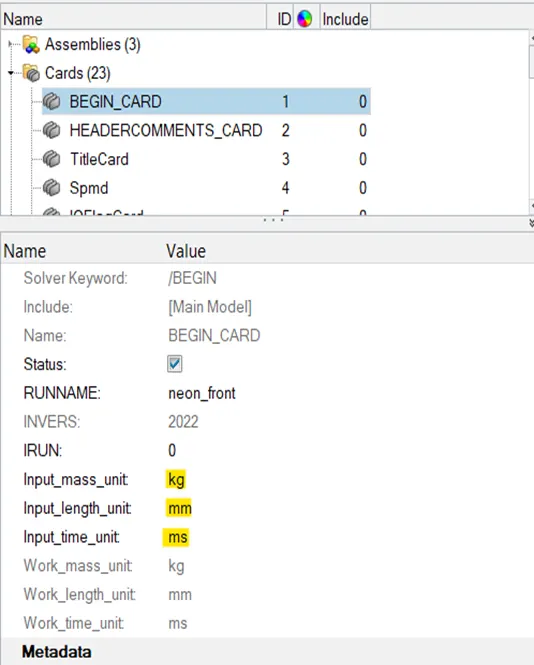
2. Unit systems can be checked by selecting the begin car (SOLVERà CARDSàBEGINCARD).
3. Type-7 and type-11 interfaces are created with recommended properties.
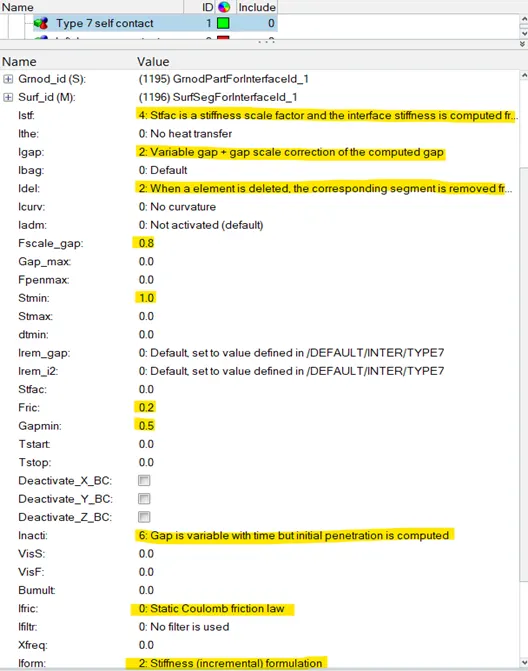
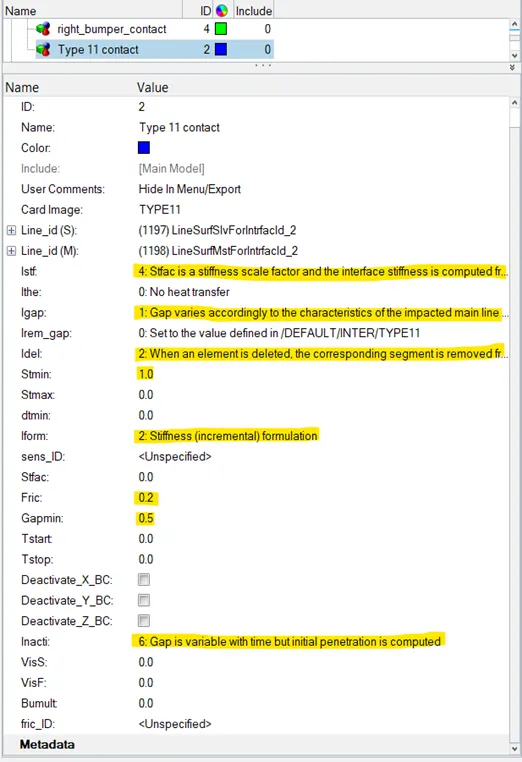
4. No intersections were found in the given model and the penetrations were taken care by using inacti option while defining the contact.
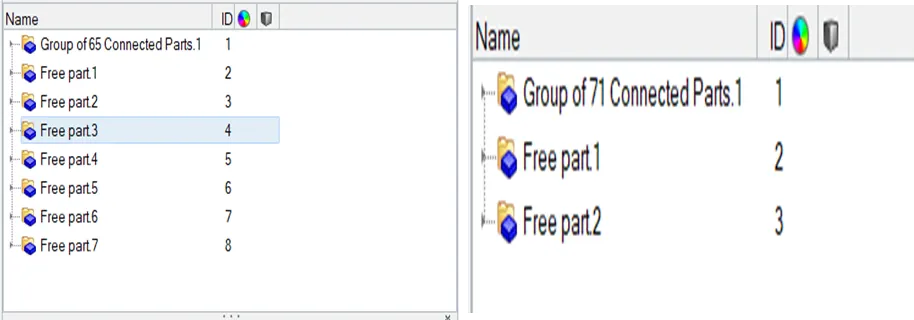
5. check for connectivity (TOOLSàFIND CONNECTIVITY). All the free parts are connected except springs.
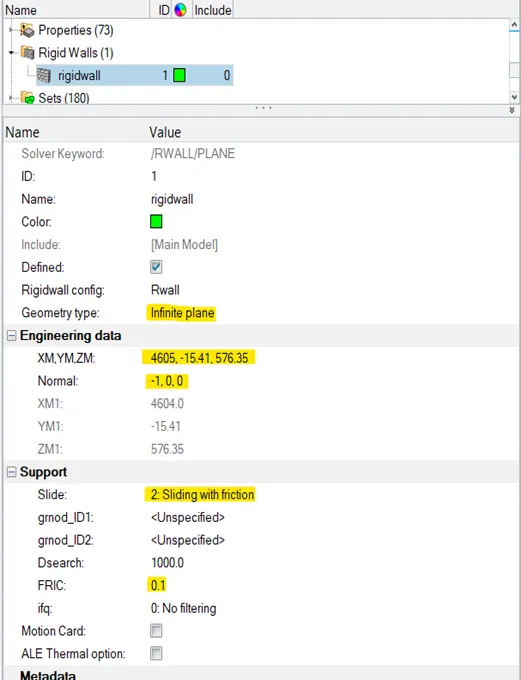
6. Plane infinite rigid wall is created with the properties shown in the below image.
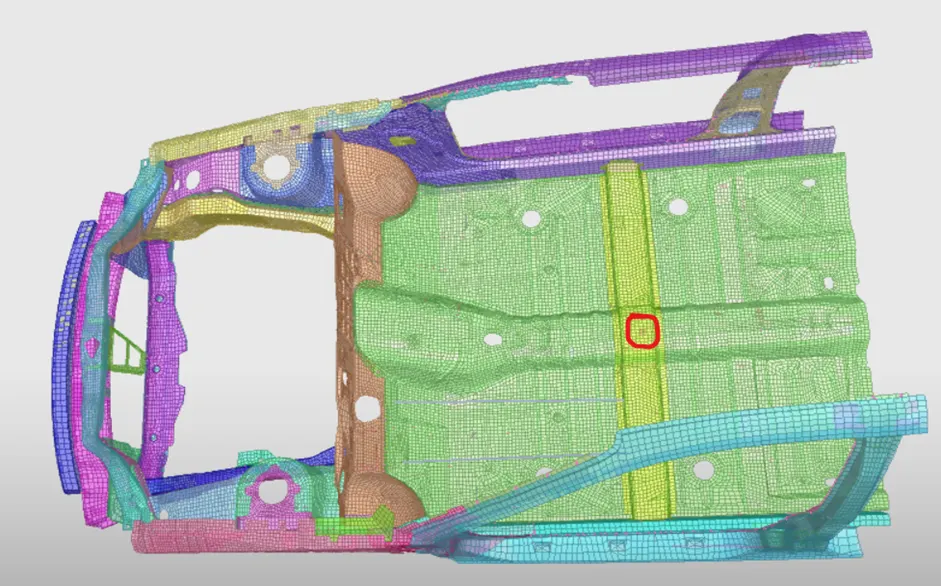
7. Mass is added to the model to achieve a total mass of 700kg and COG was maintained at desired location.
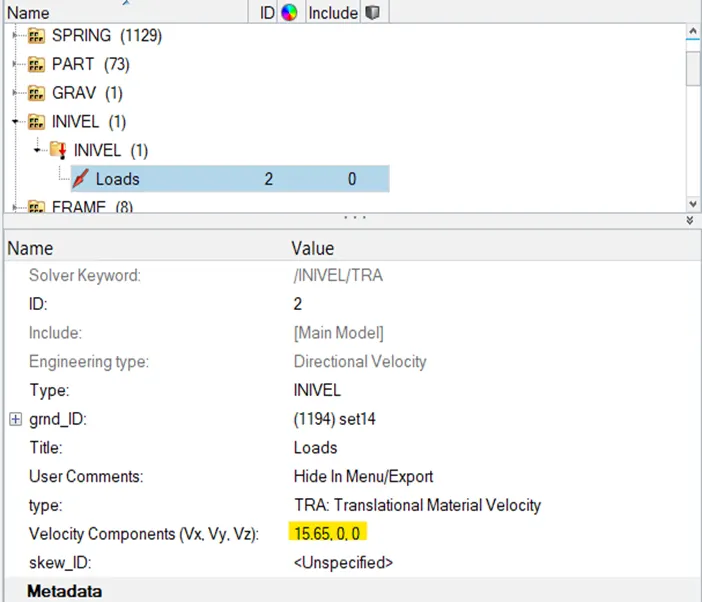
8. Initial velocity of 15.65 mm/ms in x direction is applied for the whole component.
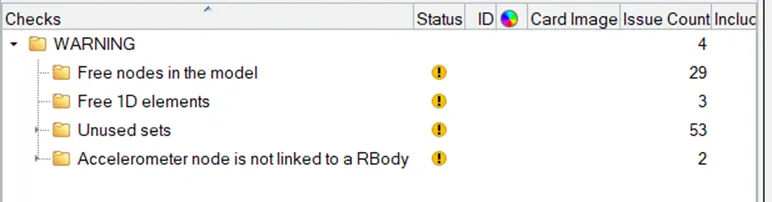
9. Model checker (TOOLSàMODEL CHECKER) was used to find the errors in the model. No errors were found in the given model.
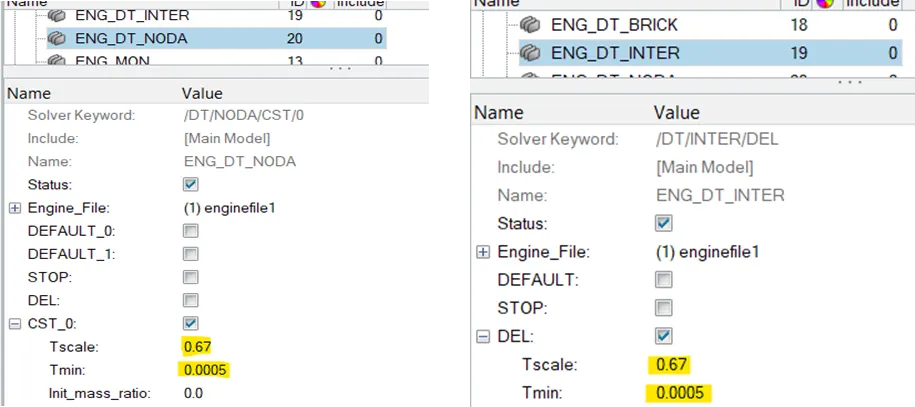
10. Interface and nodal time steps were maintained at 0.5 micro seconds with a scale factor of 0.67.
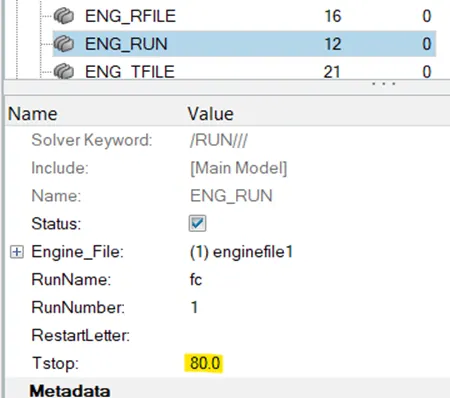
11. Run time of the simulation was maintained at 80ms.
OUTPUT REQUESTS:
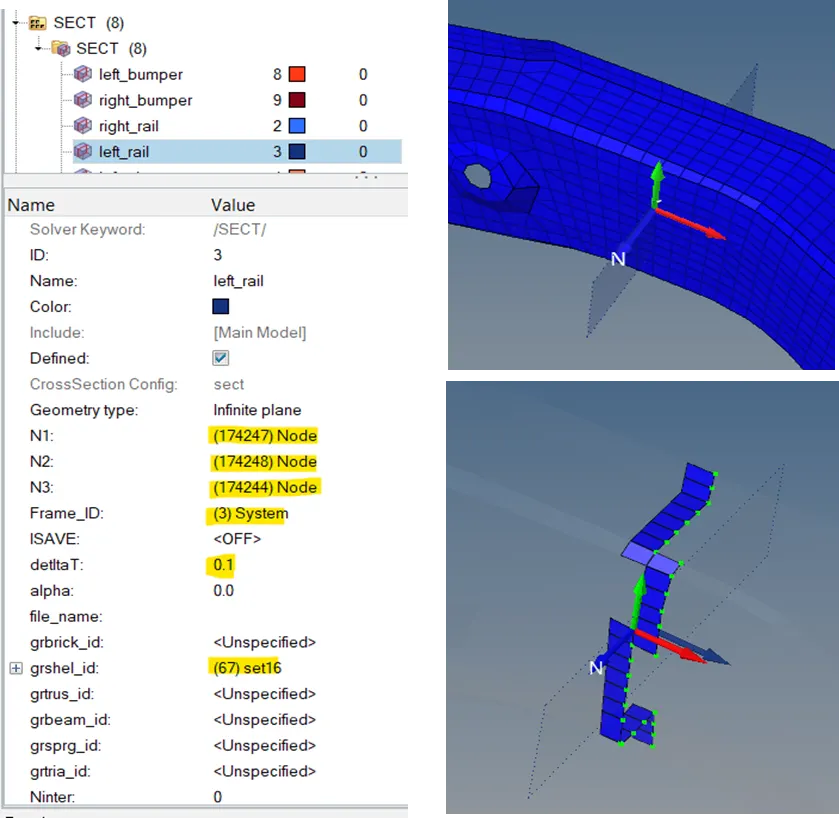
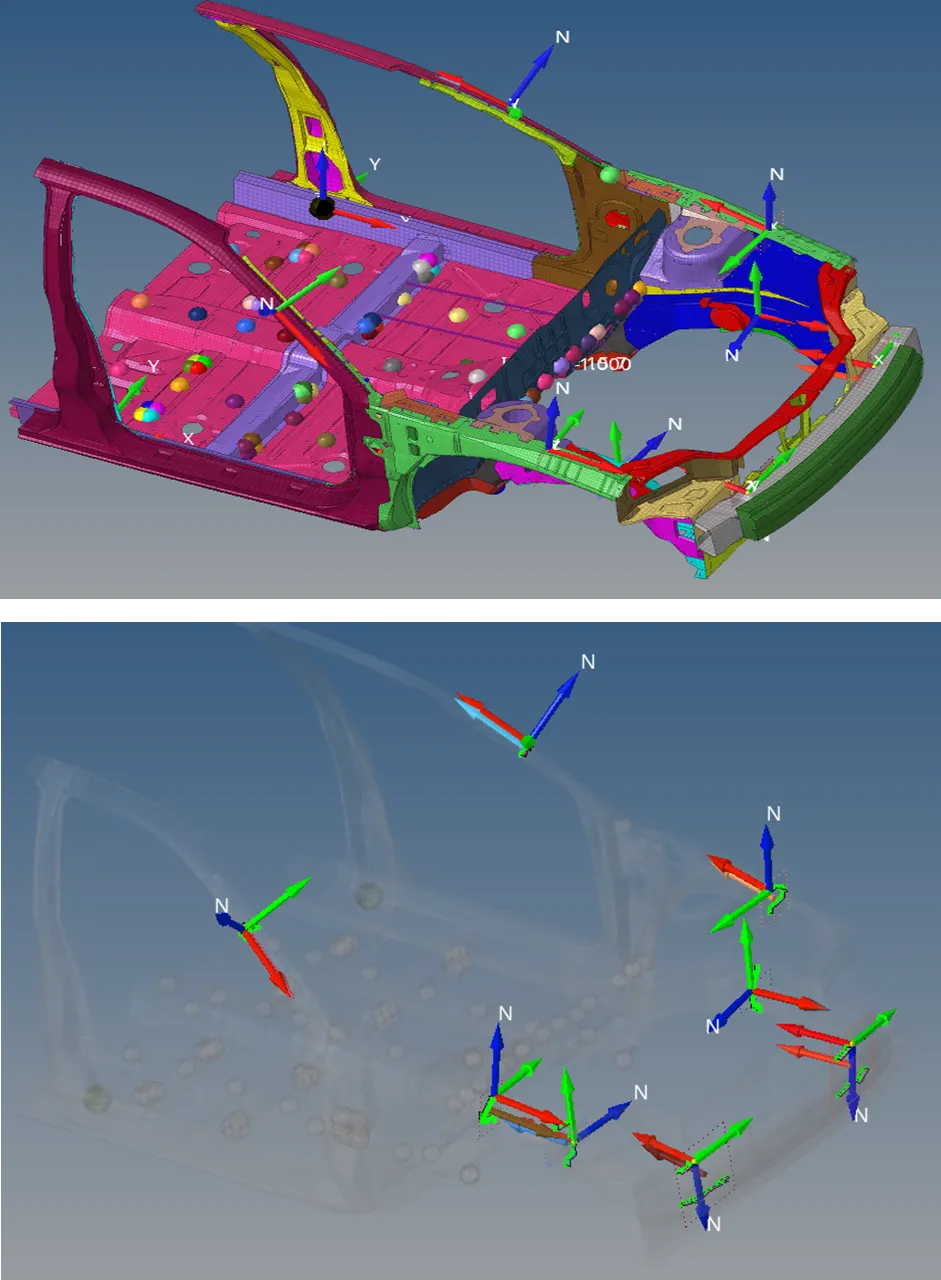
1. A section was created on the rail and a frame was assigned to it to determine the peak value of the force passing through the rail with respect to time.
2. Same procedure was followed for creating sections on different components and final sections are shown in the below image.
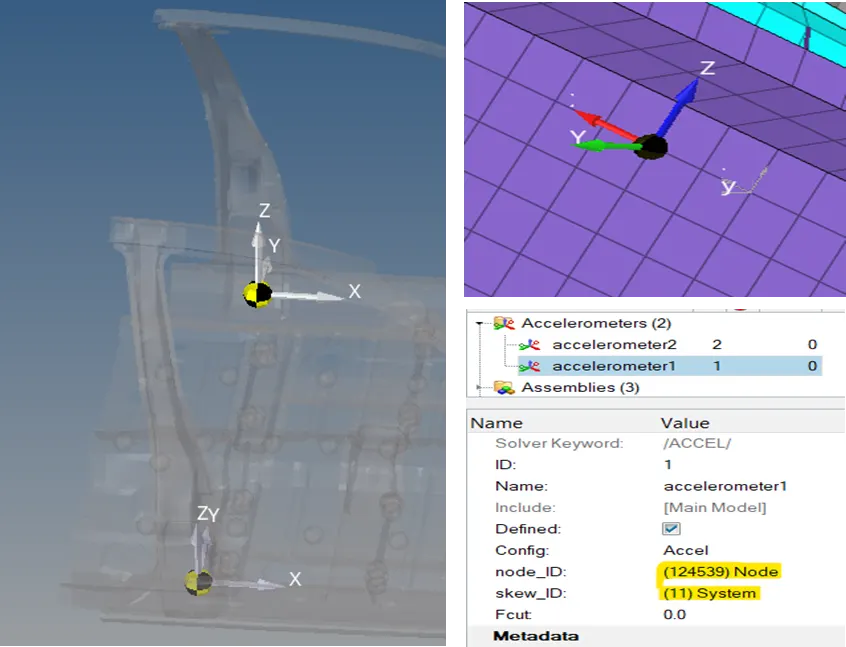
3. Accelerometers was placed at the base of the b pillar and a fixed skew was assigned to that accelerometer.
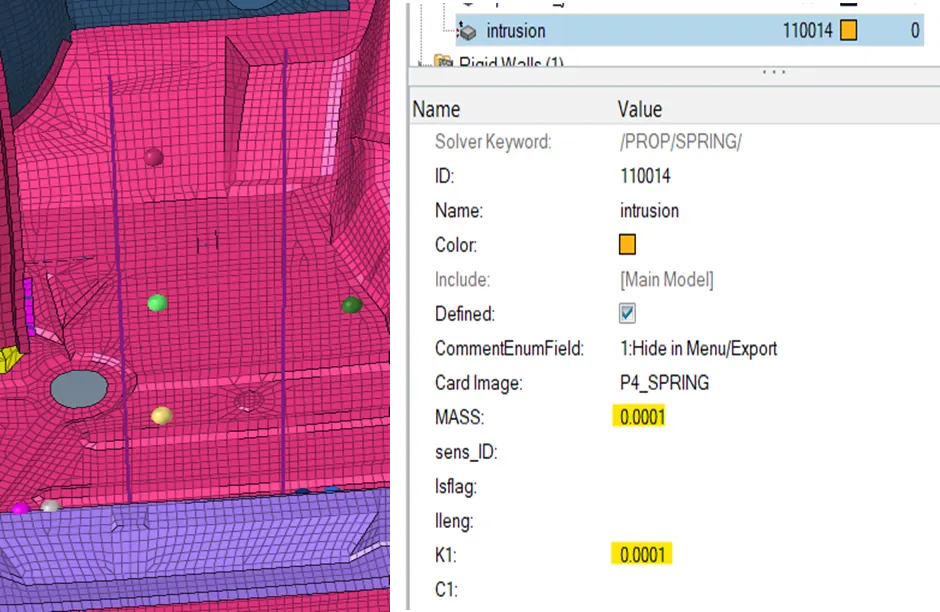
4. Springs were created to find out the intrusions of brake pedal and foot rest with properties as shown in the below image.
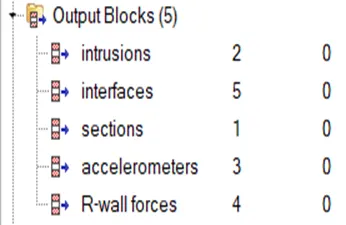
5. Time history Output cards were created for intrusions, sections, interfaces, accelerometers and R-Wall forces.
RESULTS COMPARISION:
Energy and mass errors:
Energy and mass errors were found to be -2.7% and 0.16% respectively at the end of the simulation and they are well within the acceptable range.

Variation of IE, KE, TE, CE, HGE, R-wall forces& Contact forces:
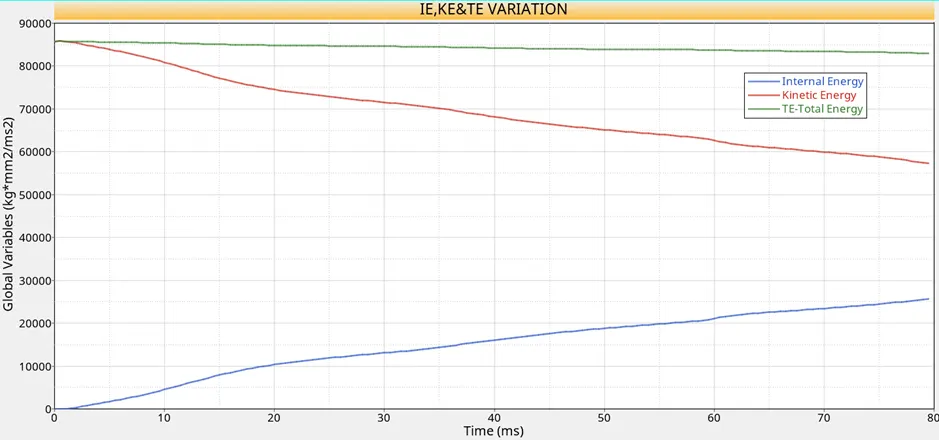
Kinetic Energy: Since the car was having some initial velocity of 15.65mm/ms, the car was having some KE at the starting of the simulation i.e. at 0ms and the same thing was depicted in KE variation graph. As soon as the crash happened between car and rigid wall, KE of the tube decreases because of the deformation in the tube. The value of the KE decreases linearly from starting to the end of the simulation because of continuous deformation of the car.
Internal Energy: The amount of work done to deform a body will be stored as energy inside the body and this energy is called internal energy. If the deformations are more, body will have more internal energy. Initially as there is a clear gap between the car and rigid wall, there was no deformations in the car, therefore the internal energy started from zero at 0ms. As the simulation time increases, the deformation in the car also increases leading to increase in internal energy till the end of the simulation.
Total energy: The total energy of the system should always remain constant. Negative error represents that energy has been dissipated from the system. In this case a slight reduction in total energy of 2.7% was observed by the end of the simulation. We can also observe the same thing i.e. negative energy error in the 0001.out file. Presence of contact and hourglass energies in the system was responsible for this imbalance in the total energy. The energy error was well within the acceptable range and total energy started from the high value because of higher value of KE.
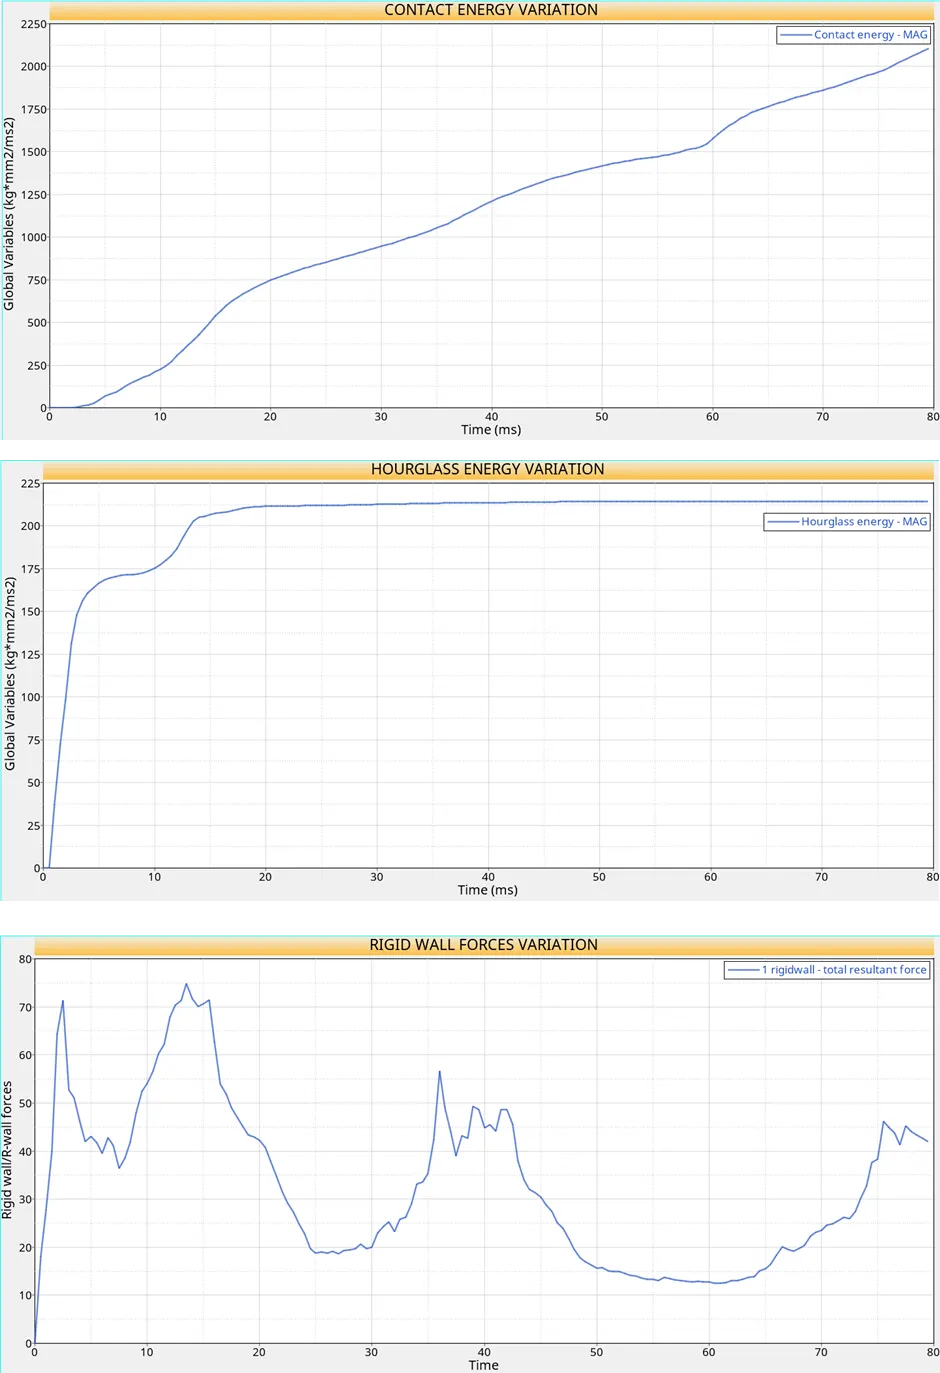
Contact energy: Energy lost in overcoming the penetration is known as contact energy. Initially there was no deformation in the car and no self-contact was observed, because of this reason contact energy started from origin. As simulation time progresses, the deformation in the tube increases leading to self-contact of the car which in turn increases the value of contact energy. The contact energy variation was almost linear throughout the simulation.
Hourglass energy: Energy spent in overcoming the hour glass effect is known as hourglass energy. For all the components QEPH element formulation was used, but still we can see we can see very few elements were undergone hourglass effect. Improper mesh in some of the components at some places lead to hourglass effect. Remeshing the elements and maintaining proper mesh where the elements were subjected to hourglass effect can help us to eliminate hourglass energy from the system.
Rigid wall forces: Rigid wall forces are the reactionary forces that are acting on the rigid ball. At 0ms we can see that there was some gap between the car and the wall, because of this we can see the R-wall forces graph was starting from origin. Once the initial impact between bumper and rigid wall took place, R-wall forces increased from 0 to 70KN.Later these forces were transferred to the car by the bumper, because of this we can see a dip in R-wall forces to 38KN.From 9ms to 13 ms r-wall forces again increased due to the increase in contact area between the bumper and wall. The peak value of r-wall forces was found to be 75KN at 13ms and later it decreases due to change in contact area between the bumper and the wall. After 30ms we can see the increase in r-wall force, this increase is due to impact between shot gun and rigid wall along with bumper-rigidwall impact. Because of the higher contact area between shotgun and rigid wall we can see a peak value of 55KN at around 36 ms. From 36ms to 60ms there was a reduction in contact area between bumper-rigid wall and shot-gun rigid wall, because of this we can see there is a decrease in r-wall forces. At around 60ms bumper was not in contact with the rigid wall and only small contact area was observed between shot gun and rigid wall. After 60ms r-wall forces again increased due to increase in contact area between shot gun and the rigid wall.
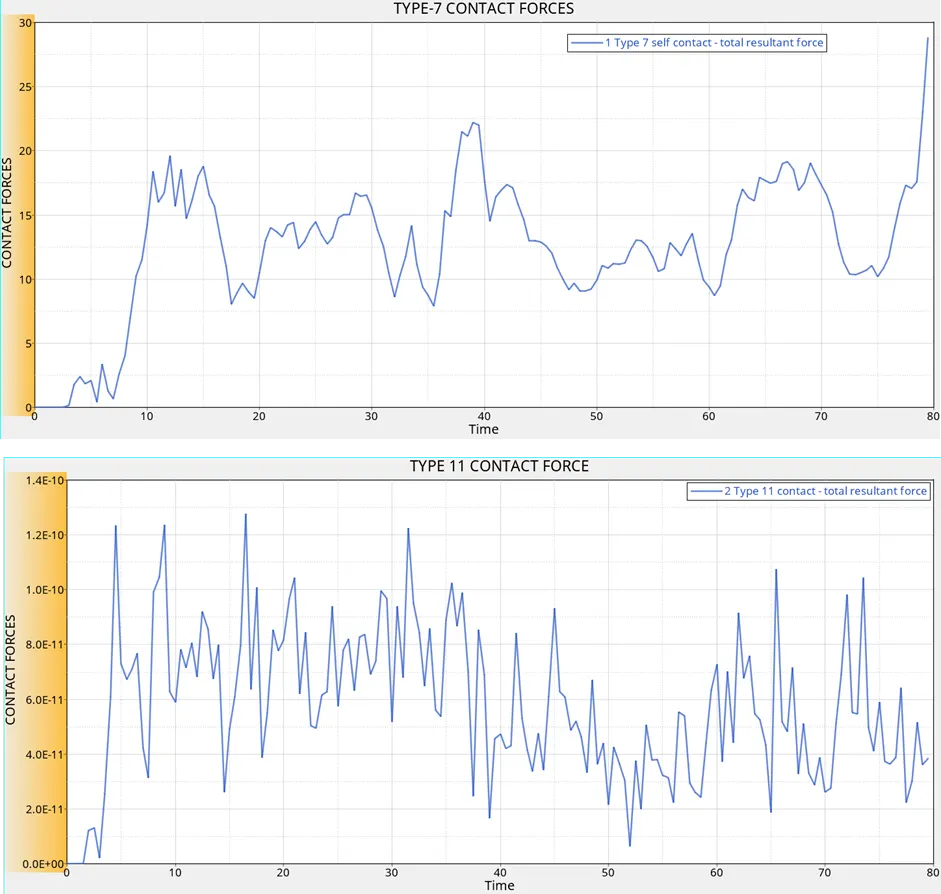
Contact forces: Resisting forces applied to overcome the penetrations are known as contact forces. Since there was no contact initially, we can see the contact forces were starting from zero. As the deformations increases, elements will try to come into contact with each other and requires higher resisting forces to separate them. A peak value of 28KN at the end of the simulation was observed because of the larger deformations in the body. As we can see form the type 11 contact force variation graph, very less resisting force is required to remove edge to edge penetration compared to the resisting force required to avoid node to surface penetration. Defining type 11 contact helps us to slightly reduce the node to surface penetrations during the simulation.
OUTPUT REQUESTS:
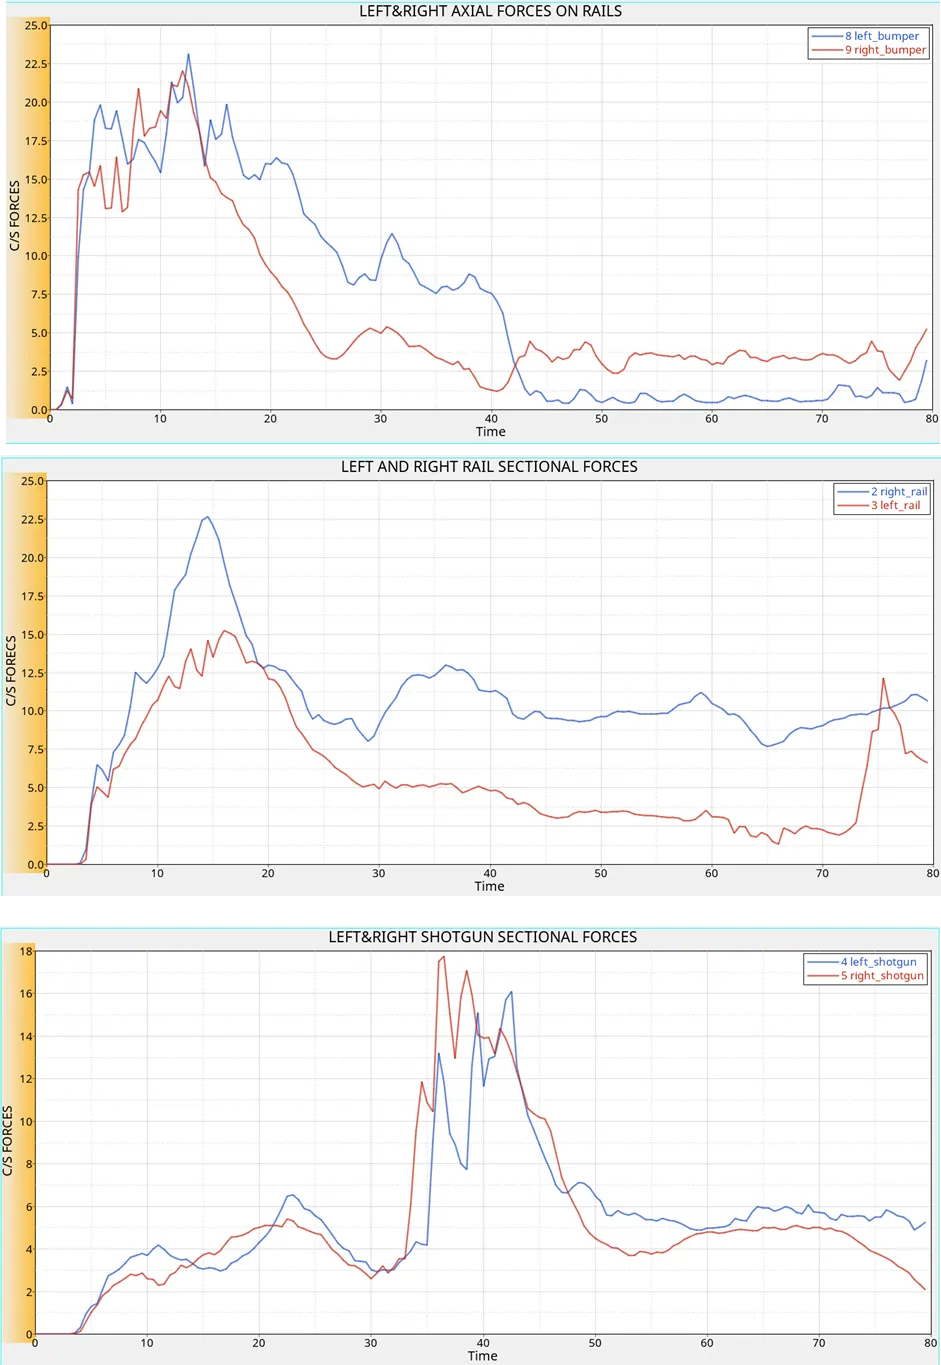
We can see the axial forces on rails from bumper on left- and right-hand side are not same. This variation may be due to:
Ø Difference in mesh flow on both the sides.
Ø Sectional forces may not be exactly symmetrical on left- and right-hand sides.
Ø Presence of non-symmetrical or extra components leading to difference in mass distribution on one of the sides.
Axial forces on rails received from bumper: The max value of axial forces received on left and right rails from bumper are 23.15 KN & 22.02 KN respectively. We can see the max value occurred in between 10-15ms i.e. where the max contact has happened between the bumper and the rigid wall. After 15ms the left and right and axial forces got decreased continuously till the end of the simulation indicating that the contact between bumper and rigid wall has been reduced.
Sectional forces in rails: Since the forces experienced by bumper on left- and right-hand side are not equal, the force transmitted from the bumper to rails on both the sides are also not equal leading to variation of forces in left and right rails. Some part of the total forces are absorbed by the bumper and remaining part was transmitted to the rails. The max value of forces in left and right rails are 15.2 KN & 22.65 KN respectively. The peak value occurred during the initial impact of the car with the wall i.e. at 14-17ms.
Sectional forces on shotguns: The forces on the shot guns are due to forces transmitted from rails and the rigid wall. The max value of forces on left and right shotguns are 16.09 KN & 17.75 KN respectively. The max value occurred in both the shotguns when they came into contact with the rigid wall in between 40-45ms.
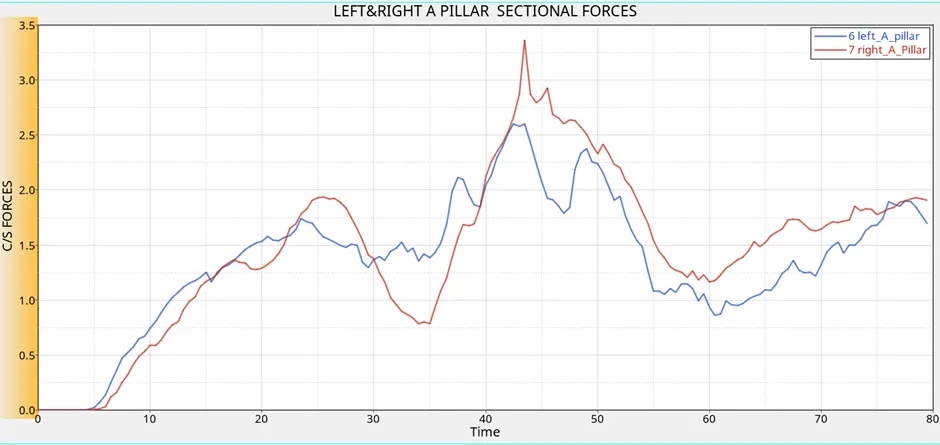
Sectional forces on A pillars: The max value of forces on left and right A pillars are 2.60 KN & 3.36 KN respectively. Most amount of the forces were absorbed by other components and only very less force has been transmitted from shotguns and rails to A pillars.
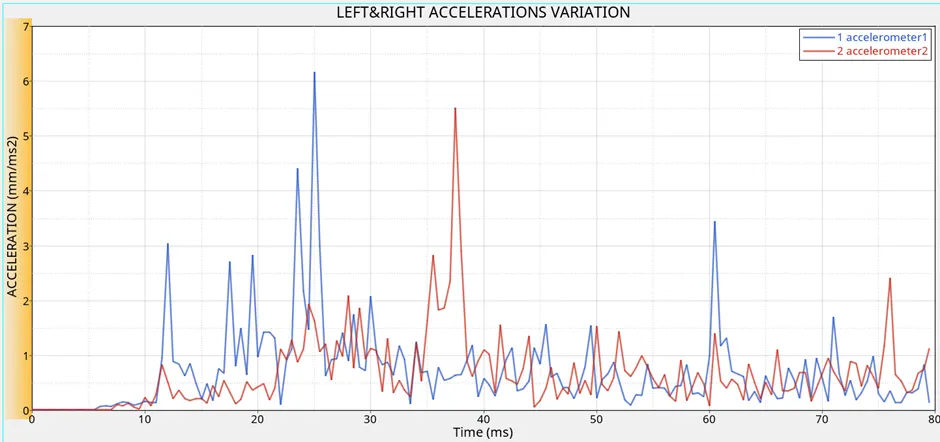
Acceleration at the base of the B pillar: Accelerometer was attached at the base of the B pillar on both the sides to record the rate of change of velocity during crash. The acceleration was constant before the crash, once the impact has happened the front portion came to rest and remaining portion of the car was decelerated. The noise in both the acceleration curves can be attributed to vibrations that are produced during the crash. The max value of acceleration recorded on left and right accelerometers are 5.50 mm/ms2 and 6.17mm/ms2 respectively.
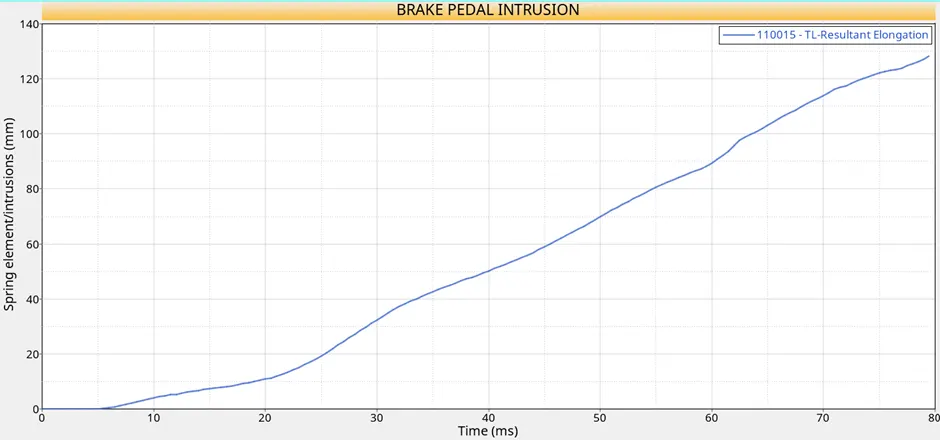
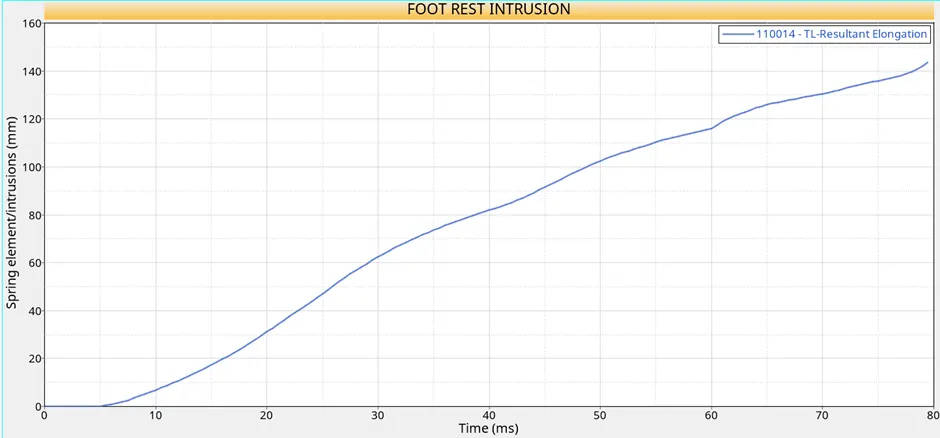
Foot rest and brake pedal intrusions: The amount of shrink in the structure during the crash is known as intrusions. As per IIHS good rating, the intrusions in the foot rest and brake pedal should be less than 15cm. The max intrusions of foot rest and brake pedal were found to be 143.67mm and 128.28mm respectively, and they are well within the acceptable range. More the deformation, more will be the shrink in the structure and because of this reason we can see max value of intrusions at the end of the simulation.
Simulation:
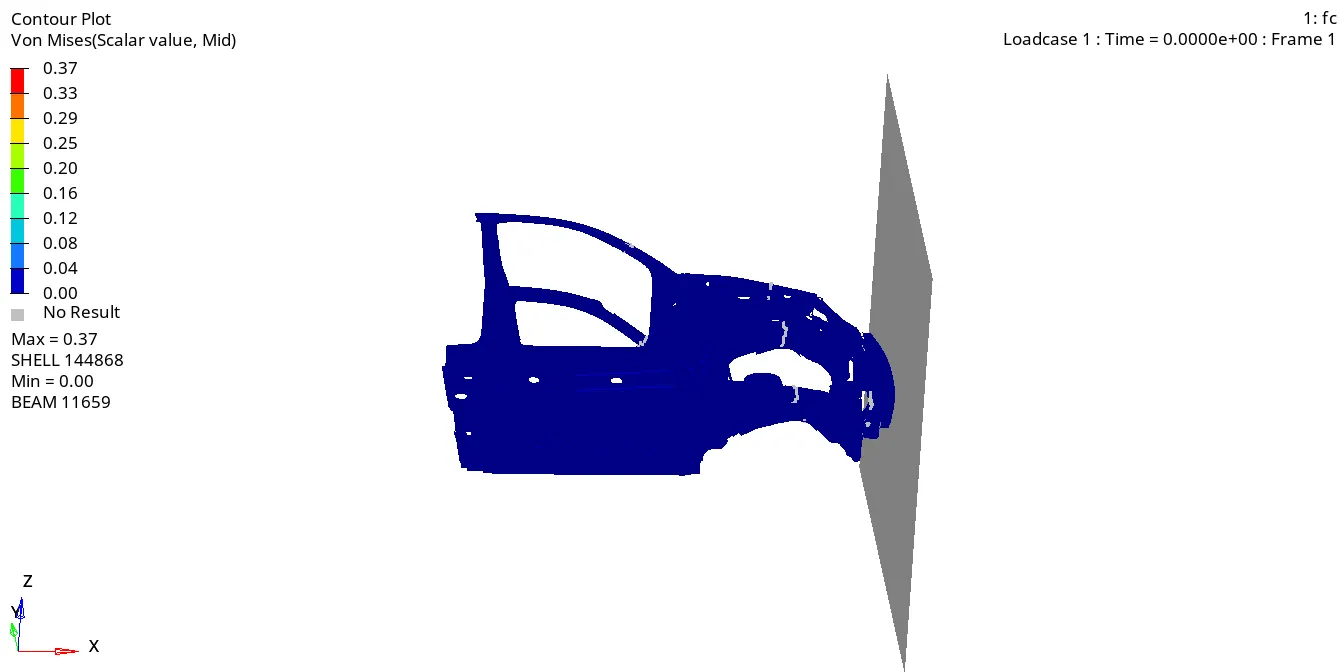
Max von mises stress was found to be 0.37 Gpa.
CONCLUSIONS:
Ø Frontal crash analysis was performed on the given BIW model and load path has been studied by creating sections. Obtained intrusions are well within the acceptable range.
...