Assignment 6-Frontal Crash Simulation Challenge
Aim :To perform frontal crash analysis on BIW part of car using the hypermesh and solving with the radioss.
Introduction to Frontal Crash
The objective of a crash test is to measure how well a passenger vehicle would protect its occupants in the event of a serious
real-world frontal crash. Federal Motor Vehicle Safety Standard (FMVSS) No. 208 is the measure that gives us the valuers that
how much it can be deformed so the passenger should not get injured that much. If it is within the limit then we can say that
the car has passed the test otherwise it is failing.
The ideal frontal crash test procedure will be able to evaluate occupant protection while ensuring that the vehicle will not
jeopardize its crash “friendliness” with its collision partners. Finally, the test conditions (e.g., impact speed, impact angle, and test
device) must be representative of the frontal crash environment to which passenger vehicles are exposed on the highway.
There are some tests we can perform in the frontal crash analysis. In one analysis, the vehicle is projected towards a solid
obstacle at a predesigned velocity. The obstacle can either be a concrete wall or a barrier., NHTSA is amending its safety
standard on occupant crash protection to establish 56 km/h (35 mph) maximum speed for frontal barrier crash tests.
Another version of the frontal impact test involves a crash between two vehicles. In this type of testing, we crash two cars and
check what happened to the vehicle and the passenger. Physical testing is very expensive so what car manufacturers do is
perform more tests that involve a solid obstacle. That's when proper design and Computed simulations come into the picture.
Real tests are just for approval of simulation results. Hence save a lot of money.
There are some offset tests also done in the frontal crash analysis of the car. In this type of test, only a part of the car impacts
the obstacle, whether it’s a wall, barrier, or another car. This test is extremely important because even though the impact area
isn’t as large, the impact forces are almost as high as with the full-frontal crash.
So we are going to do the frontal crash in which we are going to do the crash of the car on the wall. So our analysis is the Full
Frontal Fixed Deformable-face Barrier (FFFDB) test. In this test, we are going to give the velocity to the car to be 54 km/h (35
mph). We are going to create the intrusion and we are going to check the deformation in the intrusion so that we can see that it
is failing for the crash or it passed the test.
Objective :
1. Import the mesh part of BIW car part to the hypermesh.
2. Create rigidwall for the crash analysis.
3. Create a intial velocity for the model.
4. Create section cards, accelometer on A-Pillar, B-pillar, and rails of bumper.
5. Create intrusions on specified nodes using skews.
6. Add the required mass in the model and maintain the cog correctly.
7. Run the file and extract the results.
Theory :
What is Crash test on a car?
- The front and rear end of an automobile is generally made up of predominantly steel members. These steel structural members
influence the crash performance of an automobile. Crash performance of a vehicle is typically evaluated using a crash test or a
crash analysis. In crash analysis, the mechanical behavior of steel is represented using the properties obtained from quasi-static
tests. - A crash event is a high speed event and will cause material points to move at a higher strain rate than used in the quasi-static
test. Dynamic tests are normally required to evaluate the strain rate related properties of steel. Strain rate related properties of
steel have not been available, so quasi-static test properties were generally used in the crash analysis. Recently, Auto-Steel Partnership (A/S P)
obtained the strain rate properties of four different types of automotive steel. These findings were used in several component
studies to quantify the effects of strain rate in impact and crush analysis. However, no investigation has been performed to
quantify the effects of strain rate of steel in a full vehicle crash analysis. This study investigates the effect of strain rate in full vehicle frontal
crash analyses using two full vehicle models and test results. - Although vehicles in general are much safer in collisions than they used to be, more than 20,000 people traveling in passenger
vehicles still die in crashes every year. Many factors contribute to fatal crashes, including hazardous driving, failure to wear safety
belts, poor road conditions, and the vehicle's crash-avoidance capabilities. But, the actual vehicle you're sitting in when a crash
occurs can make a life-or-death difference. - Crash tests provide insight into the protection offered by the vehicle itself. As a secondary benefit, the published crash ratings
encourage automakers to make ongoing improvements. But with two primary testing organizations (government and insurance
industry), multiple tests conducted on each car, and competing manufacturer claims, it can be difficult to make sense of it all.
This crash-test primer will enable you to understand the information that matters most. - Structural design and safety systems determine how well a vehicle protects its occupants. But it is only independent crash
testing under controlled conditions that differentiates one car from another and tells us how well its key components work
together. A crash test may reduce the vehicle to a shattered wreck, yet good structural design keeps passenger-space intrusion
to a minimum. Important safety systems such as safety belts, air bags, and head restraints serve a vital role, by restraining,
positioning, and cushioning occupants while a collision takes place. - What is front crash?
- Front-crash test accelerates a car straight into a rigid barrier at 35 mph, with the entire width of a vehicle's front end hitting the
barrier. Instrument-bearing, seat-belted crash-test dummies in the two front seats record the level of crash forces on the head,
neck, chest, and legs. Those measurements correlate with injury, but formerly only the head and chest results formed the basis
of the star rating. Individual star ratings are assigned to the driver and the front passenger. Some automotive experts have
criticized NHTSA's full-frontal, rigid-barrier test as unrealistic because such head-on crashes into a flat, solid wall are relatively
rare. Others argue that real-world or not, flat-barrier testing is a good way to gauge the effectiveness of the restraint systems,
primarily the safety belts and air bags.
Procedure :
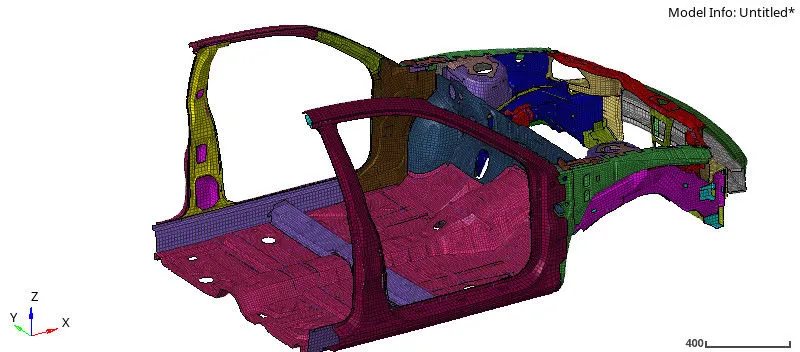
Step 1: Import the model to the hypermesh which is in .rad file, these file can be imported using import solver deck option.
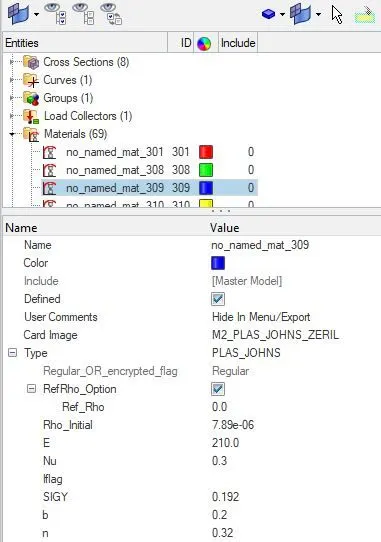
Step 2: Now open the model tab and all material properties and element properties are defined to the all biw parts.
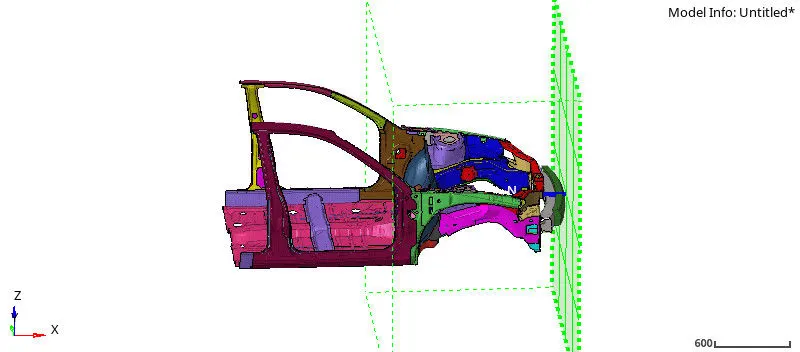
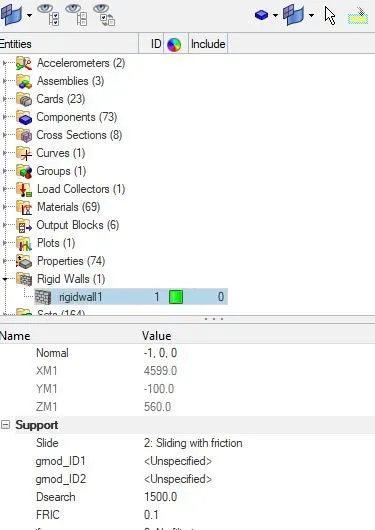
Step 3: Now create a rigidall with help of rwall card and select the node to specifies the direction rigidwall and give friction as
0.1.
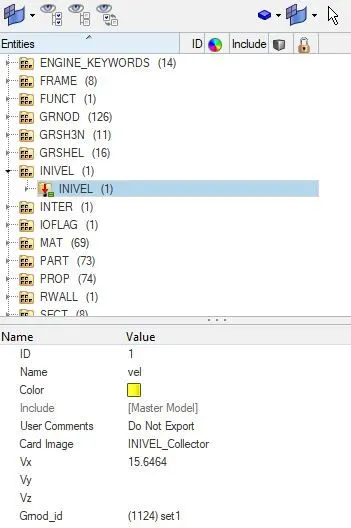
Step 4: Now create a velocity card using invel card and specify the velocity in x-direction as 15.6464 mm/ms.
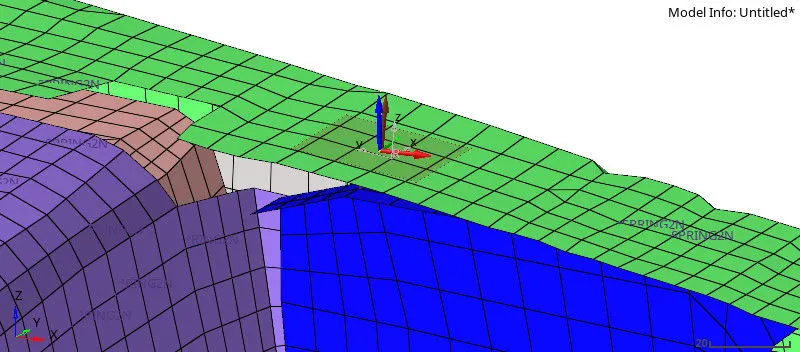
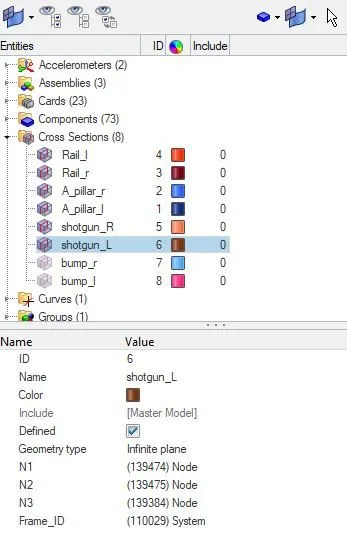
Step 5: Now create a crossection cards in A pillar, bumper rails and shotguns. To create a section card first we need to create a
frame, so go to frame select move option and select three nodes which represents the x,y and centre point and proceed. After
creating it go to the section card and select the three nodes which is selected for frame and select the frame abd three rows of
shell elements in the direction of frame.
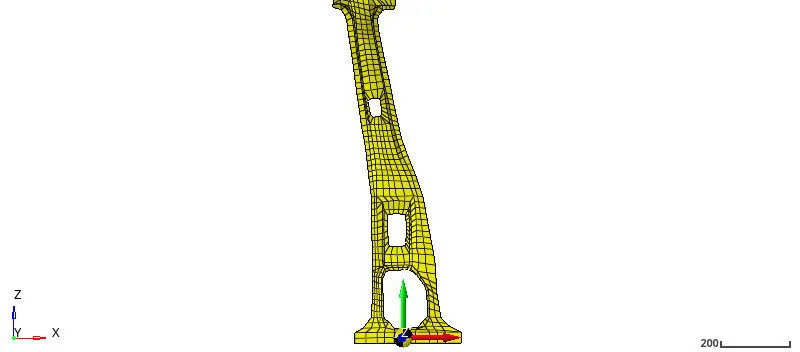
Step 6: Now create a accelometer on the B pillar. To create accelometer first we need to specify the skew and then create the
accel card. Skew is created same as frame.
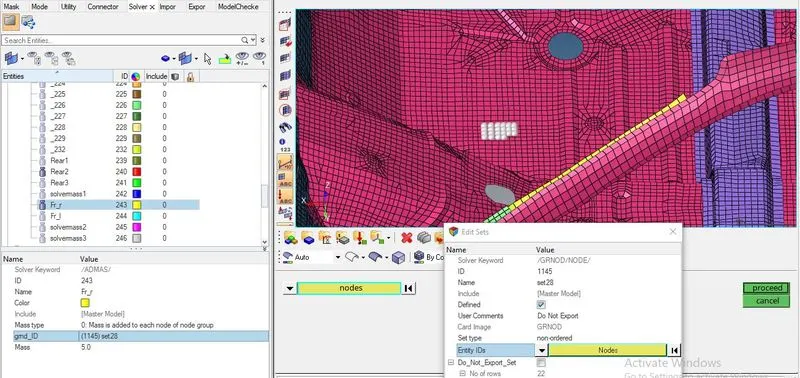
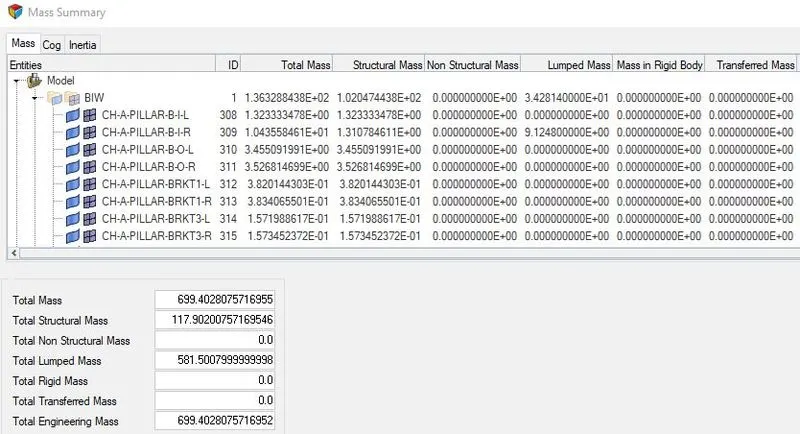
Step 7: To balance the centre of gravity add mass on the front seating area and rear seating area by using the add mass option
and total mass of the biw car part has to be in 700 kg so add mass carefully. Here mass is added on the each node.
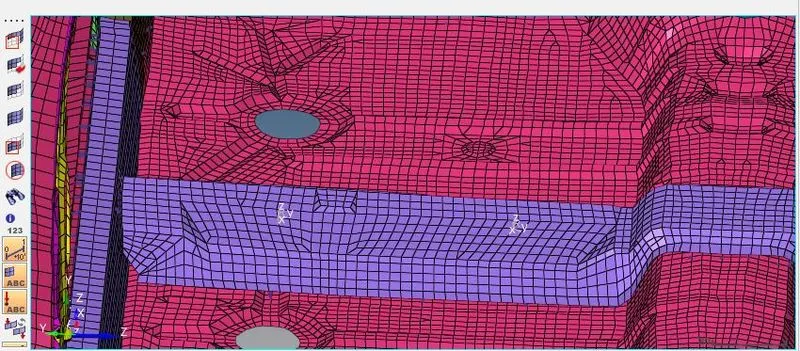
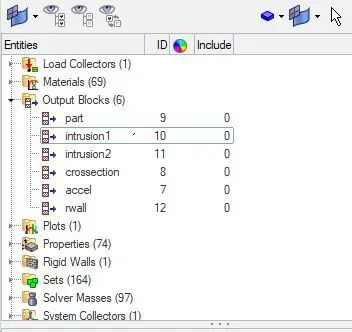
Step 8: Now create intrusions by creating skew on the floor rail side and then create a output card for intrusion and there specify
the skew and node where the intrusion is needed.
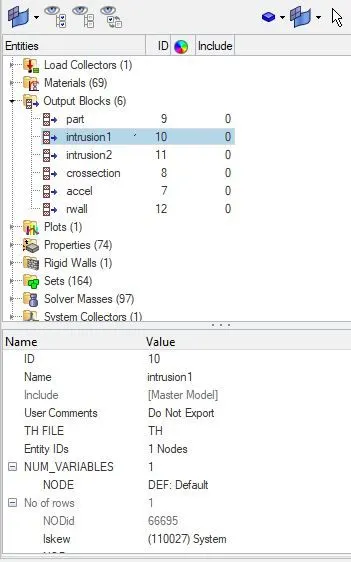
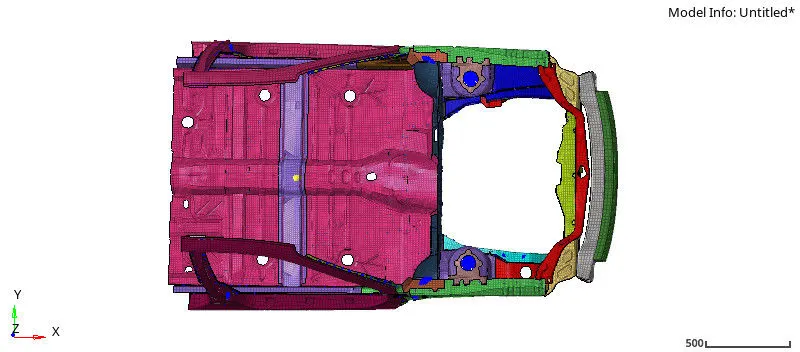
Step 9: Now create a output cards for accel, crossections, parts and intrusions where these cards can helpful to extract the
results.
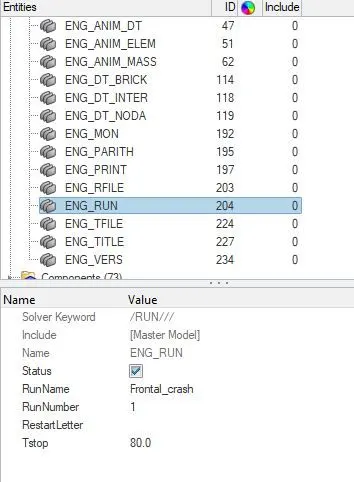
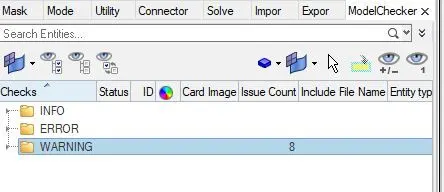
Step 10: Now check the run time and model check for radioss solver deck, here errors can be find out before solving the
problem and after clearing all errors and warnings we can go for solving the pr0blem.
Errors :
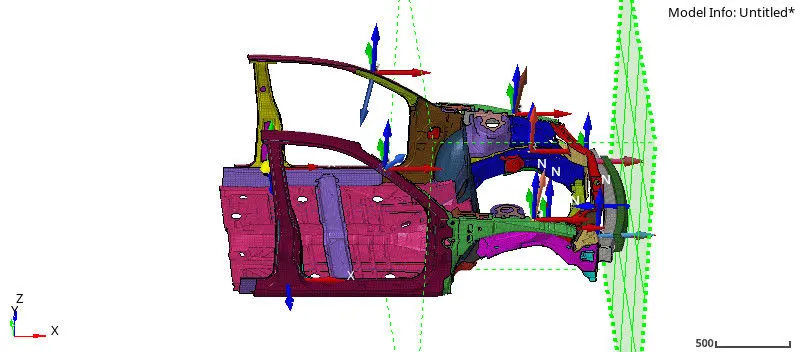
1. Before solving the model check the solver deck and somer errors are occured. For my model I did not specify the element
property for the rigid body which is connected to inner and outer inner panel. This can rectified by adding property card to the
rigid body component.
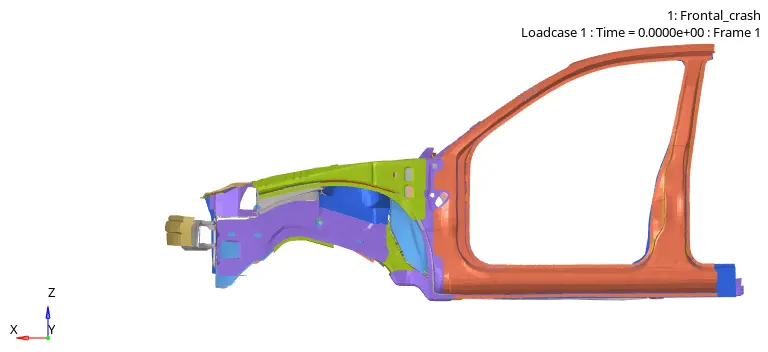
From simulation we can see that inner part of A pillar is not connected properly which we did not defined this will cause the
damage to the passenger, so before solving check the solver deck properly and go for the run.
Results&Discussion :
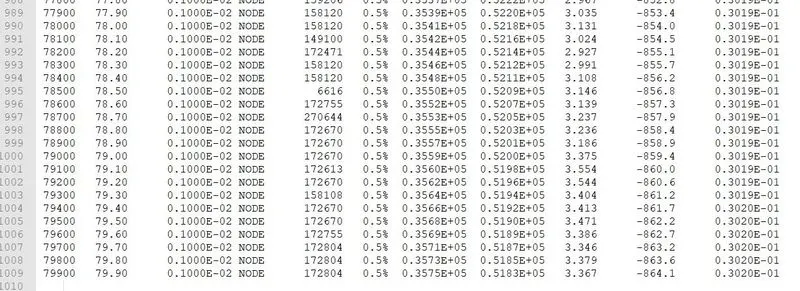
1. Now check the enrgy error and mass error in the simulation and also check the simulation time for the model. For our model
energy error is 0.5% and mass added to the model is 3.02 % and these value indicates oyr simulation is perfect and no
hourglass energy is created in the simulation. Time taken to solve this model is 2hrs 56 mins and the reason for this is we did
not use multi core run and we use single core or single thread run.
2. After that switch the application into hyper view and open the .h3d file which is an animation file output.
3. Now open the contour plot and apply the displacement, and von misses animation parts.
From the displacement animation we can observe that maimum displacement is occured at the end of the floor panel with
1.287E+03 mm.
Maximum stress is occured at the front rail bumper part and stress is distriburted along the whole biw part and materials applied
in the model is john zeril and all strain value and hardening values are defined.
3. Now switch hyperview to hypergraph and slect the plots of cross sections, accelometer at A pillar, B pillar, rails of bumper and
shotguns.
i. First plot the crossection force for A pillar right and left, rail right and left, Bumper rail right and left, and shotgun right and left.
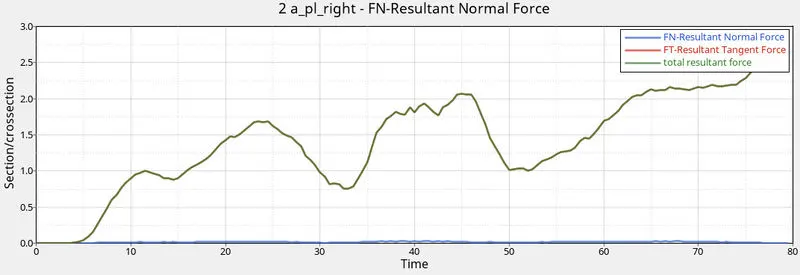
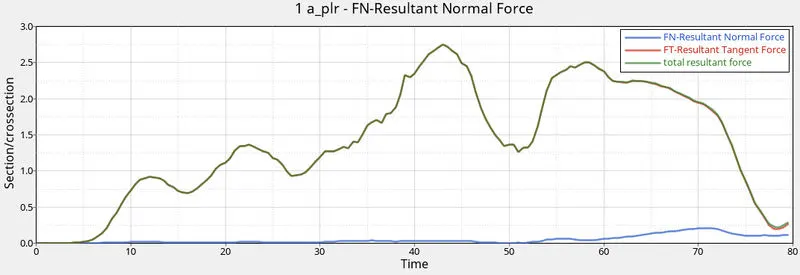
From both sides maximum force is 2.7KN and reduced to zero after complete crash.
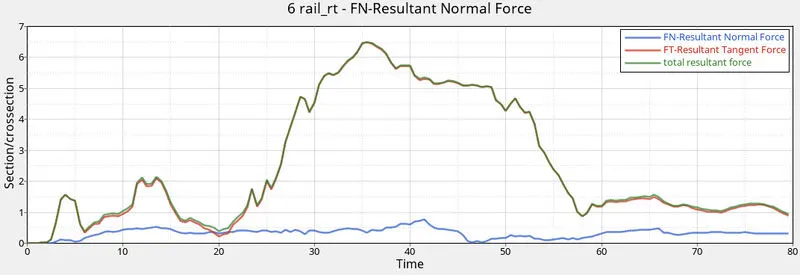
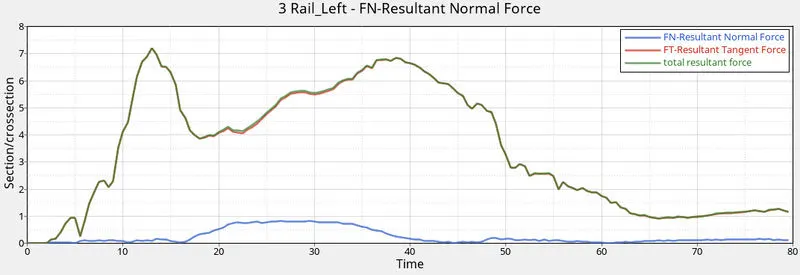
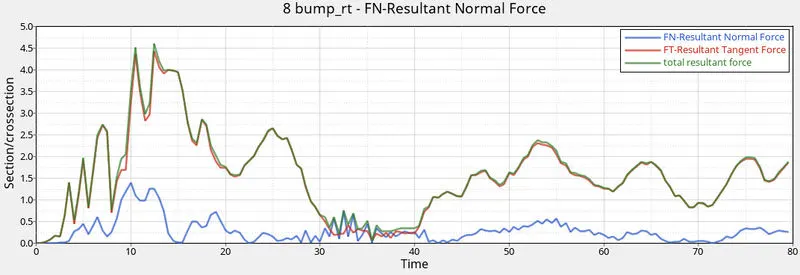
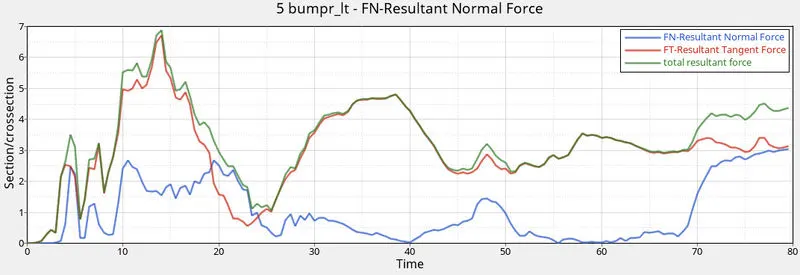
Maximum force created on rail part is 7.0kN approximately and here force is distributed to the next connected part and peak force is occured at when the bumper completely crashes into the rigidwall at 12ms.
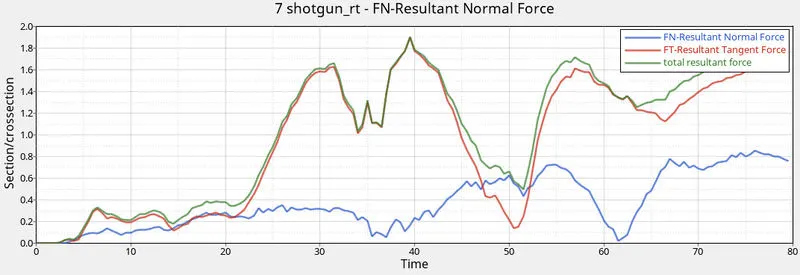
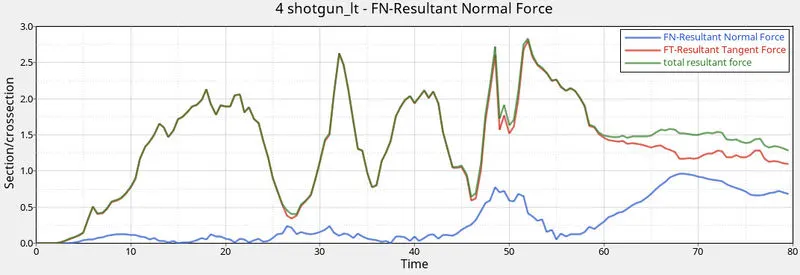
For shortgun maximum force is 2.8KN at 55ms and here we can observe that force is ditsributing part to part and it is decreasing
while absorbing the force. This indicates that most of the impact is absorbed at the front bumpers.
ii. Now extract the accelerations on the B pillar using accelometer plots.
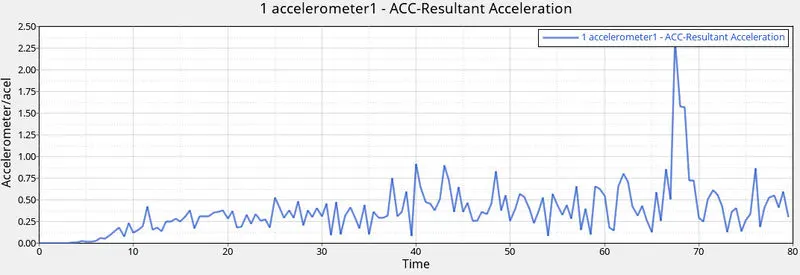
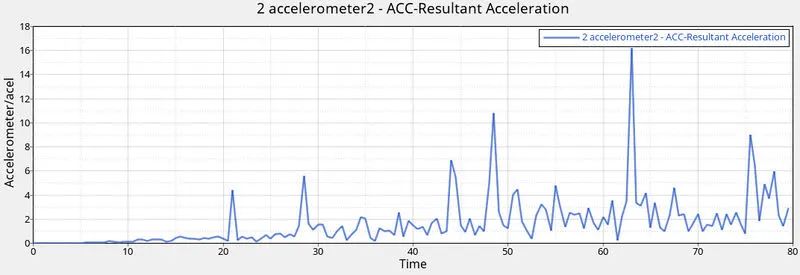
Here we can observe that maximum acceleration occurs at 65ms for left side and 69ms for right side and 2.5mm/ms2 for right side and 16 mm/ms2
for left side. This indicates that acceleration is generated more at the left side of the model.
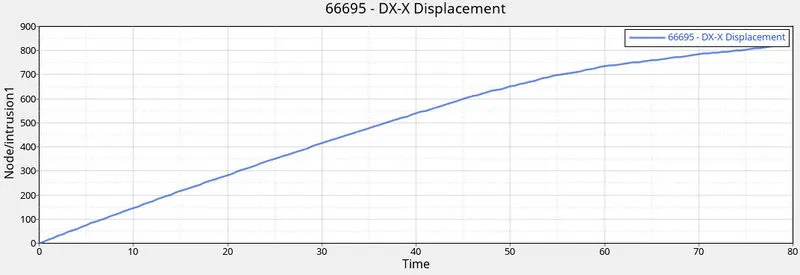
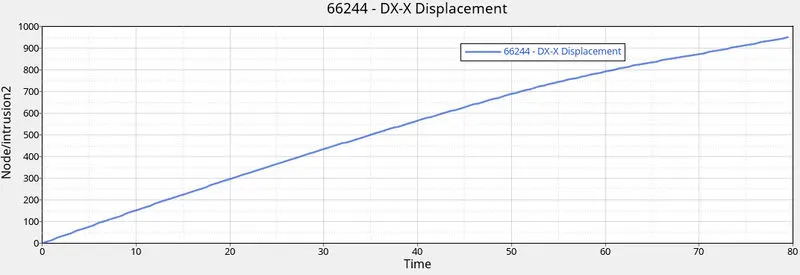
iii. Now extract the intrusion values of the model.
From intrusion plot we can suggest that less displacement is generated at the begining of the crash and takes 80ms to reach
the value of 900mm displacement .
4. Now extract the energy plot and check whether it is balanced or not.
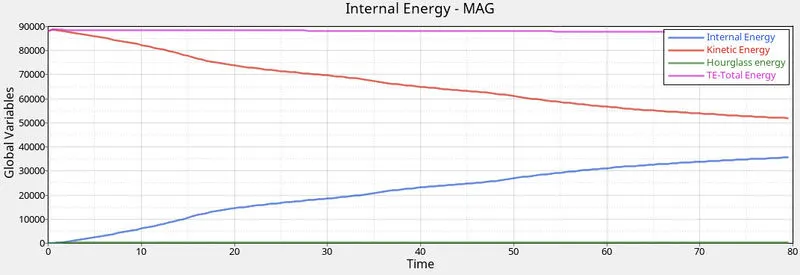
From the graph we can observe that energy is completely balanced and there is no hourglass energy is created in the model.
This indicates that we have simulated our model in perfect.
Conclusion :
Thus Frontal crash simulation is performed on the BIW part of neon car model and extracted the results. From results we can say that maximum impact is generated at the bumper rail (7.0KN apprx) and it is distributed along the parts and reaches to the A pillar and crosssectional forces are also decreased. Acceleration is extracted at the B pillar and conclude that more acceleration is generated at passenger side. Intrusions are also extracted at the break point and conclude that less displacement
is created at starting of crash and increases rapidly. Hourglass energy is stabilized and mass scaling is maintained to 3.2%, but single core cpu is used to solve the problem which has taken 2hrs 52mins.
Thus the simulation of the frontal crash for Chryslers Neon is executed and the following observation has been made. It is noted that the BIW components are designed in such a way that it passes the forces away from the driver's cabin making the driver safe.
Energy Errors -- 0 to -1.5%
Mass Errors -- 0.018 to 0.025%
Learning Outcome
- Learn about the frontal crash test and different types of frontal crash
- Learn about the FMVSS 208.
- Learn how to add mass in the model and learn about the CG of the model.
- Learn about the sectional forces, axial forces.
- Learn about the accelerometer.
- Learn about the intrusions.
- Learn about internal energy, kinetic energy, hourglass energy