Assignment 6-Frontal Crash Simulation Challenge
Assignment 6: Frontal Crash Simulation Challenge
Course: Crashworthiness Analysis using HyperMesh and Radioss
Submitted by: Amanpreet Singh Whan
Supervisor: Harsha Chowdary
February 02, 2022
List of Figures
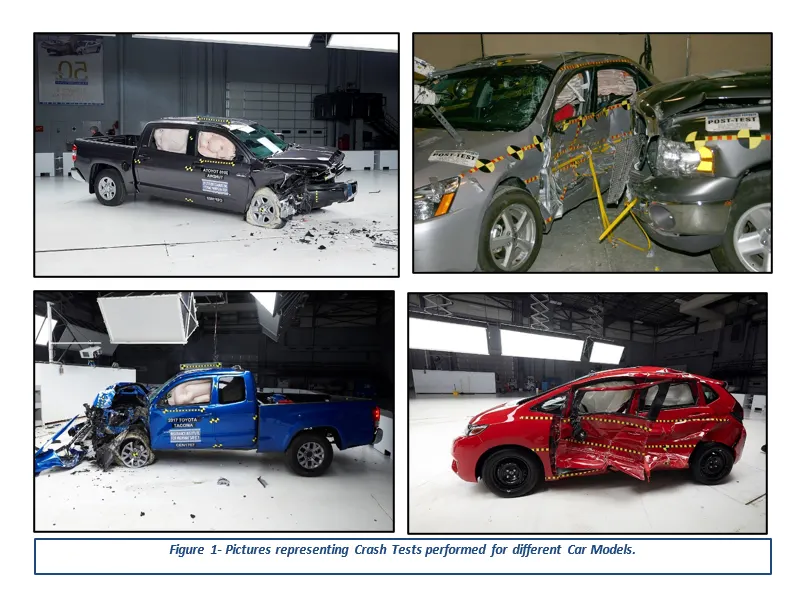
Figure 1- Pictures representing Crash Tests performed for different Car Models.
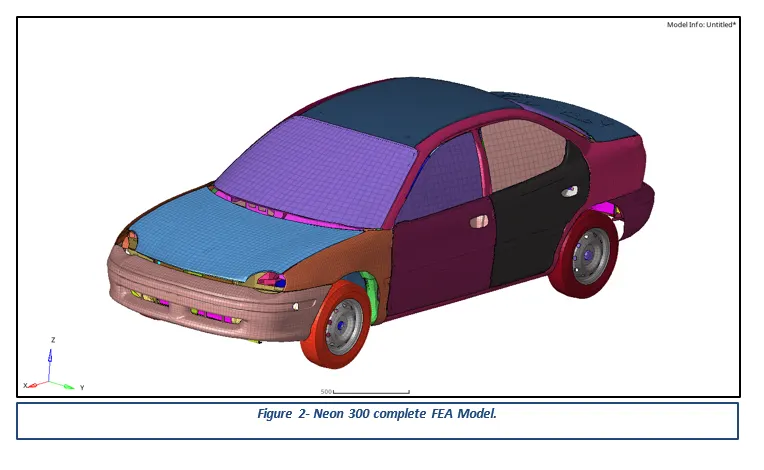
Figure 2- Neon 300 complete FEA Model.
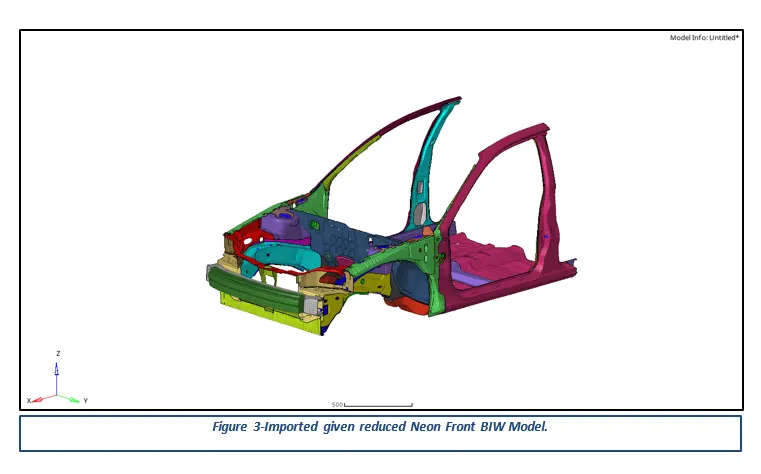
Figure 3-Imported given reduced Neon Front BIW Model.
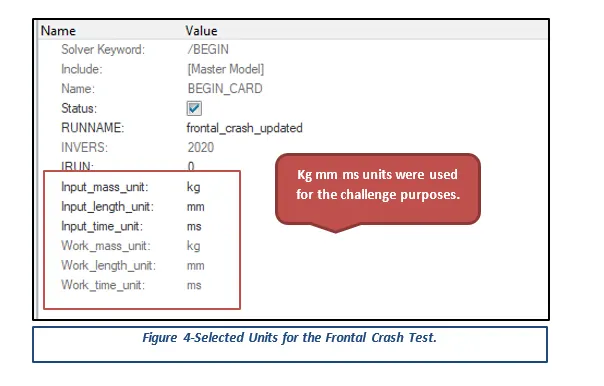
Figure 4-Selected Units for the Frontal Crash Test.
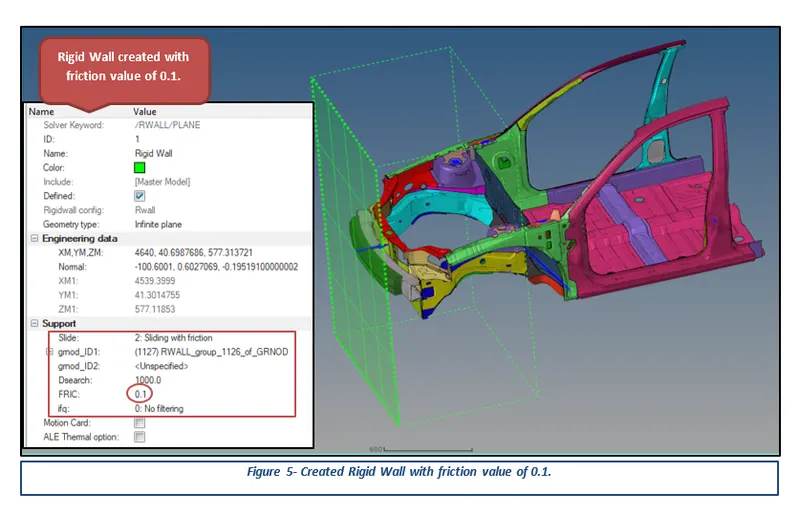
Figure 5- Created Rigid Wall with friction value of 0.1
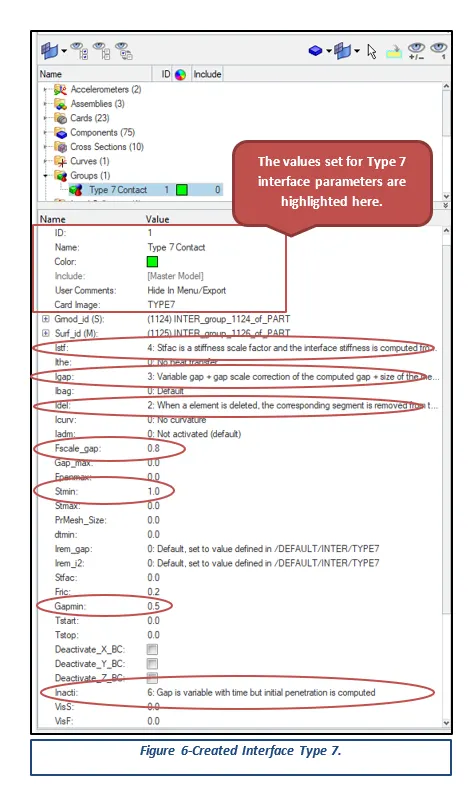
Figure 6-Created Interface Type 7.
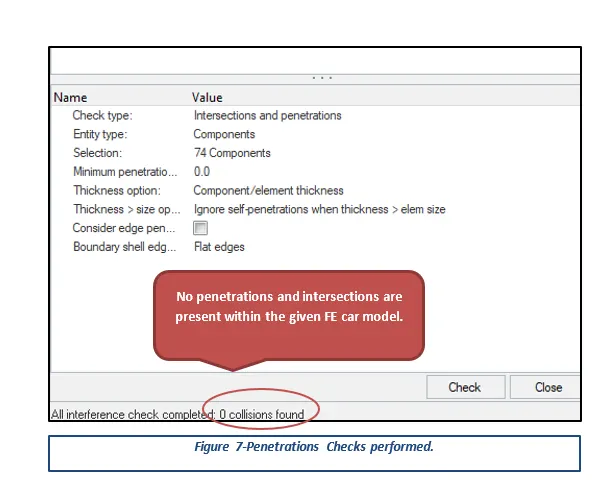
Figure 7-Penetrations Checks performed.
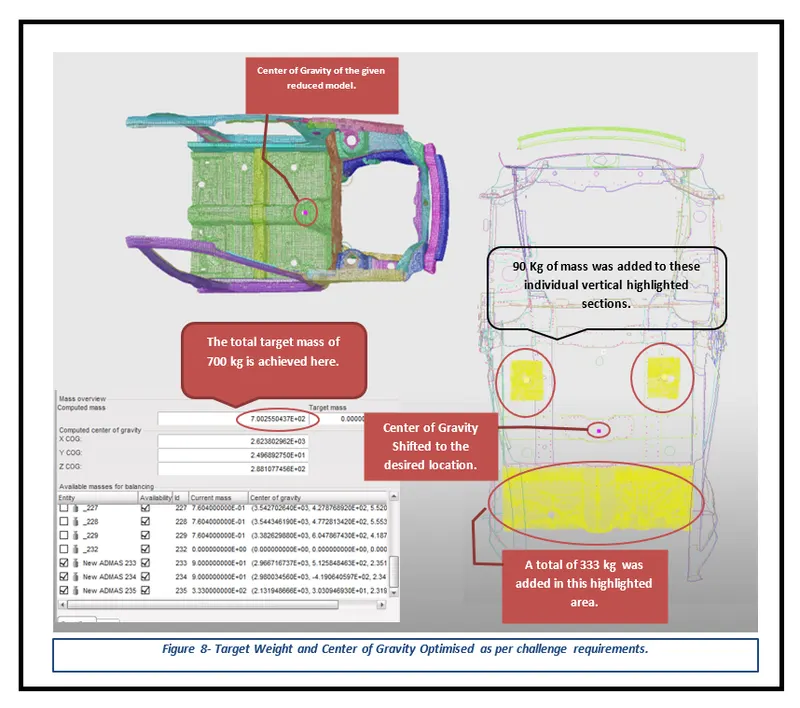
Figure 8- Target Weight and Center of Gravity Optimised as per challenge requirements.
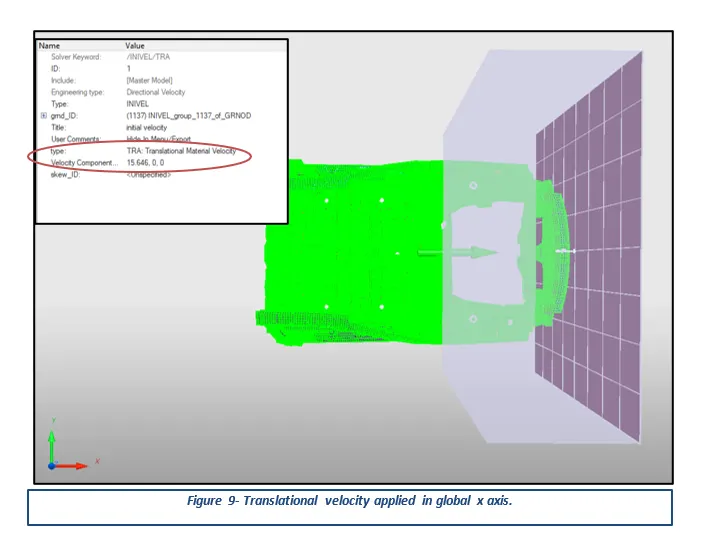
Figure 9- Translational velocity applied in global x axis.
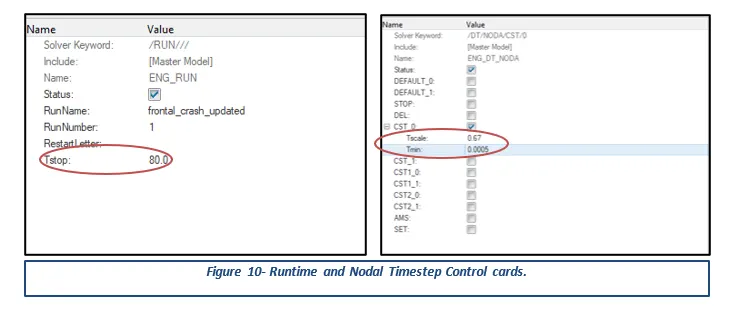
Figure 10- Runtime and Nodal Timestep Control cards.
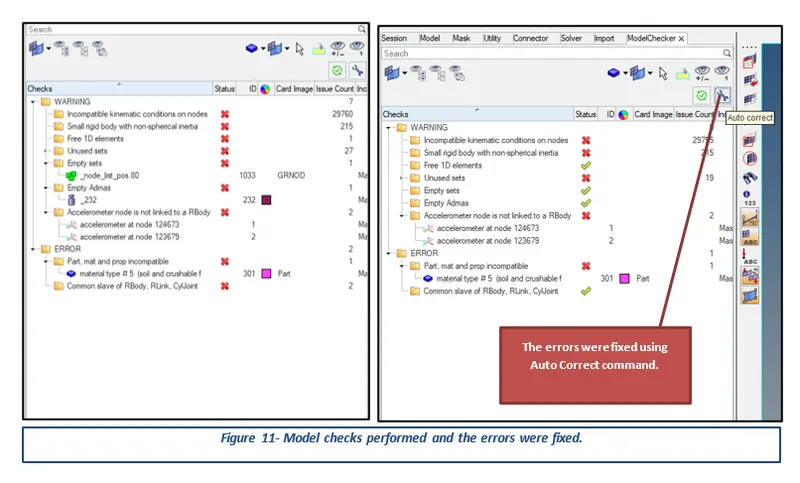
Figure 11- Model checks performed and the errors were fixed.
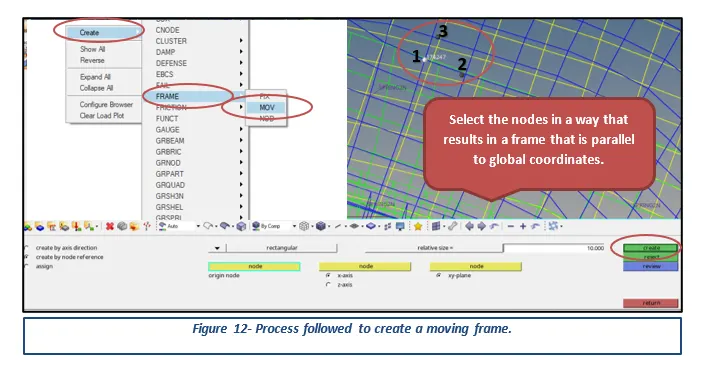
Figure 12- Process followed to create a moving frame.
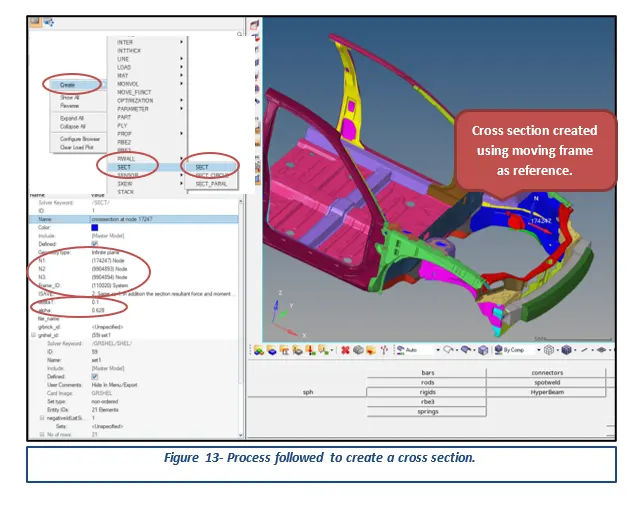
Figure 13- Process followed to create a cross-section.
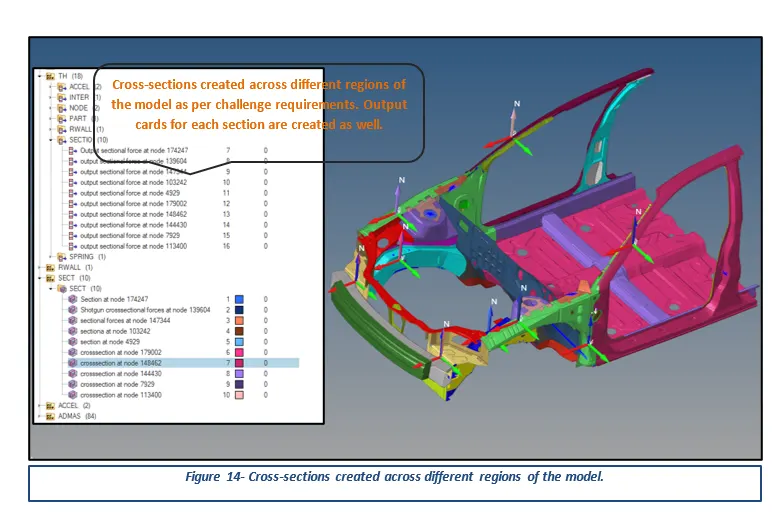
Figure 14- Cross-sections created across different regions of the model.
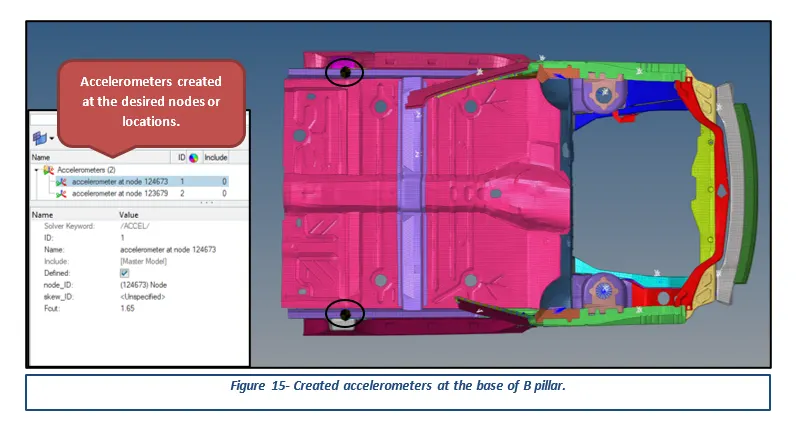
Figure 15- Created accelerometers at the base of the B pillar.
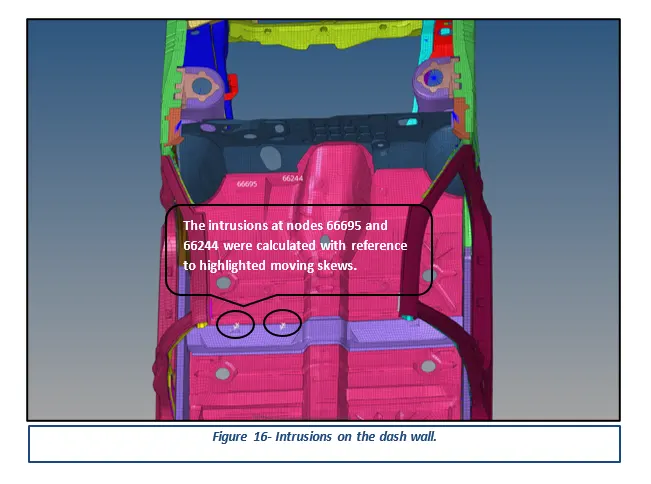
Figure 16- Intrusions on the dash wall.
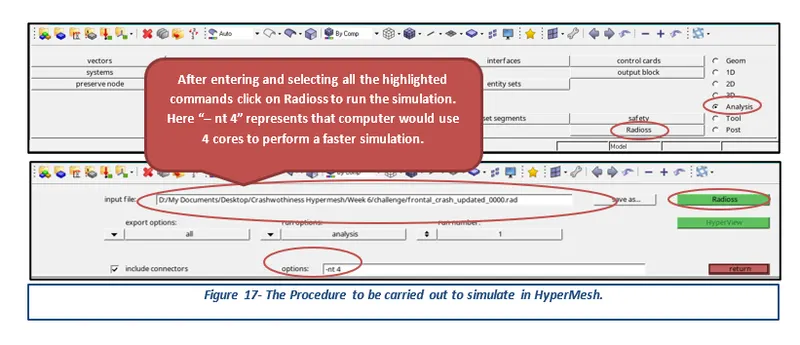
Figure 17- The Procedure to be carried out to simulate in HyperMesh.
Figure 18-Global Energy plots.
Figure 19-Energy and Mass Error Results.
Figure 20- Rails Sectional Forces Results.
Figure 21- Axial Force Results.
Figure 22- Shotgun Cross-sectional Forces Results.
Figure 23- A-Pillar Cross-sectional Forces Results.
Figure 24- Hinge Pillar Forces Results.
Figure 25- Accelerometer Readings over the simulation period.
Figure 26-Resultant Displacement Results of the nodes 66695 and 66244.
Table of Contents
3.3 Creating Input Deck for running simulation.
1 Introduction
HyperMesh is the market-leading, multi-disciplinary finite element pre-processor which manages the generation of the largest, most complex models, starting with the import of CAD geometry to exporting a ready-to-run solver file. HyperMesh supports a wide variety of CAD and solver interfaces, making it a perfect solution for most industry verticals and domains. With its advanced geometry and meshing capabilities, HyperMesh provides an environment for rapid model generation. Generating high-quality mesh quickly is just one of Hyper Mesh’s core competencies. For complex sub-system generation and assembly, HyperMesh has advanced model assembly tools. Modeling of laminate composites is supported by advanced creation, editing, and visualization tools. Design changes can be made easily via mesh morphing and geometry dimensioning.
Theory
A crash test is a form of destructive testing usually performed in order to ensure safe design standards in crashworthiness and crash compatibility for various modes of transportation or related systems and components.
Types:
- Frontal-impact tests: which is what most people initially think of when asked about a crash test. Vehicles usually impact a solid concrete wall at a specified speed, but these can also be vehicle-impacting vehicle tests. SUVs have been singled out in these tests for a while, due to the high ride height that they often have.
- Moderate Overlap tests: in which only part of the front of the car impacts with a barrier (vehicle). These are important, as impact forces (approximately) remain the same as with a frontal impact test, but a smaller fraction of the car is required to absorb all the force. These tests are often realized by cars turning into oncoming traffic. This type of testing is done by the U.S.A. Insurance Institute for Highway Safety (IIHS), EuroNCAP, Australasian New Car Assessment Program (ANCAP), and ASEAN NCAP.
- Small Overlap tests: This is where only a small portion of the car's structure strikes an object such as a pole or a tree, or if a car were to clip another car. This is the most demanding test because it loads the most force onto the structure of the car at any given speed. These are usually conducted at 15-20% of the front vehicle structure.
- Side Impact tests: these forms of accidents have a very significant likelihood of fatality, as cars do not have a significant crumple zone to absorb the impact forces before an occupant is injured.
- Pole-impact tests: A difficult test that places a large amount of force on a small proportion of the side of the vehicle.
- Roll Over tests: which test a car's ability (specifically the pillars holding the roof) to support itself in a dynamic impact. More recently, dynamic rollover tests have been proposed in lieu of static crash testing.
- Roadside hardware crash tests: are used to ensure crash barriers and crash cushions will protect vehicle occupants from roadside hazards, and also ensure that guard rails, signposts, light poles, and similar appurtenances do not pose an undue hazard to vehicle occupants.
- Old versus new: Often an old and big car against a small and new car or two different generations of the same car model. These tests are performed to show the advancements in crashworthiness.
- Computer model: Because of the cost of full-scale crash tests, engineers often run many simulated crash tests using computer models to refine their vehicle or barrier designs before conducting live tests.
- Sled testing: A cost-effective way of testing components such as airbags and seat belts is conducting sled crash testing. The two most common types of sled systems are reverse-firing sleds which are fired from a standstill, and decelerating sleds which are accelerated from a starting point and stopped in the crash area with a hydraulic ram. It can also be used to evaluate the whiplash protection of a vehicle's seat.
2 Aims
- Run frontal car crash simulation of the given model as per challenge requirements.
- Perform mass and energy checks and determine whether the results are acceptable or not.
- Plot and tabulate the Total number of cycles, Simulation Time, Rigid Wall Forces, Internal Energy, Hourglass Energy, Contact Energy, Total Energy results for the performed simulation and compare the results for the same.
3 Methodology and Results
The section describes the different stages that were performed using an engineering tool HyperWorks Radioss 2020 for the completion of the Assignment 6 Challenge. These stages can be further broadly sub-categorized into three key steps, starting from importing of cad model to creating simulation cards and finally performing the crash simulation to obtain desired results.
3.1 Importing of CAD Model
After opening the HyperWorks software, the first step is to select the Radioss profile and then open the given Neon Car FE CAD model. Since the HyperMesh student version has a node limit of 100000, the Neon Car BIW model was reduced to its half in order to perform the Front crash Simulation using the student version of HyperMesh.
3.3 Creating Input Deck for running simulation
In HyperMesh (Radioss), there are certain key cards that have to be defined in order to run a successful simulation and also to obtain the desired results. What follows hereafter is the images representing the created Input Deck along with the obtained results from the performed simulation.
After importing the given Neon Front Model in the HyperMesh, the first and foremost step is to set up the analysis units, Kg mm ms was chosen to be the most appropriate units for this challenge. The following figure illustrates the units selected for the crash test of the given model.
Rigid Wall: Rigid wall entities provide a method for treating a contact between a rigid surface and nodal points of a deformable body. The Radioss profile offers 5 distinct Rigid Walls cards and is of the following order.
- RWALL PLANE: Infinite Plane Rigid Wall
- RWALL CYL: Infinite Cylinder Rigid Wall
- RWALL SPHER: Spherical Rigid Wall
- RWALL PARAL: Parallelogram Rigid Wall
- RWALL TEHRM: ALE Infinite Rigid Wall with Thermal Conductivity
However, the RWALL PLANE card was selected for the challenge purposes and values set for the card parameters are presented in the following figure.
Interface: Interface TYPE7 is a multi-usage impact interface, modeling contact between a master surface and a group of slave nodes. Normally, the surfaces having a higher value of stiffness are taken as Master Surfaces while surfaces having lower stiffness are taken as slave surfaces. However, for this challenge, the same surfaces were assigned as both master and slave surfaces in order to avoid the penetration of the surfaces during the simulation. The created interface type 7 card is presented in the following figure.
Penetrations and Intersections: Penetrations and intersections play an important role in simulations. If any solver comes across this penetration or intersections, most of the time the solver stops or it produces unrealistic deformations.
Added Mass: Assign additional non-structural mass to nodes or a group of nodes. Optionally the total additional non-structural mass of a part of a group of parts can be defined (applied to shells and solids only) or a surface mass can be assigned to a surface and Radioss would then compute the added node-based mass value using area (volume) - weighted distribution. Since the challenge requirement was to compare the given reduced model with the original Neon car model, the weight of the reduced model was increased to 700 kg while getting the cog (center of gravity) of the required range. The added mass across different regions is illustrated in the following figure.
Initial Velocity: Initialize translational and rotational velocities on each node in the global or in a given coordinate system. A translational velocity of 15.646 mm/ms was applied to the given reduced model in the global x-axis and is illustrated in the following figure.
Nodal Time Step Control: The nodal time step control is activated for a simulation by using the option /DT/NODA/Keyword3/Iflag. With the time step of a node in the mesh defined as:
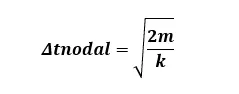
Where m: Nodal mass; k: Equivalent nodal stiffness
The total simulation run time was set to 80 ms while the nodal time step was chosen to be 0.0005 ms for the challenge purposes.
Model Checker: Model Checker is invoked by clicking Tools > Model Checker.
There are two levels of checks available:
- Model Checker – Elements check the quality of the elements.
- Model Checker – Solver checks the models for errors and warnings.
Sections: Sections are used to output the force and moment of a cross-section defined by a group of nodes and groups of elements. The following process was followed to create a section.
- The first step is to create a moving frame and select the appropriate nodes for both origin and plane parallel to the global coordinate system.
- The next step is to create a section and assign the created moving frame to the Frame_id parameter and assign at least 2 or 3 rows or columns of elements to grshel_id parameter along with assigning appropriate values to delta T and alpha parameters.
Accelerometer: The accelerometers were created by selecting appropriate nodes at the desired locations and are displayed in the following figure. In addition, the output cards were created for each accelerometer.
Intrusion: In the field of automotive engineering, intrusion describes a situation in which an automobile engine or other vehicle component penetrates the space of another allocated part or component. The intrusions at nodes 66695 and 66244 on the dash wall were calculated for the challenge purposes.
The crash simulation can be performed using the following process.
- Go to Analysis Deck -> Select Radioss -> Change Input file to Fontal_crash_updated_0000 -> Select all for Export options -> Analysis for Run Options -> Select 1 for the Run number -> Tick include connectors -> Enter “-nt 4” for the options -> Hit Radioss to run simulation.
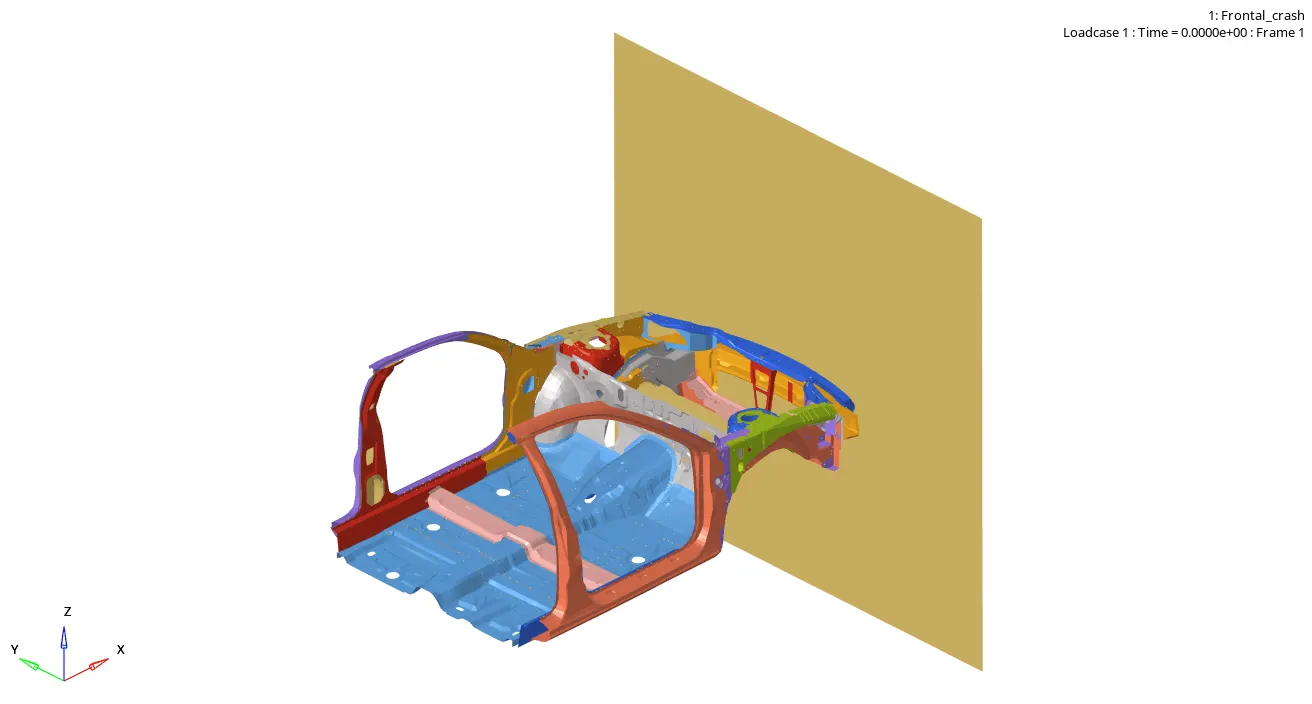
Results of the Frontal Car Crash Test
To visualize the simulation, either split the graphic interface into two to open the Hyper View utility or open the Hyper View window from the Post toolbar. Import the “h3d” file generated by the Radioss from the saved directory and then visualize the desired results using relevant commands. To plot rigid wall forces or other global forces, open the HyperGraph 2D interface and import the “T01” file, and plot the desired graphs.
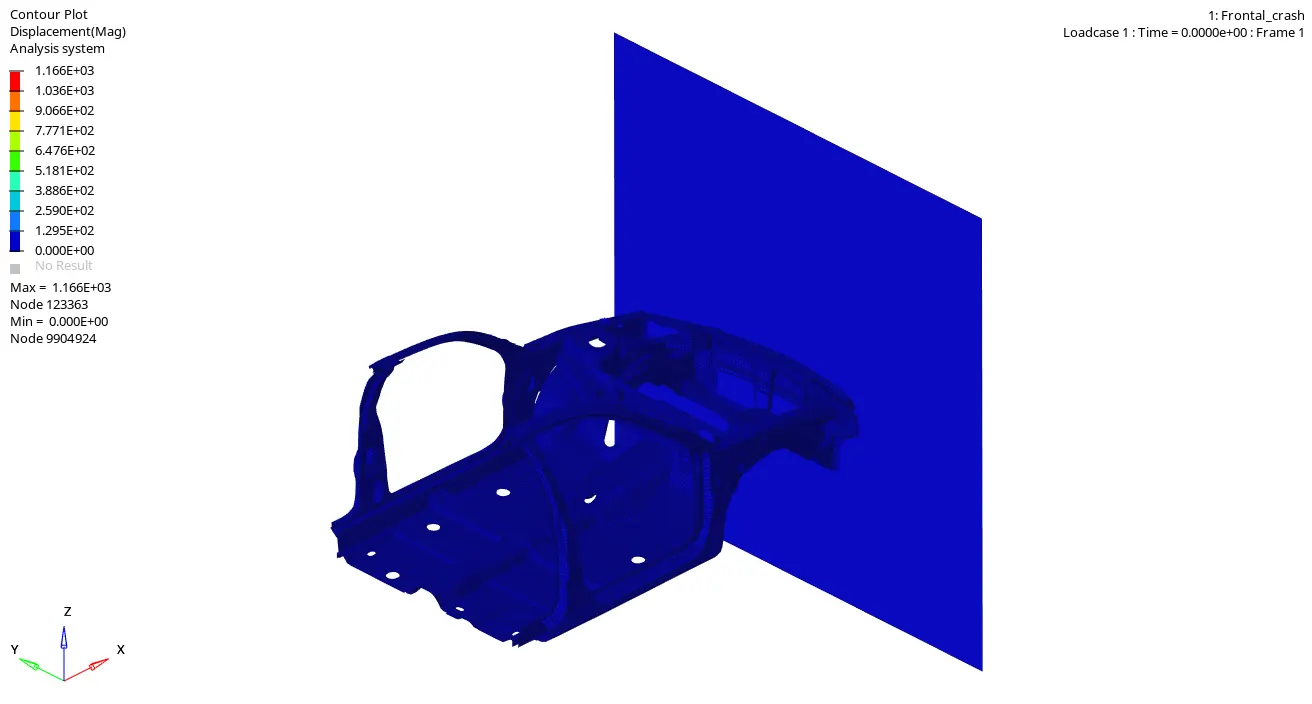
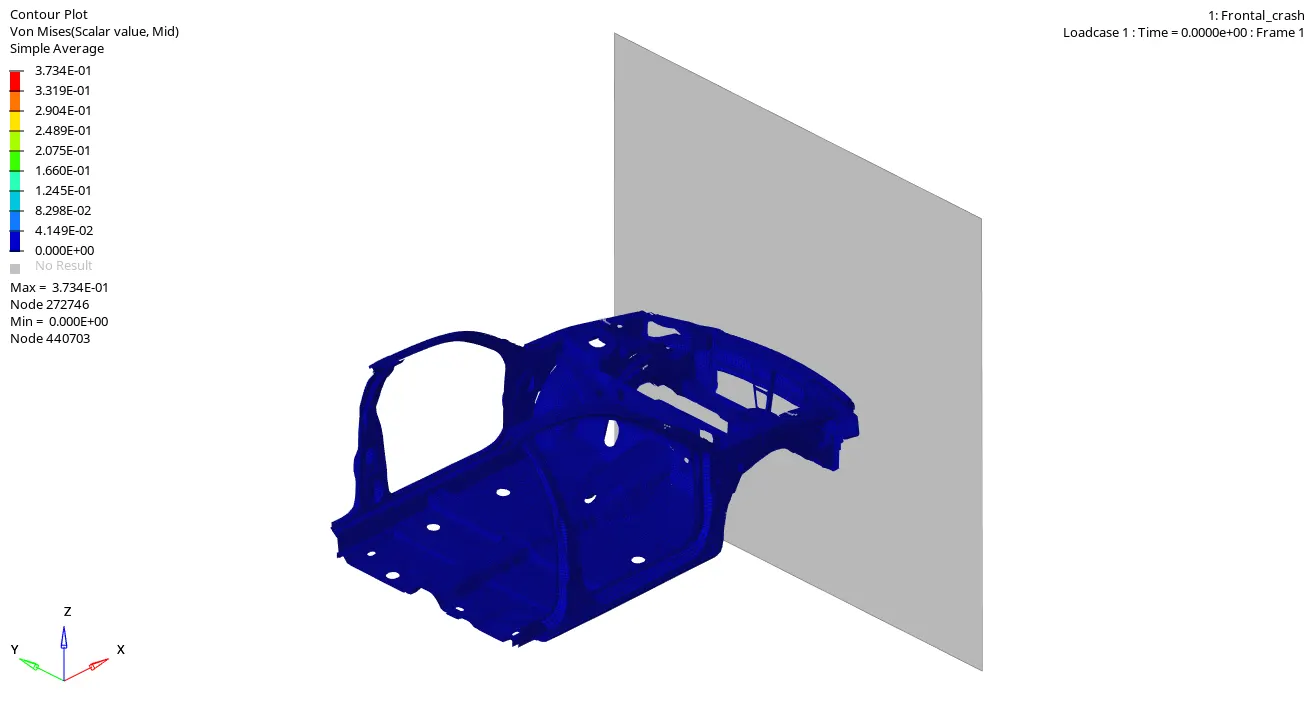
From the simulation results, it was observed that the maximum displacement of value 1166 mm appeared at node 123363 while the maximum stress of value 373.4 N has occurred at node 272746 of the given car reduced model.
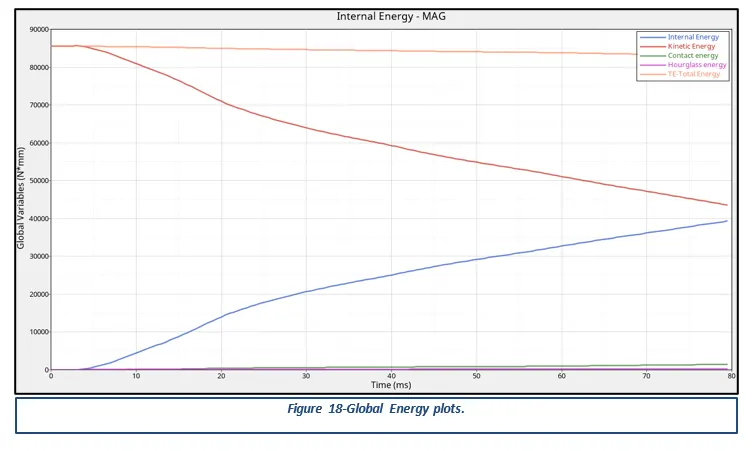
The Total Energy reported by Global variables in Radioss is the sum of internal energy, kinetic energy, contact (sliding) energy, hourglass energy system, damping energy, and rigid wall energy. From Figure 18, it can be seen that at the time of impact (t=0 ms) kinetic energy is maximum and internal energy is minimum but with an increase in time there is a reduction in kinetic energy while there is an increase in internal energy of the system and after that both energies become constant. This validates the principle of conservation of energy which states that energy can neither be created nor destroyed but can be converted from one form of energy to another.
Mass and Energy Error Results:
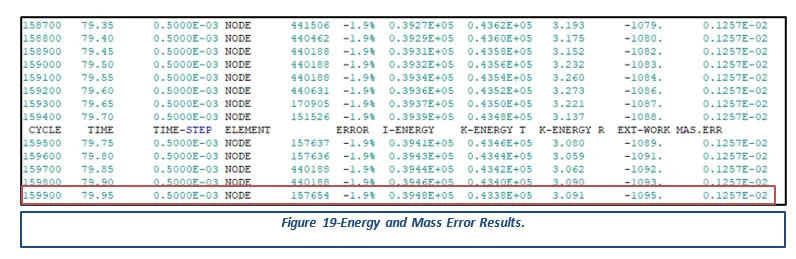
The Energy error should be negative and decrease with the iterations. Ideally, the error should be at most -15% and better to have 5%. The closer to 0% error the better. The Mass error of less than 2% is preferred for the crash simulations. From Figure 19, it can be noted that the simulation yields an Energy Error of -1.9% which is close to 0 and therefore acceptable. However, the Mass error generated by the simulation is 0.001257% and it falls within the acceptable range.
Results of Sectional Forces in the Rail components:
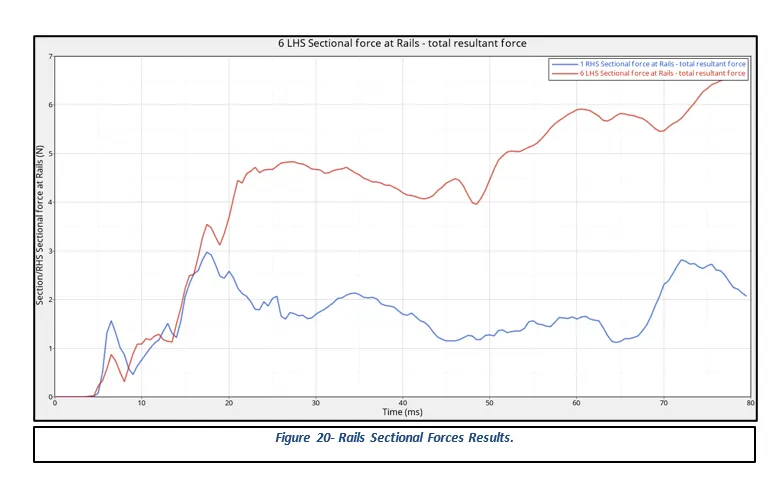
From Figure 20, it can be seen that the sectional forces generated in the left rail component are significantly high in comparison to the sectional forces generated in the right rail component of the given reduced car model during the frontal crash simulation. This can also be interpreted as the left side components of the car would endure a larger amount of force and can potentially cause injuries to the driver.
Results of Axial Force received on the Rails from Bumper:
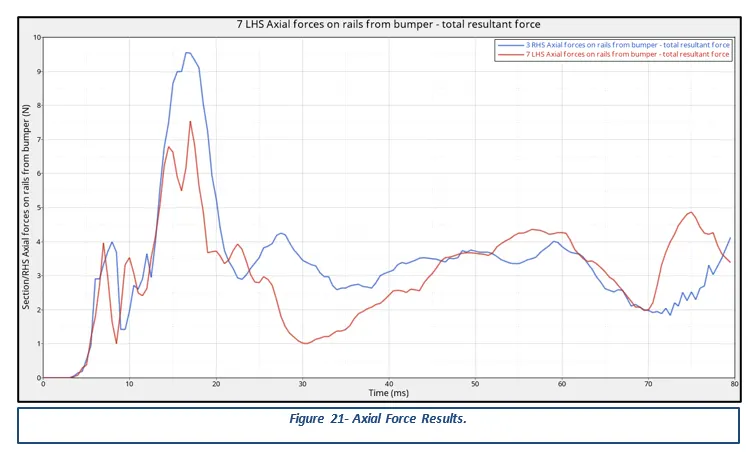
From Figure 21, it can be noted that the forces exerted by the Right bumper on the Right Rail component are higher at the beginning of the simulation while the forces exerted by the Left bumper on the Left Rail are higher at the end of the simulation. However, the overall forces experienced by the right rail component from the bumper over the period of simulation are high in comparison to the left rail component.
Shotgun Cross-sectional Forces Results:
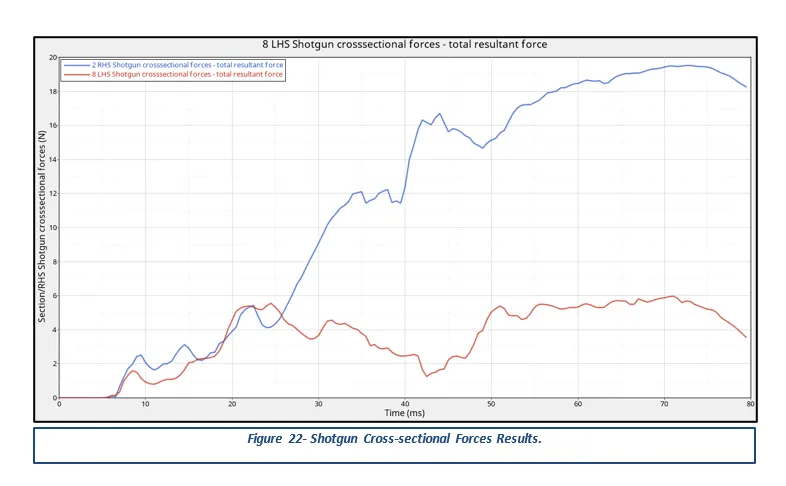
From Figure 22, it can be observed that the forces generated in the Right Shotgun cross-section during the frontal crash test are significantly high in comparison to the forces generated in the Left Shotgun section. This can be interpreted as the forces experienced by the passenger would be higher in comparison to the driver.
Results of Sectional Forces in the A-Pillar components:
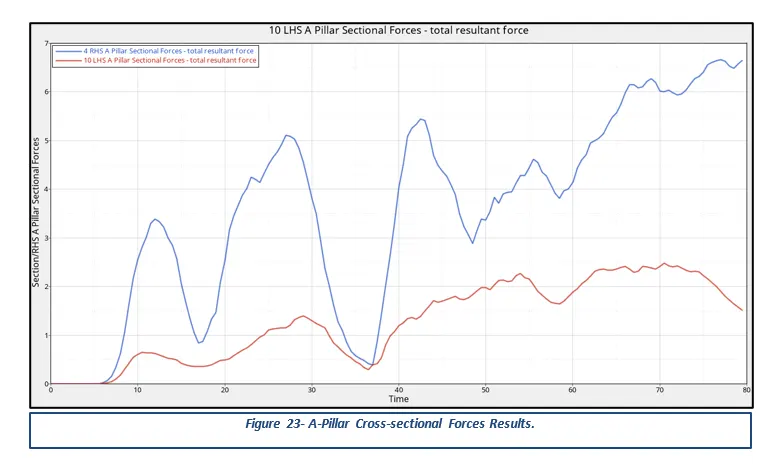
From Figure 23, it can be observed that the forces generated in the Right A-Pillar cross-section during the frontal crash test are significantly high in comparison to the forces generated in the Left A-Pillar section.
Hinge Pillar Cross-Sectional Forces Results:
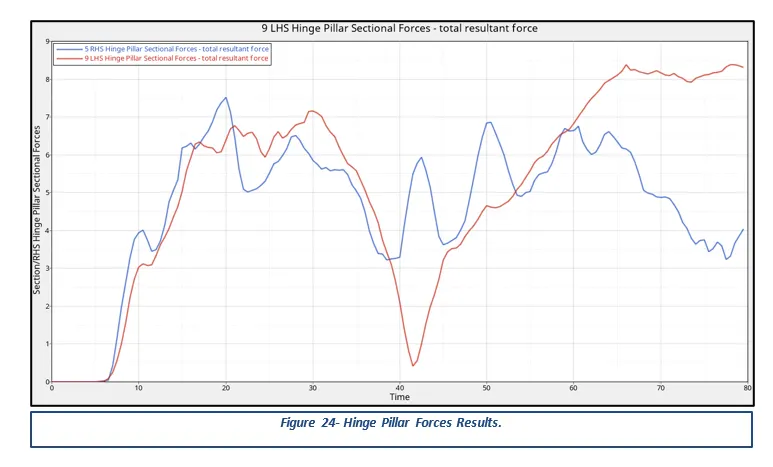
From Figure 24, it can be noted that the forces generated in the Left Hinge Pillars are higher at the beginning of the simulation while the forces generated in the Right hinge Pillars are higher at the end of the frontal crash simulation.
Accelerometer Results:
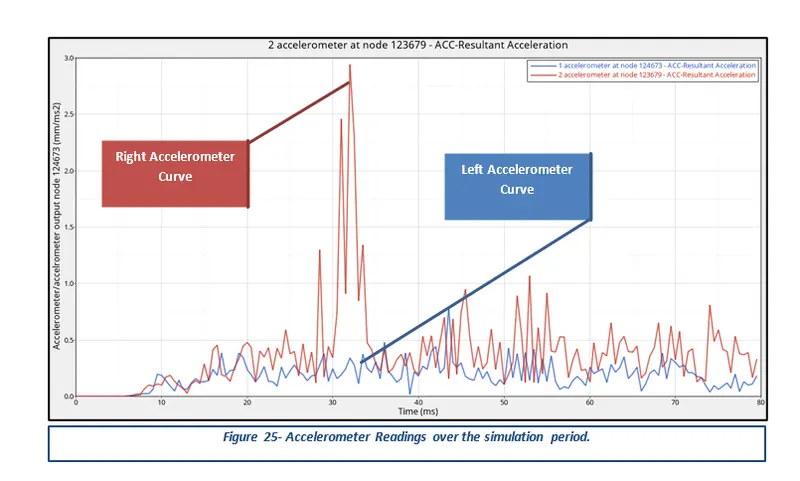
From Figure 25, it was observed that the maximum acceleration achieved in the right accelerometer was 2.94 mm/ms2 at 32 ms while the maximum acceleration achieved in the left accelerometer was 0.78 mm/ms2 at 43.5 ms.
Intrusions Results:
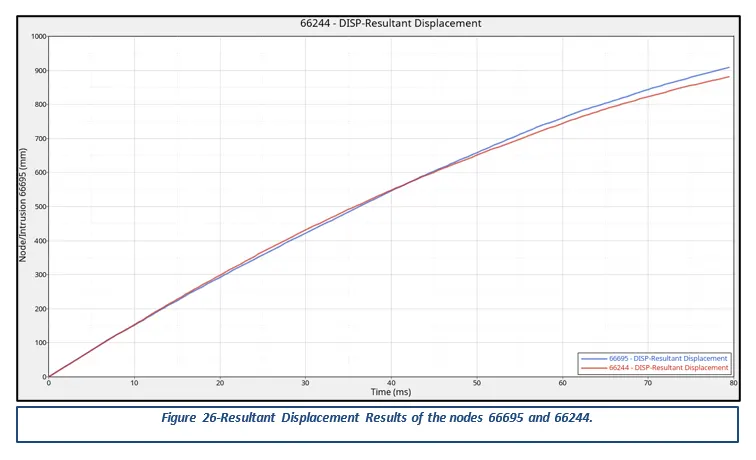
The maximum resultant displacement that occurred at node 66244 is 881.2 mm while the maximum resultant displacement that occurred at node 66695 is 909.5 mm. The distance between node 66244 and its respective skew is 793.68 mm while the distance between node 66695 and its respective moving skew is 767.27 mm. Thus,
Intrusion at node 66244 = 881.2 – 793.68 = 87.52 mm
Intrusion at node 66695 = 909.5 – 767.27 = 142.23 mm
4 Conclusion
In conclusion, the main aim of assignment 6 was to perform a frontal crash simulation of a reduced Neon Car Model. In addition, perform mass and energy error checks and determine whether the results are acceptable. Lastly, plot global energies and required cross-sectional forces plots across different sections of the components and compare the obtained results for the same.
It was found that the energy error generated by the simulation was -1.9% while the mass error generated was 0.001257%. It was also observed that the maximum displacement. It was also observed that the maximum displacement of value 1166 mm appeared at node 123363 while the maximum stress of value 373.4 N occurred at node 272746 of the given car model.
However, there was a significant difference between the results of cross-sectional forces obtained at different locations of the car model. This could be essential due to neglecting of z coordinate of Cog (center of gravity) while adjusting it to the desired location for the given reduced car model.