Frontal Crash of a NEON Dodge Model in FMVSS Regulation
AIM :
To perform Car frontal crash analysis on the given BIW component by creating deck setup with the following objectives given below in hypermesh/hypercrash and request for time history plots to study the BIW model behaviour after crash simulation.
OBJECTIVE:
- Check unit system, which has to be followed in [Kg mm ms].
- Create appropriate interface with friction 0.2 and recommended parameters (TYPE 7)
- Make sure of no penetrations, intersection and flying parts exist in the model.
- Check all rigid bodies in the model and rectify if there are any issues.
- Create rigid plane wall with friction 0.1.
- Compare the model and use added masses to reach target weight 700kg while getting Centre of Gravity about the required range.
- Initial velocity of the car has to be 35 mph.
- Use model checker to check for errors in the model to ensure good quality
- Time-step has to be in between 0.5 to 0.1 microseconds.
- Run the simulation for 80 ms.
Note : Due to the limitations to the usage of no.of nodes in the student version we import the reduced model instead of full body by removing some components.so result may not be considering for real life senarios.
PROCEDURE :
- Importing the BIW model using solver desk in hyermesh
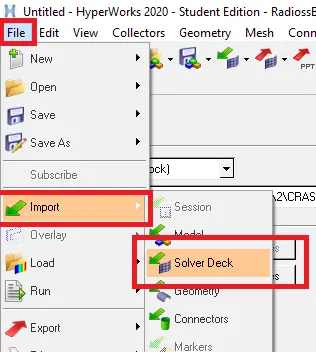
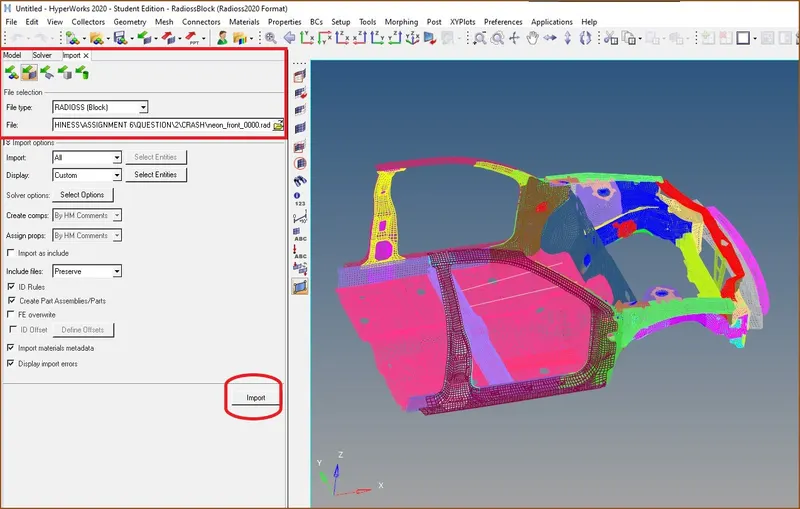
To import the given model we will select import solver deck in the import tab, then we will select the file we wish to import in this case we select neon_front_0000.rad file under RADIOSS block.after importing we can see the model appears in wireframe mode which we can turn it into shaded mode.
- Check unit system and either follow[Mg mm s] or [Kg mm ms].
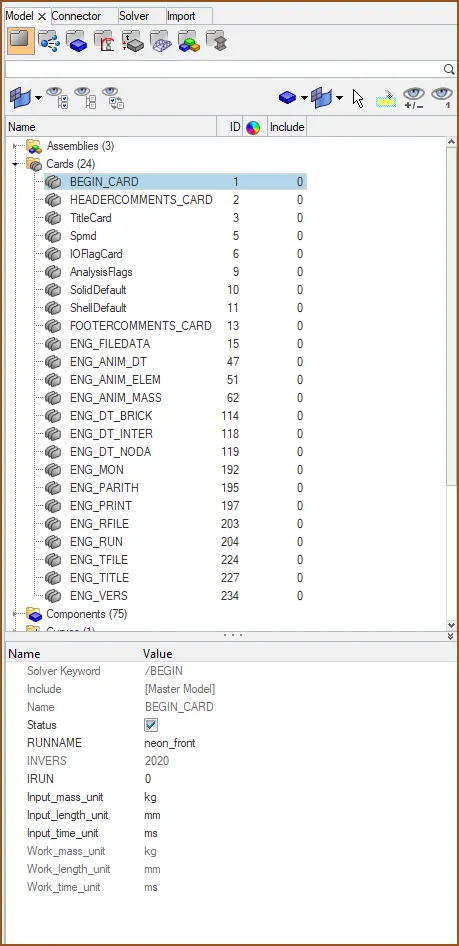
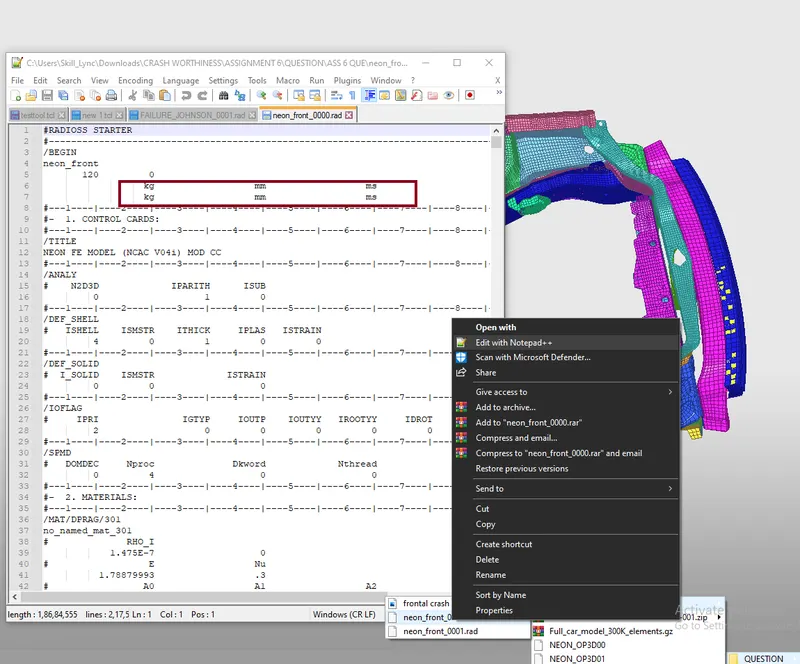
we can assign all the boundary conditions,sections,masses to the model in hypermesh/hypercrash.here we imported the model we got and found out that the unit system assigned to the model is in kg,mm,ms by checking the BEGIN_CARD under cards in the Model tab as shown. so we will keep it without making any changes to it and follow the same units through the simulation process.to cross-check we can open the input rad file in notepad to see the units system.
- Make sure of no penetrations and intersection.
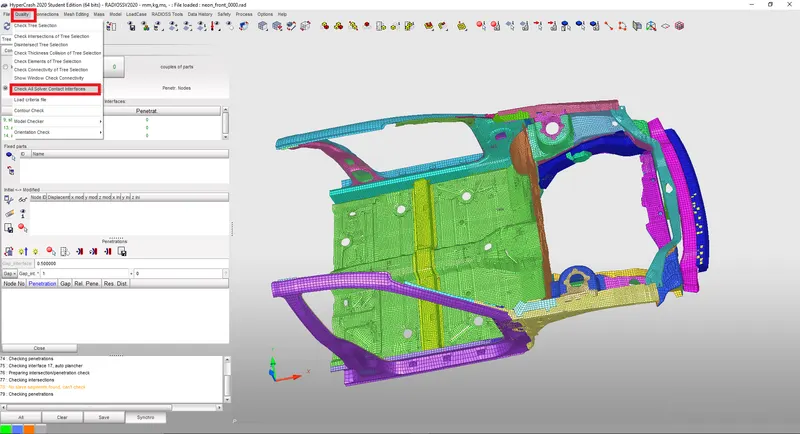
now the next step after importing the model is to check if there is any Penetrations and intersections that are presented in the model that should be removed from the model with Quality>Check All Solver Contact Interfaces in Hypercrash.
Initial mesh intersections create unrealistic connections. Moreover, this can cause locking situations leading to computation failure. Initial penetrations are due to the interface gap definition. They lead to unrealistic and uncontrolled internal forces which may cause local plastic strains in the beginning of the computation. The structure is then locally less stiff.
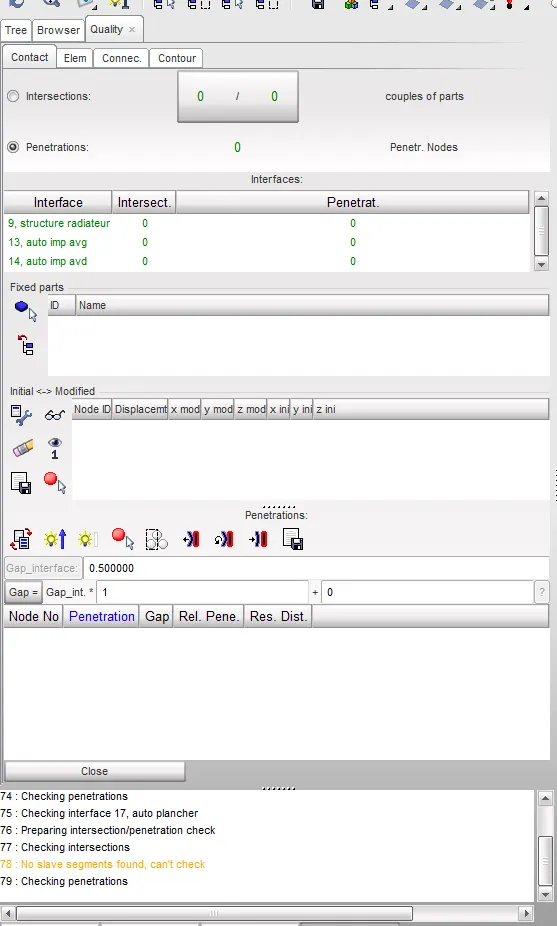
in the below image we can see that the contact tab shows there is no intersections and penetration present in the model.now we will proceed with assigning the initial velocity for the model.
- Initial velocity 35 mph.
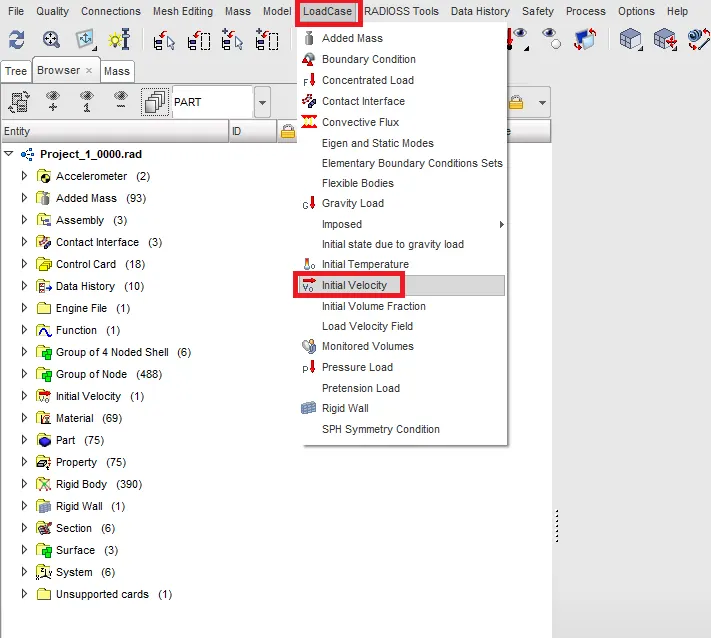
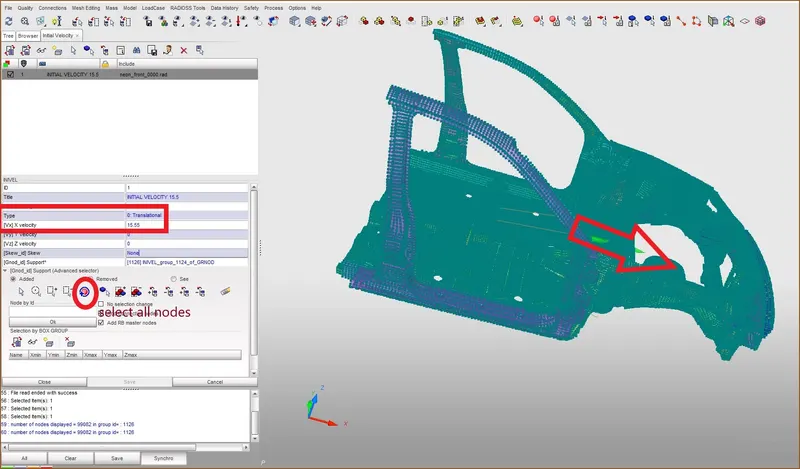
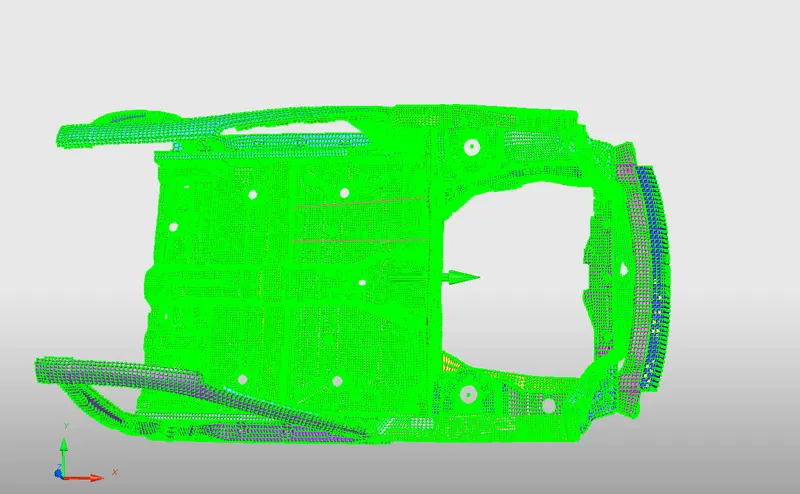
To create initial velocity we will select the load case tool and choose the initial velocity in that which will create a entity of initial velocity in the browser tab. by selecting the tab we can assign the numerical value of the velocity we need. in this we need a initial velocity of 35miles per hour. since our unit system is different, we cannot put the same value we need to convert that value into our required unit system i.e.,15.55 mm/ms.
after specifying the velocity in terms of mm and ms we need to assign this velocity to all the nodes that present in the car model for that we select all the nodes at once that present in the model and we specify the direction and translation to the nodes as shown in the below image.the arrow mark shows the direction of velocity in which the car body moves.
- Compare the model weight with the full scale 300k nodes model and use added masses to reach target weight 700kg while getting CG about the required range.
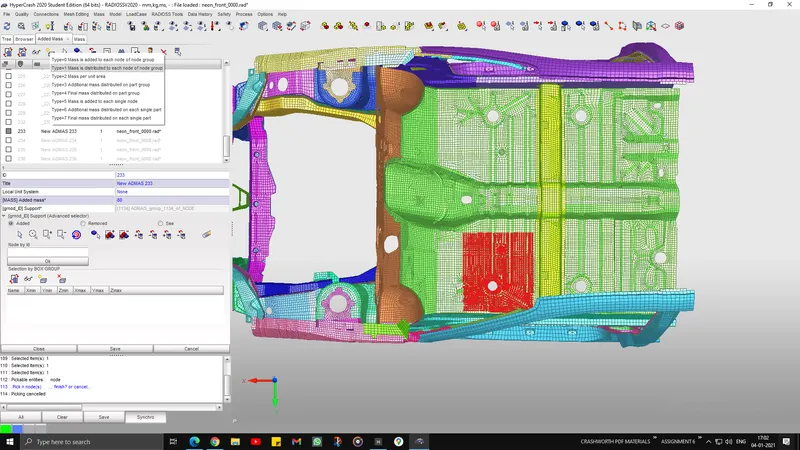
since we use only front portion of the BIW frame which weighs of 189kgs to reduce computational time and cost, we need to add additional mass to the model give to us in order to make it a full scale model i.e., by making its total mass as 700kg through balancing the center of gravity,in this model we have to place ,masses in such a way that the CG point should lie in the middle i.e, at the right side of drivers seat.
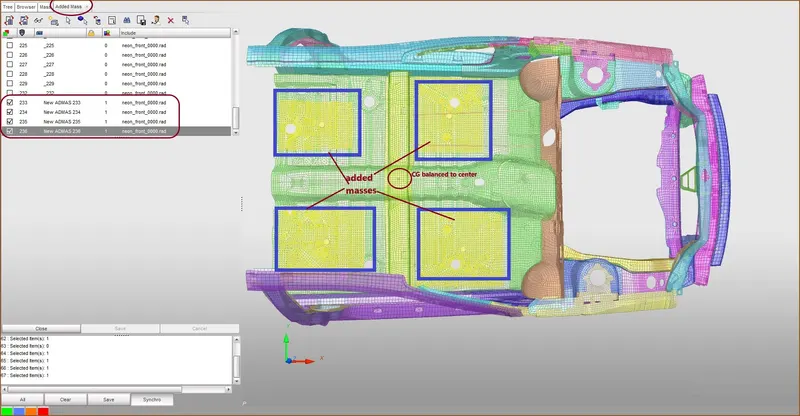
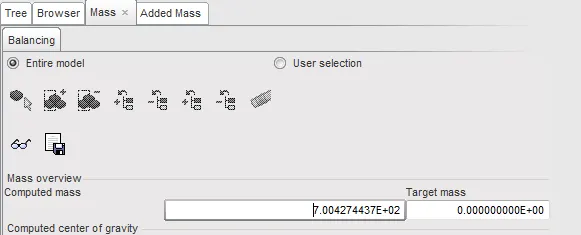
below image shows that we have reached the target of 700kN of total mass of the body.
- Create appropriate interface ,friction 0.2 and recommended parameters.
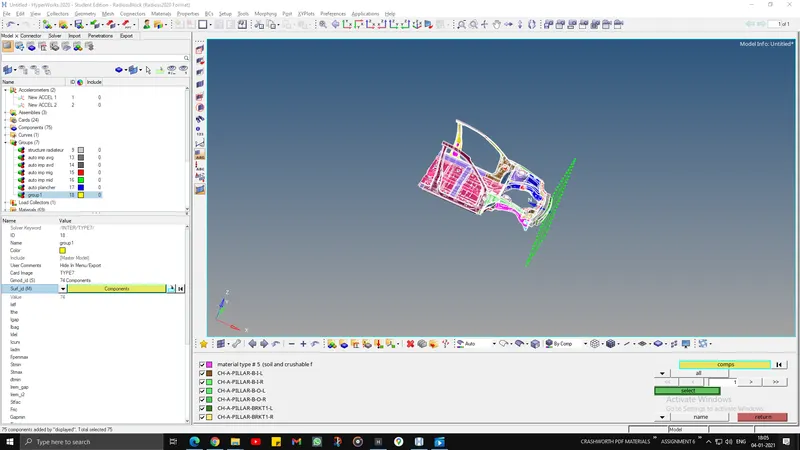
Interfaces are defined to model how parts interact when they come into contact with each other.In frontal impact test the car body is going to impact the rigid wall woth high velocity hat tends to crushing so we need to define suitable interface for slave and master nodes.in this case the rigid wall is considered master and the car component is considered to be slave and then while deforming the car component might come to self contact so we need to choose the elements and nodes of the car body as both master and slave and create a seperate interface,hence a multi-purpose contact (TYPE7) is defined in the model.Type 7 is a global contact interface which takes self contact or penetration of the BIW parts during impact with the rigid wall.
Interface TYPE7 is a multi-usage impact interface, modeling contact between a master surface and a group of slave nodes. It is also possible to consider heat transfer and heat friction.
- A node can at the same time be a slave and a master node.
- Each slave node can impact each master segment; except if it is connected to this segment.
- A node can impact on more than one segment.
- A node can impact on the two sides, on the edges and on the corners of each segments.
- It is a fast search algorithm without limitations.
- Time step is reduced in case of high impact speed or contacts with small gap.
- It does not work properly if used with a rigid body at high impact speed or rigid body with small gap.
- It does not solve edge to edge contact.
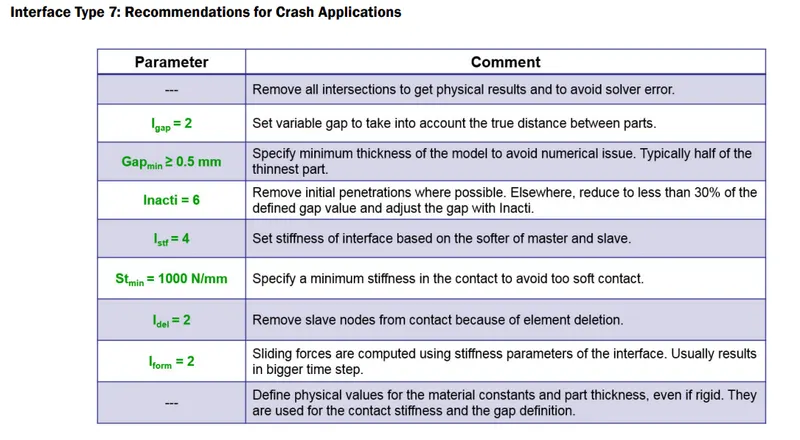
Parameters which control type 7 card
- Igap - determines how the size of the gap is calculated
-
Gapmin Minimum gap for impact activation - Inacti - Action to be taken if initial penetration exist
- Istif - affect how stiffness of the interface is calculated
- Iform - Friction formulation is of two types( Viscous and stiffness type) . The laer is used normally for structural analysis.
- Istif - The minimum stiffness is controled here
- Idel - If elements are attached to a deleted slave node this option specifies what is to be done to control it
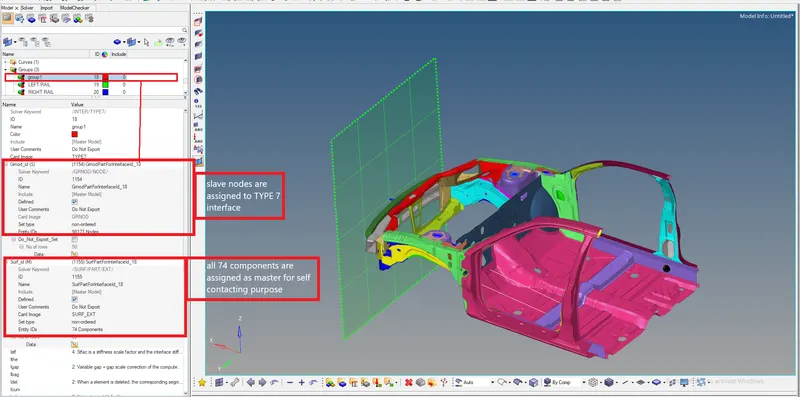
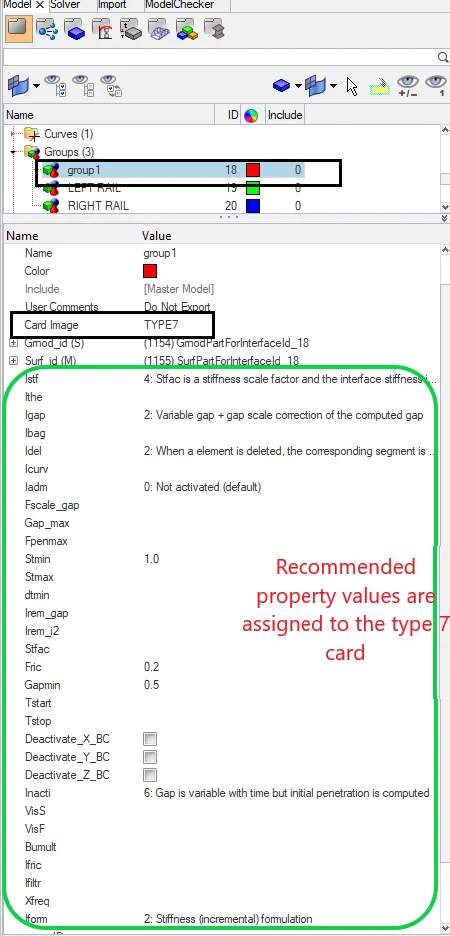
- check all the rigid body connections
Here we will check all the rigid body connections in the model by visual inspection by simply moving and panning ,rotating the model to check if all the surfaces and components are connected properly or not , Any two surfaces that have a gap between them must be connected using either Rigid Body connections or even springs in some cases.
In case we get two surfaces, where the contact is not appropriately defined, we then need to add a Rigid body Element or maybe a Spring Element.for now there is no changes were made in this challenge model since all the connection are seemed to be propely connected.
- Create rigid wall with friction 0.1.
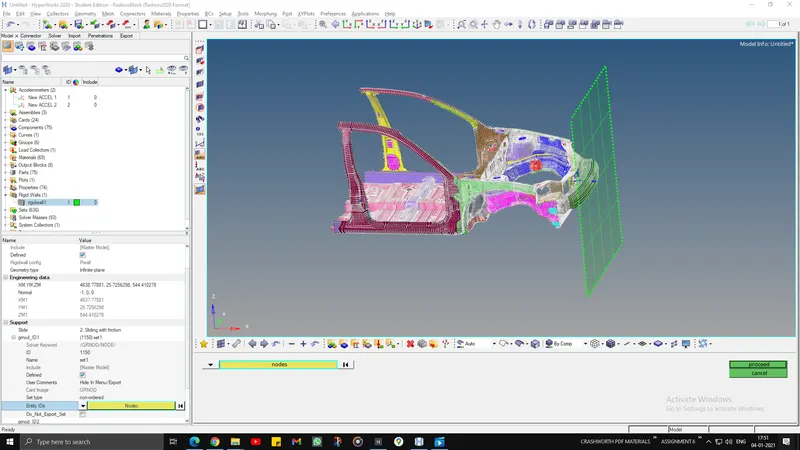
Rigid wall is an entity which is used to define an interaction between non-deformable and a deformable entity.nothing can go beyond the rigid wall.it has multiple types they are inifinite plane,infinite cylinder,spherical and parallelogram,the term infinite means that,if a rigid wall is created in YZ plane,then that whole particular plane is taken as a rigid wall. for now we will create a rigid wall of infinite plane by right clicking on the solver->create->rigid wall and we specify the friction value of 0.1.
the slave nodes for the rigid wall can be defined either as a node group or as Dsearch i.e, taking all the nodes as slaves which are present inside the mentioned search value or we can select and assign paticular group of nodes as slaves in the engineering data tab.
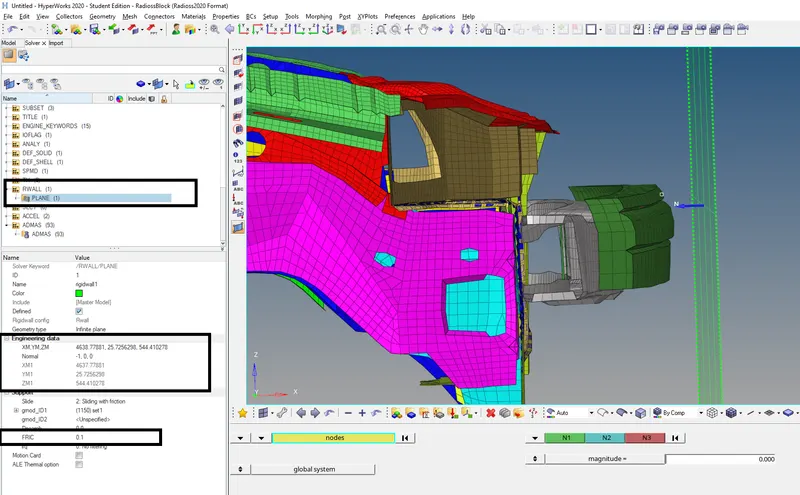
The XM,YM,ZM as shown above in the image are the coordinates where the rigid wall must be located.Normal is in which direction the RWALL must be faced.here the normal is positioned (X,Y,Z) = (-1,0,0) like its facing in the negative X axis.
- Sectional force in the rails at location of indicated node 174247.
To study exact forces at particular parts of the model we create cross-sections.the first step to create a cross section is to create a skew at the place where you want to read the sectional force.
Here we need to create a sectional force in the rail at location of node 174247,to find and mark the node we will press shift+F2 which will prompt us to temp nodes panel,there we need to search the node by ID as shown below.

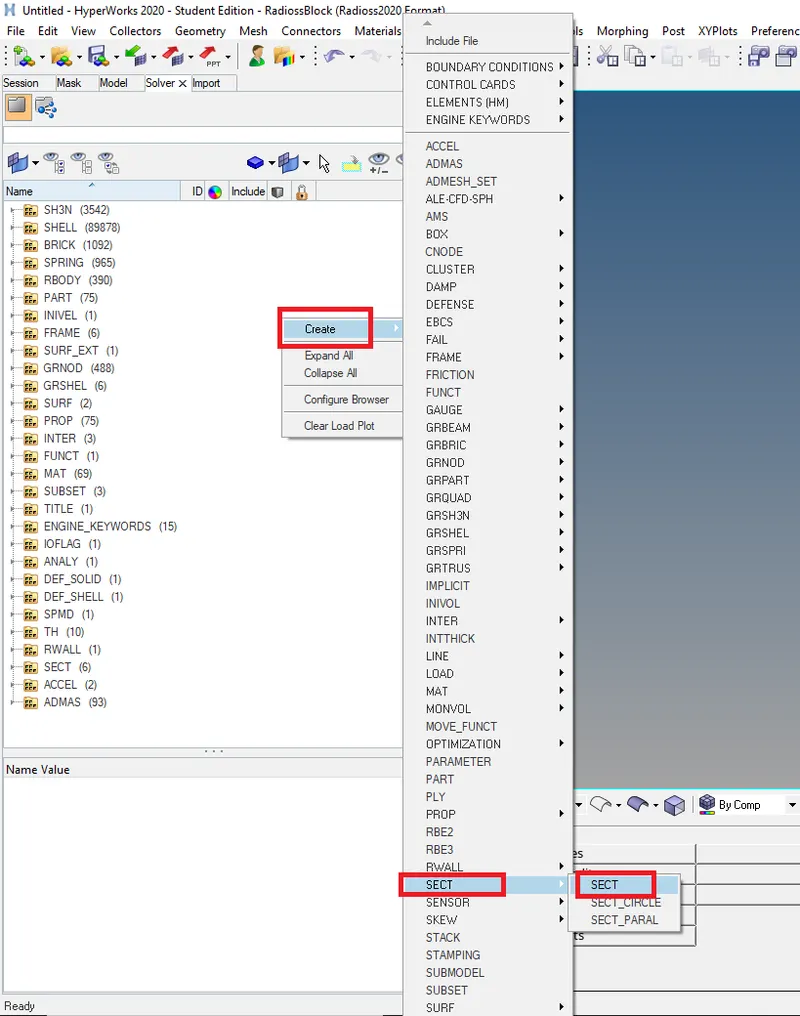
after entering the node id we will be knowing where the node is then we will make a temp node on that node ID.now we will define the section,to create the section make a right click in the emptry space in solver tab then select create-skew-move.
after creating skew we will define the nodes on which we need the skew system
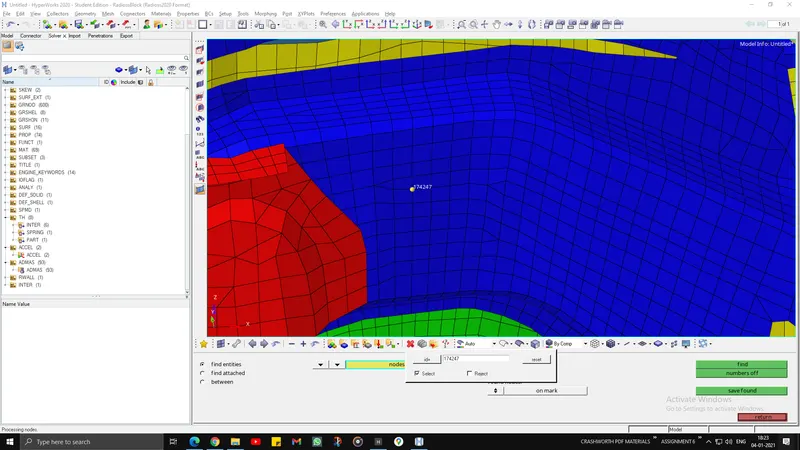
after marking with temporary node we will proceed with creating sections.we make skew before creating a section,to create skew right click on the empty space or on the tree section under SOLVER tab select CREATE>SKEW>MOVE.then we have to select three nodes to define the skew system. which creates a moving skew
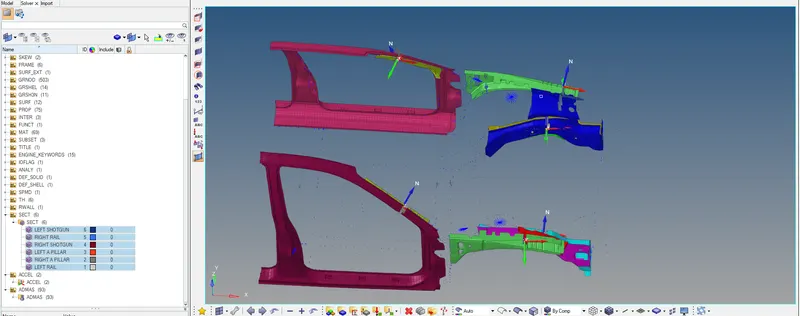
- Creation of Sections at A Piller,B Piller ,Shot Gun,rails and the Bumper in order to Study the sectional forces.
A section is a set of nodes and a set of elements. A section is a cut in the structure, where forces, moments or energy will be computed and stored in output files (using /TH/SECTIO). This is used to create a cross sectional area for the group of nodes/elements to observe the forces acting on the area. This is done by creating a local coordinate system with the nodes specified.
- Acceleration curve received on the accelerometer at base of B pillar (on B pillar rocker).
Accelerometer is an electromechanical device used to measure acceleration forces. Such forces may be static, like the continuous force of gravity or, as is the case with many mobile devices, dynamic to sense movement or vibrations. Acceleration is the measurement of the change in velocity, or speed divided by time.
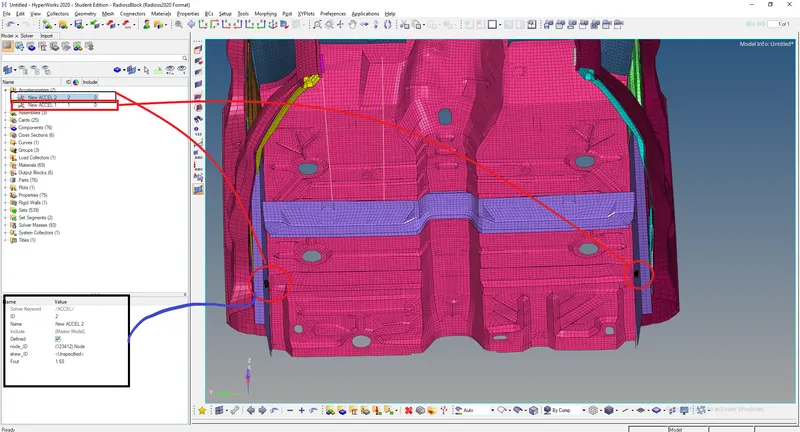
Here in order to check the accelertaion of the nodes at the B piller,we are providing the Accelerometer.
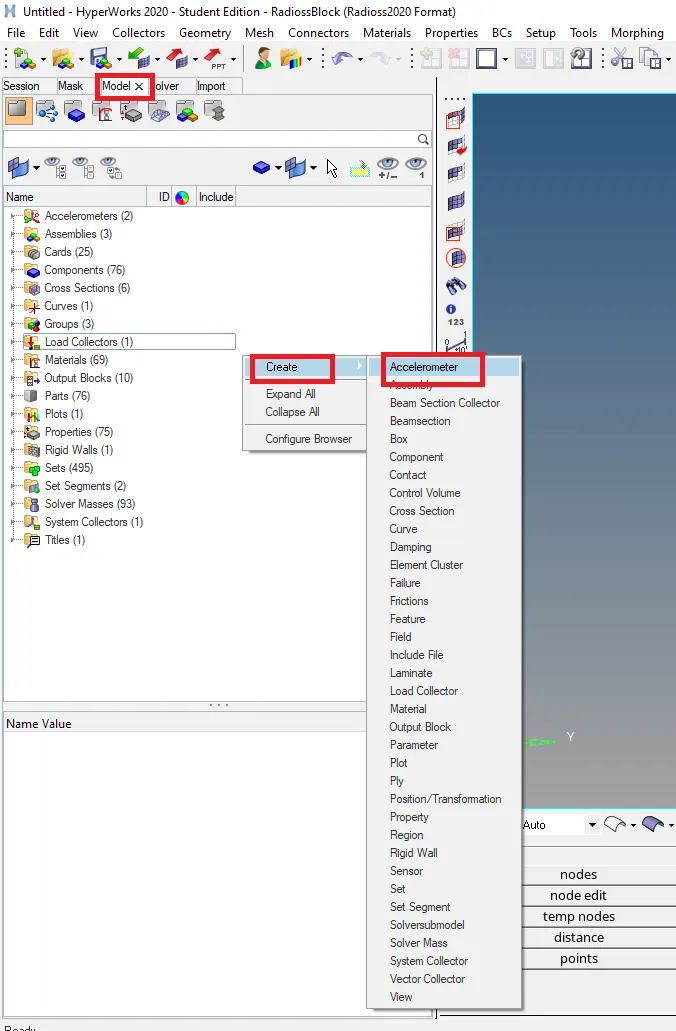
To create an Accelerometer at base of B pillar in the model we need to right click in the empty space in the model tab and then choose to create>accelerometer.then we need to specify the Node on which we want the accelerometer to be. i.e., at the base of B-pillar, we place the Accelerometer at one of the nodes under the B-pillar in the main body.
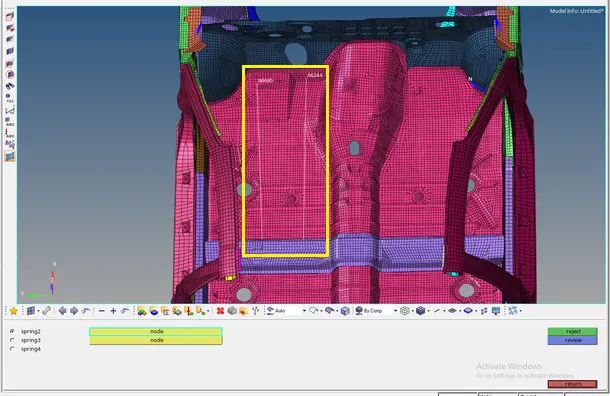
- Intrusions on the dash wall 66695,66244.
Intrusion in the sense says how much displacement the driver is facing near the brake and acceleration pedal. For this, we introduce 2 points on the dashboard with node number 66695 and 66244 and then calculate the displacement of this intrusion based on the forces received after impacting the rigid wall.
To Check the Intrusion at the given Nodes,we create a Spring by going to 1D>Springs>Nodes at by selecting the nodes later then we apply suitable Spring Properties and request output in the TH File.so that we can measure the intrusions on that node and see how the node behaves under the forces that are being acted upon it.
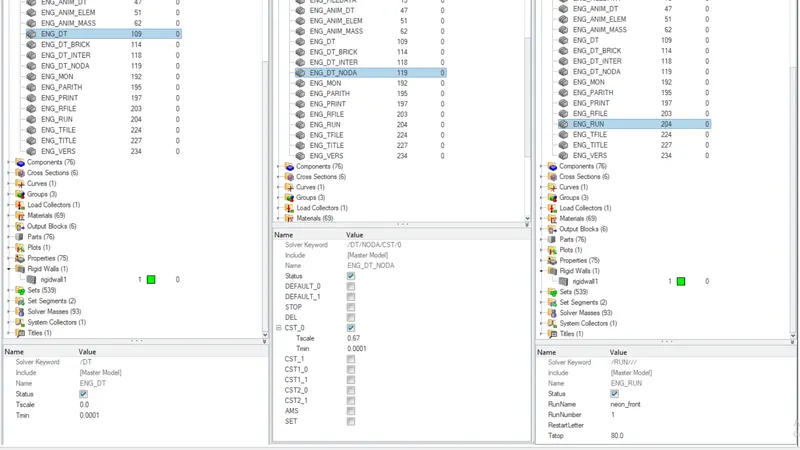
- Check Model cards and change Time-step 0.5 to 0.1 microseconds and Run time 80ms
Here we will make changes to Nodal tiime step and interface time step which can be found under modeltab>cards.
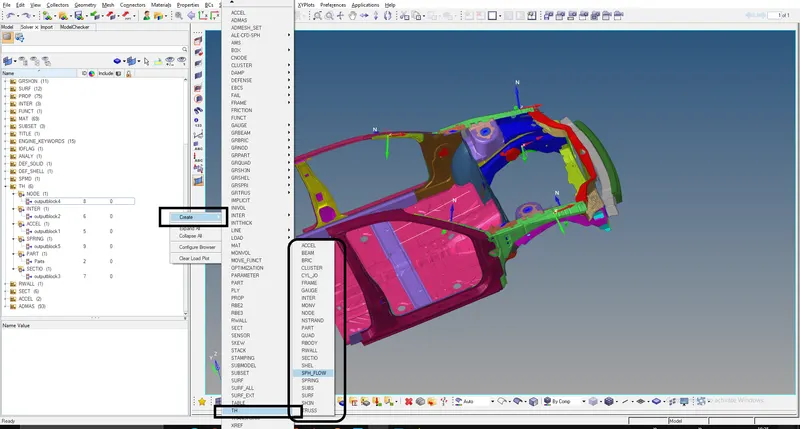
- Creation of Output request
Here we will request a TIME HISTORY (TH) file from the solver.the time history outputs are created using /TH/card.all the data requested is saved in a T01 file.This file can be used in hypergraph to generate different plots to better understand the simulation.
Radioss usually saves the global variables like Internal energy, Kinetic energy, hourglass energy, contact energy, etc by default.in addition to global,we request time history files for specific entities such as
- Sectional forces in the rails at location of indicated node 174247.
- Apillar cross sectional forces(normal forces),
- Shotgun cross sectional forces(normal forces),
- Axial force received on the rails from bumper,
- Acceleration curve received on the accelerometer at base of B pillar (on B pillar rocker arm),
- Intrusions(displacements) on the dash wall 66695,66244.
To request Solver > Create > TH then select the output request we need.
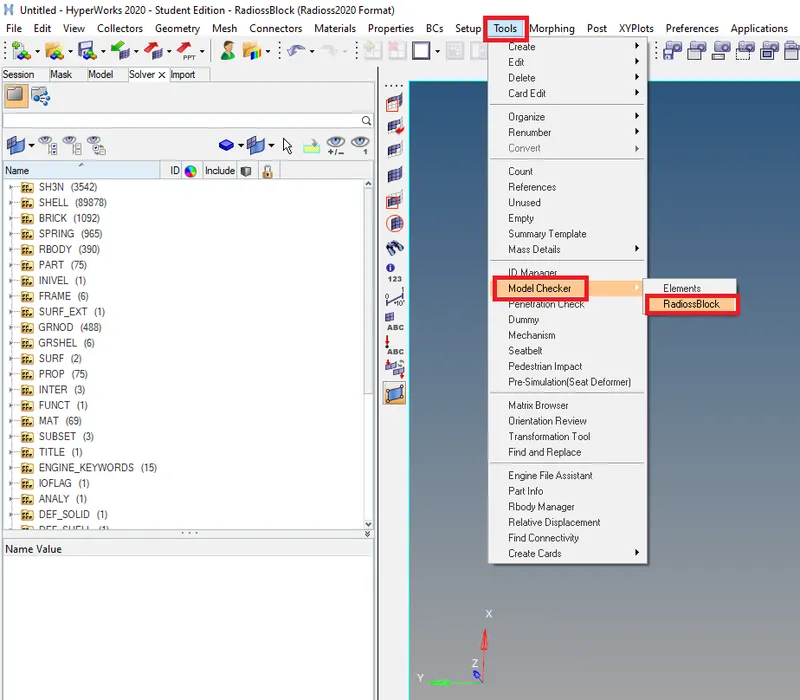
- Use model checker to ensure good quality.
Model checker helps us to find the irregularities,errors so that we can resolve them to maintain the stability of the system,makes the model to perform the simulation in well smooth manner and increases the accuracy in the result that we get.
To check the model, we can use the Model checker in either Hypermesh or Hypercrash. In Hypermesh, the Model checker is available under the Tools tab.
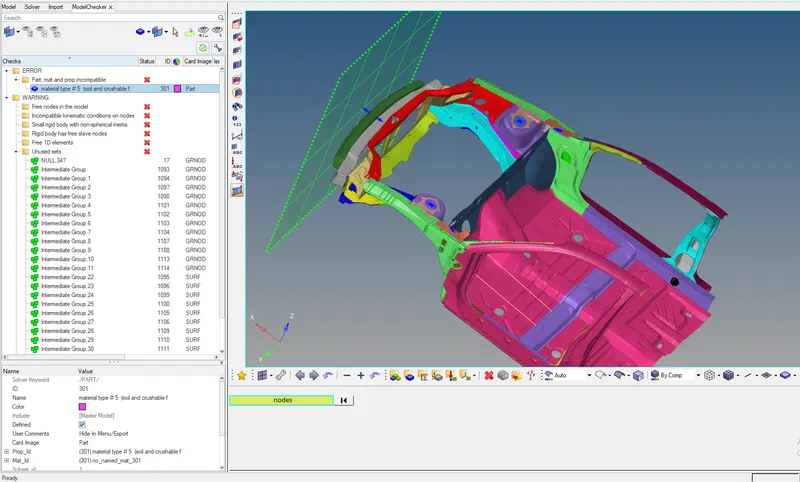
After running the model checker it will show all the errors in the model.these errors must be resolved by us,there are some warnings also which can be seen under errors that we can neglect if they are not too critical or else we also reolve those issues if necessary.
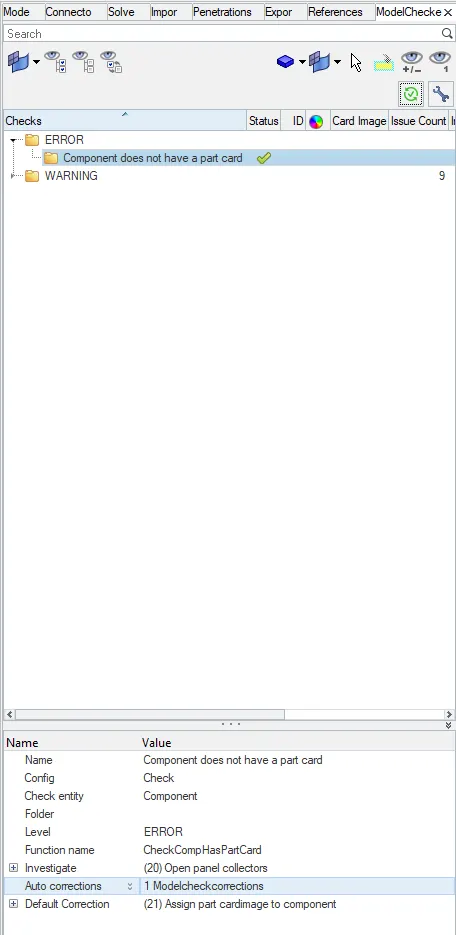
the above image show that all the errors have been resolved in the model,now we can proceed with the simulation.
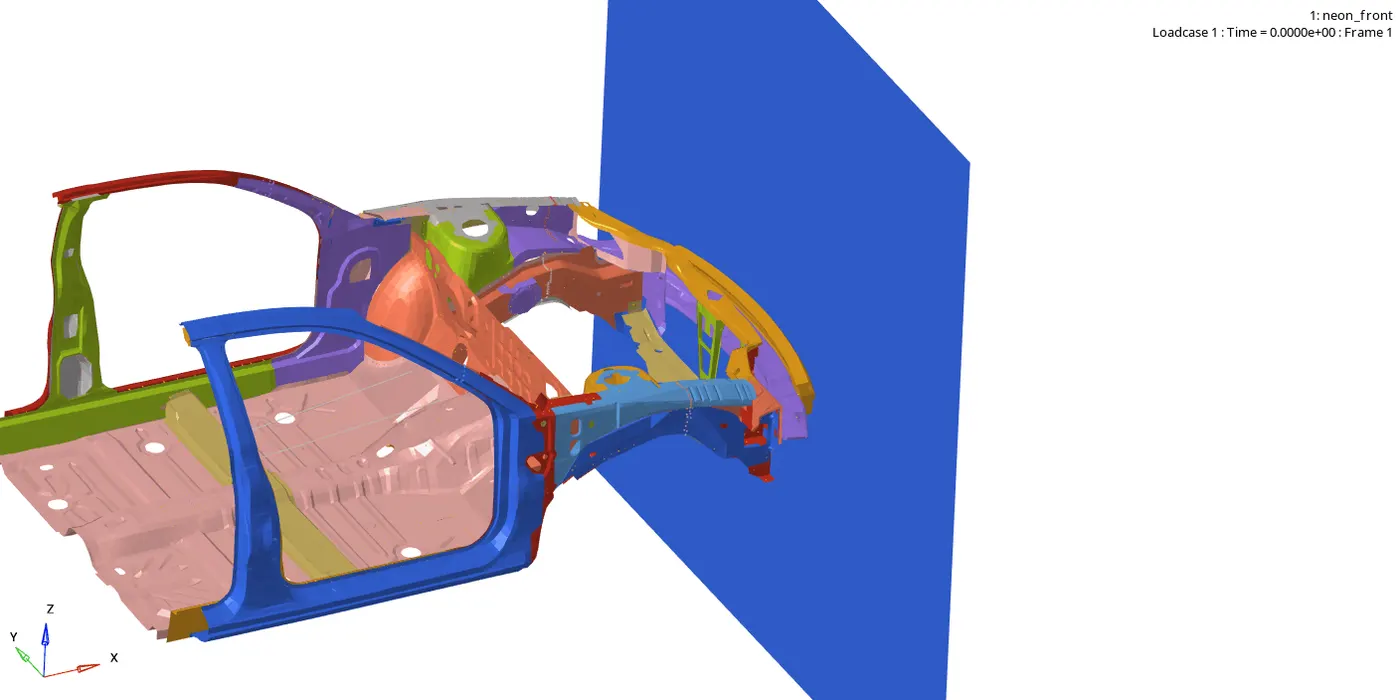
now we will run the simulation and see how the crash is happening .after simulation is completed we will open the hyperview ,the below gif image shows how the frontal crash is happening.
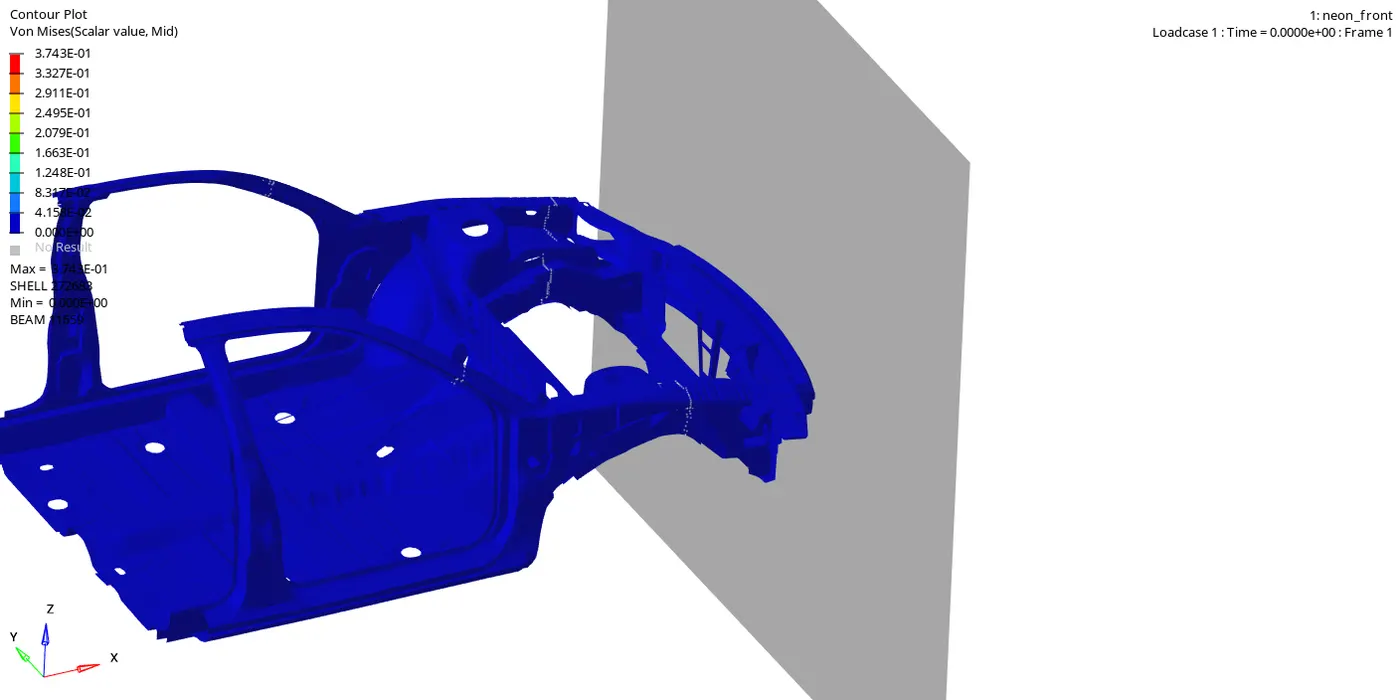
Maximum Von Mises Stress occured is 0.374Gpa at Node 272683.From the below Animation we can see that once the car hits the Rigid wall,the maximum stress is flowing from the bumper region to the A Piller and also towards the floor panel.
the Maximum displacement occured is 1184mm at node 79695
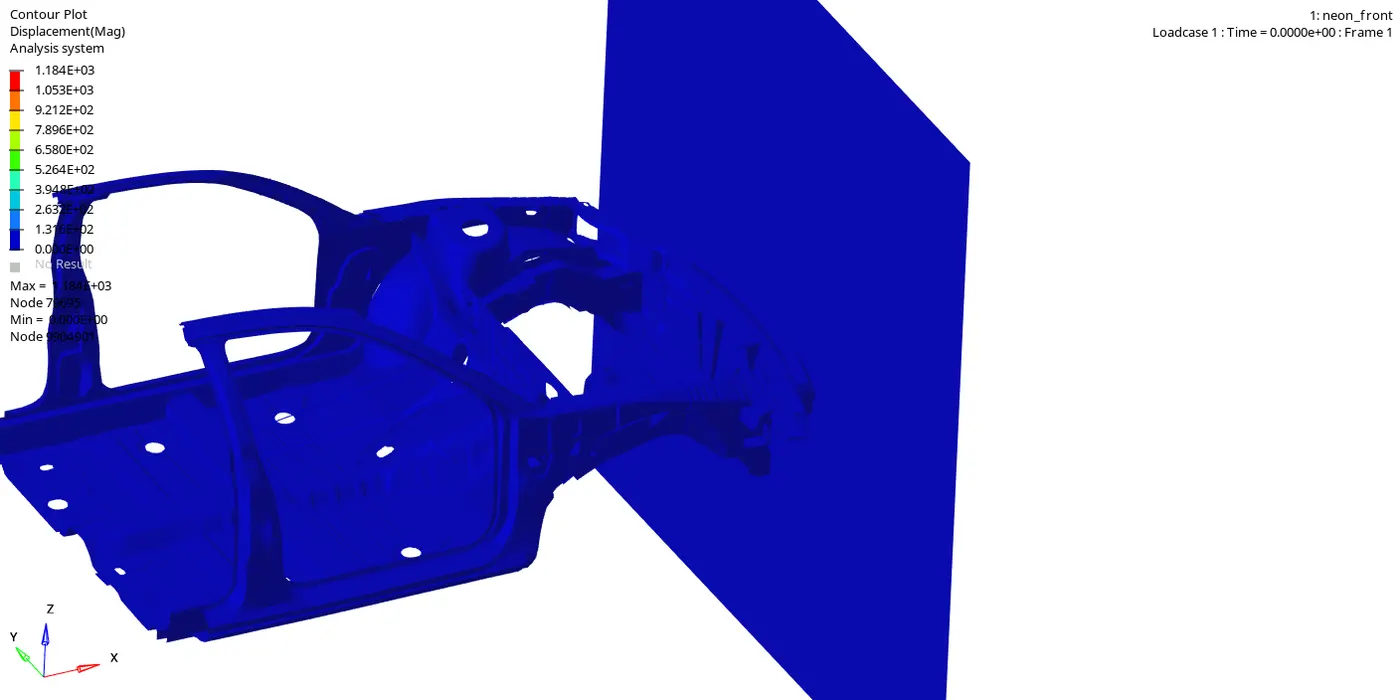
ENERGY PLOTS
- Internal Energy ,Kinetic Energy,Contact Energy and Hourglass Energy
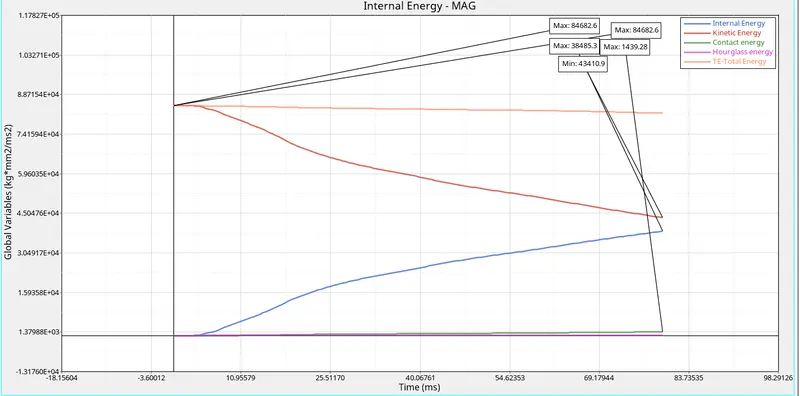
Max internal energy of the system = 43410 KN @ 79 milliseconds
Kinetic energy of the system :
- MAX KE = 84682.6 KN @ 0ms
- MIN KE = 38485.3KN @ 79ms
Max contact energy of the system = 1439.28KN @ 79ms
- From the above graph it has been observed that the internal energy keeps on increasing whereas the kinetic energy is decreasing w.r.t time since the vehicle is moving with some velocity which initially have high kinbetic energy once it get crashed to the rigid wall all the kinetic energy tends to reduce which inturn the same energy is converted in form of heat while it is deforming due to crashing penomenon which results in increase of internal energy of the system which satisfies the principle of conservation of energy.
- Because of QEPH element formulation we have applied, the hourglass energy wil be at zero and it will be constant w.r.t time.
- To avoid high contact energy we set “physical” contact interface gap value ie., GAPmin value of 0.5 which will create a resistive energy to avoid the penetrations.
- Intrusions on the dashwall at node 66695 , 66244
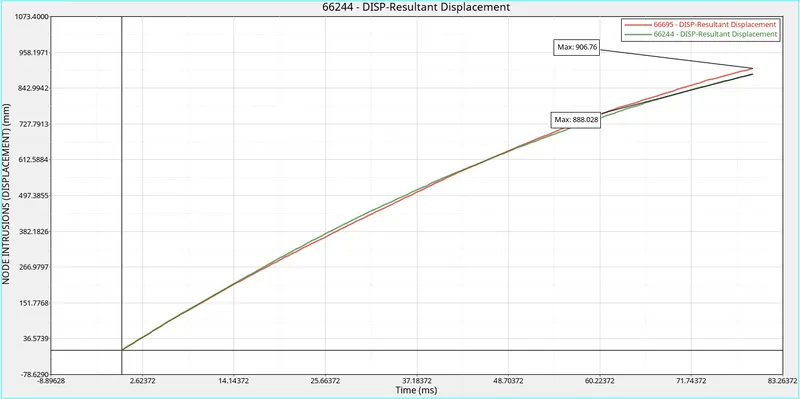
from the graph the maximum displacement occured at node 906.76
- Acceleration curve received on the accelerometer at base of B pillar
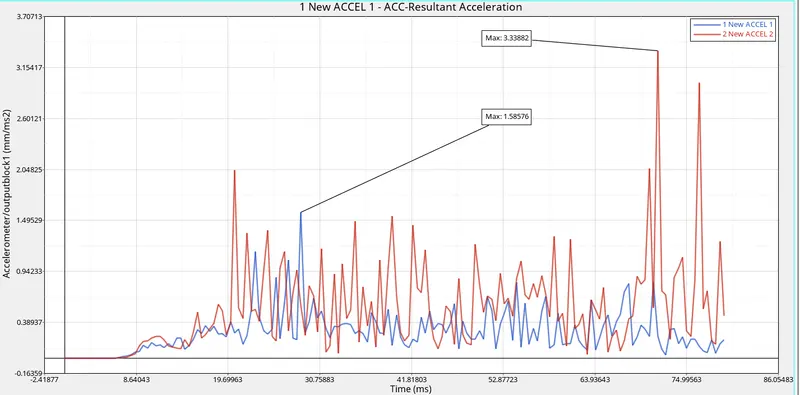
the graph shows that the initial acceleration is constant until vehicle comes in contact with the rigid wall.the second it hits the rigidwall with some velocity the crushing happens at the frontal side components which tends to convert the K.E of vehicle into strain energy so the vehicle eventually comes to rest. the right side accelerometer identifies higher acceeration than the left one.the sharp peaks and valleys of the wave says that there are vibrations in vehivle during the crash.
the maximum acceleration sensed by the accelerometer at the left side recorded at 3.338mm/ms^2 @ t=68ms and the maximum acceleration recieved at right hand side accelerometer is recorded as 1.54mm/ms^2 @ t=29ms
Axial force recieved on the rails from bumper
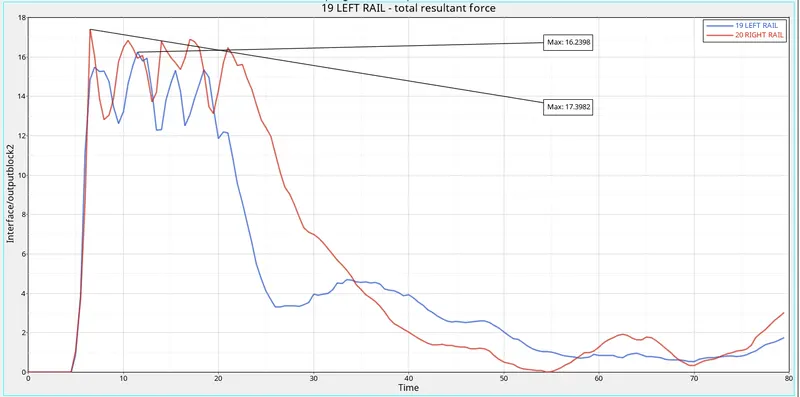
the graph above shows the plot between resultant forces of left and and right rail which is transmitted from the bumper
- when the vehicle hits the rigid wall,the rails recieve strain energy because the bumpers are getting deformed and transmits the strain enegy to rail sections.
- we can see that from the initial face there is no amount of force has been transmitted from bumper to rail once the crash begins the rails start receiving and results in increase of strain energy i.e, 17.3982KN at right rail and 16.2398 at left rail.
- Resultant elongation of spring elements in dashwall
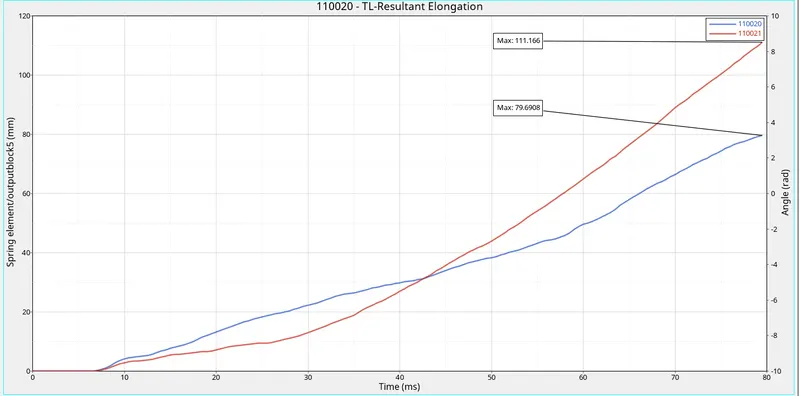
- what we are seeing above are the graphs plotted for calculating the elongation of springs that we have created at driver seat.
- from the above graphit is observed that the elongation of spring 110021 is maximum i.e, 111.16mm when compare to the spring 110020 which is having an elongation of 79.6908mm .
- CROSS SECTIONAL FORCES ON RIGHT & LEFT SHOTGUN
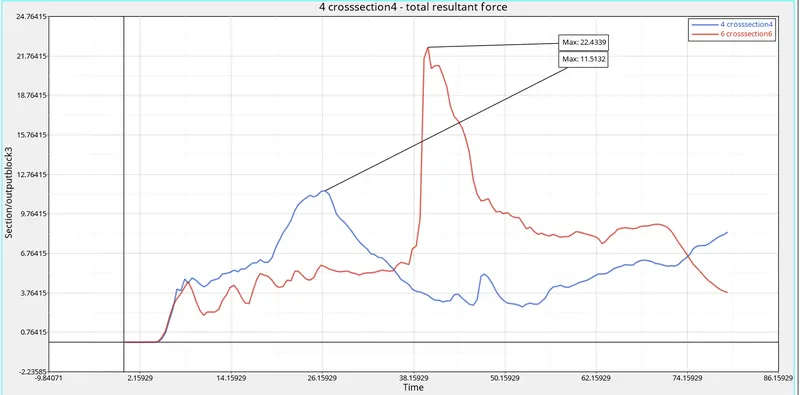
*cross-section 4 : left shotgun
*cross-section 6 : right shotgun
The maximum cross sectional force at Left Shotgun is 22.43kN/mm at t=39.7ms where as maximum cross sectional force at Right Shotgun is 11.51kN/mm at t=27ms.The Force occured at the shortgun are the force transmited from the rail section.The force propogation is not same at both the rails and hence the amount of deformation at both the shotgun sections are differnt.Once the Compressive force reaches its maximum value it starts to deform rapidly.Therefore the Compressive force is decreasing as refered from the graph.As the crash contintinues,the shotgun will come into contact with Rigidwall,the rigid wall also exert the force directly on to the shorguns and hence there is a increase in the Sectional force.
- CROSS SECTIONAL FORCES ON LEFT & RIGHT RAIL
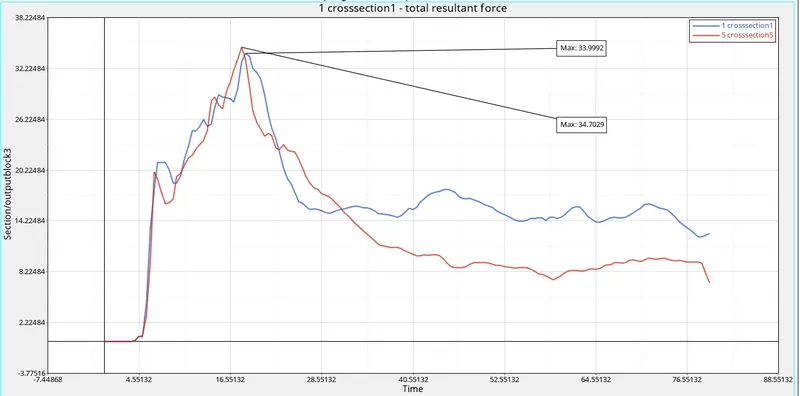
Maximum cross-sectional forces at RIGHT RAIL(*cross-section5) is 34.7029KN @ 18ms
Maximum cross-sectional forces at LEFT RAIL(*cross-section1) is 33.9992KN @ 19ms
- from the above comparson of graph plots we can see that the force propogations are not same in both rails.
- CROSS SECTIONAL FORCES ON RIGHT AND LEFT A PILLAR
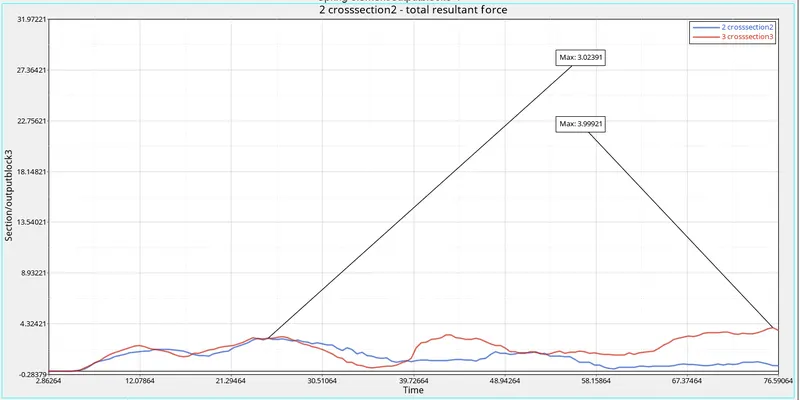
*cross-section2 = RIGHT A PILLAR
*cross-section3 = LEFT A PILLAR
from the above graph the cross sectional forces at leftA pillar is having higher value i.e., 3.99kN/mm at @ ti,e t=75ms compared to maximum value of crosssectional force at right A pillar i.e., 3.02kN/mm @ t=24ms .
CONCLUSION :
1.finally, given model was simulated for the frontal crash using Radioss and the results were obtained and graphical results were plotted using hypergraph.
2.From the simulation, we understood how the crash happens and observed how the forces are transmitted along the sections form component to component.