Frontal Crash Analysis
AIM:
To perform Frontal Crash Analysis on the BIW model and Observe Changes in The model with respect to the Different Boundary Conditions in the Simulation and Graph.
INTRODUCTION:
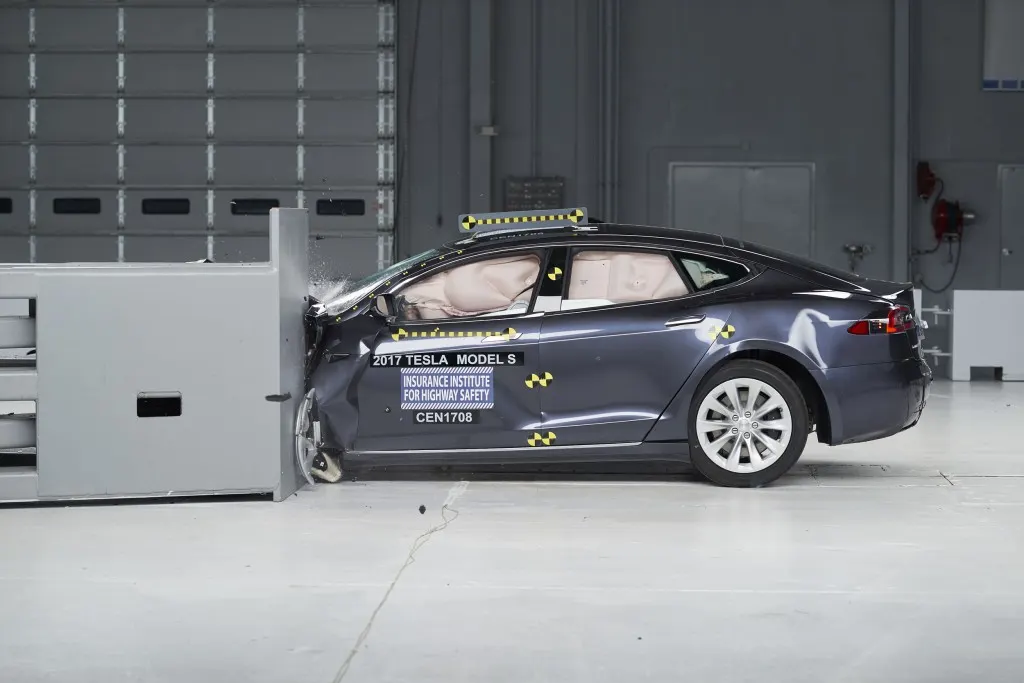
Crash analysis is an integral part of safety analysis and is often completed at intersections and corridors. The crash analysis can help assess concerns and help determine potential improvement options. A Crash test is a form of destructive testing usually performed in order to ensure safe design standards.
New Car Assessment Program (NCAP):
It is a government car safety program tasked with evaluating new automobile designs for performance against various safety threats.
Standard crash tests performed by NCAP:
1:Frontal offset testing (64 km/h proposed)
2.Side-impact testing
3.Pedestrian protection testing
4.Rear impact testing
5.Child dummy dynamic crash testing
FMVSS ( Federal Motor Vehicle safety standards)
Federal Motor Vehicle Safety Standards (FMVSS) are US federal Vehicle Regulations specifying design, construction, performance, and durability requirements for motor vehicles and regulated Automobile safety-related components, systems, and design features. They are the U.S. counterpart to the UN Regulations developed by the World Forum For Harmonization of Vehicle Regulations and recognized to a varying degree by most countries except the United States.
BIW (BODY IN WHITE)
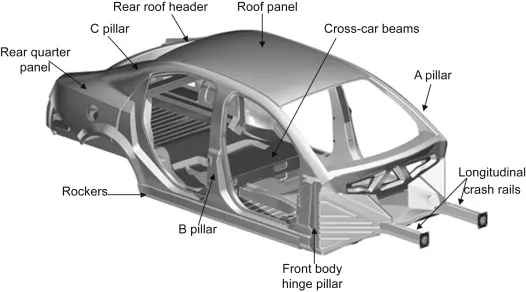
Body in white (BIW) is the stage in Automobile Manufacturing in which a car body's frame has been joined together, that is before painting and before the motor, chassis sub-assemblies, or trim (glass, door locks/handles, seats, upholstery, electronics, etc.) have been integrated into the structure. Assembly involves different techniques such as Welding (spot, MIG/MAG), Riveting, clinching, bonding, and laser Brazing.
FRONTAL CRASH:
PROCEDURE:
Case setup & Execution:
1. Import the given model "neon_front_0000" into Hypermesh.
2. Open the same model "neon_front_0000" in Hypercrash as well with the unit system "Kg mm ms".
3.Delete the unsupported cards found in the Browser menu.
3. Perform model check and penetration check in the Quality menu in Hyper crash before applying the conditions.
4.Note the errors and Warnings showed and keep them as a reference for later use.
STEP-1: BALANCING COG.
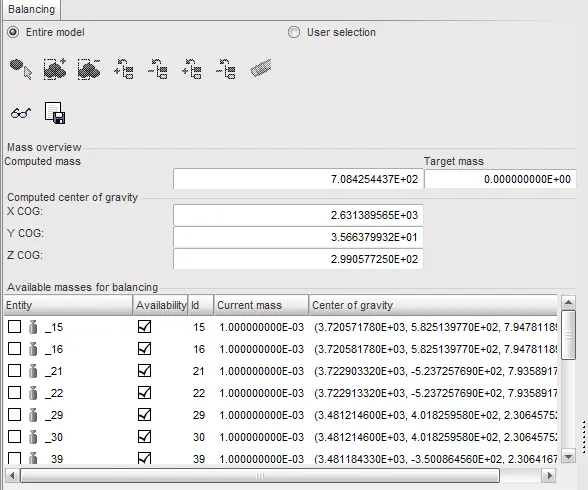
1. Before performing analysis the center of gravity of the vehicle should be balanced exactly at a point.
2. The BIW model doesn't consist of the exact weight of the vehicle in, completed condition, so Additional mass should be added to the BIW model considering the weight of the Body after manufactures ie. with the weight of the seats, the weight of the persons in average and all other weights in realistic condition.
3. For adding mass, three major types are used here,0,1&3. (Type 0 = Mass is added to each node of the node group, Type 1 = Mass is distributed to each node of the node group, Type 3 = Additional mass distributed on the part group)
4. The target weight given is 700kg where the actual mass before adding is 180kg
5. To Add the mass, Click on added mass, and to create a new object Select Type 1 - Mass is distributed to each node of the node group, and click save
6. Check COG, Simultaneously after giving the mass in the balancing menu.
7. Add mass according to the needs till the point reaches the center and till the mass attains the target value.
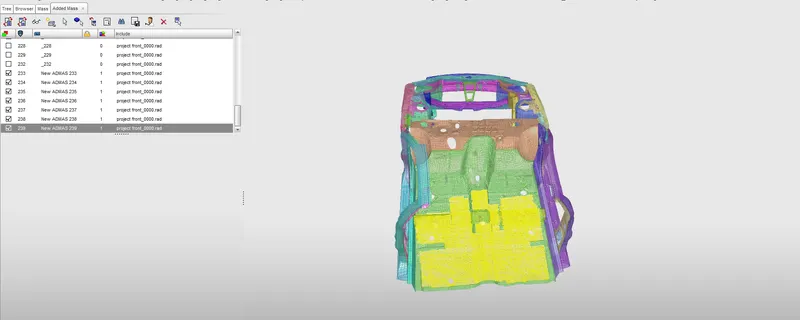
The yellow color indicates the node group where mass added.
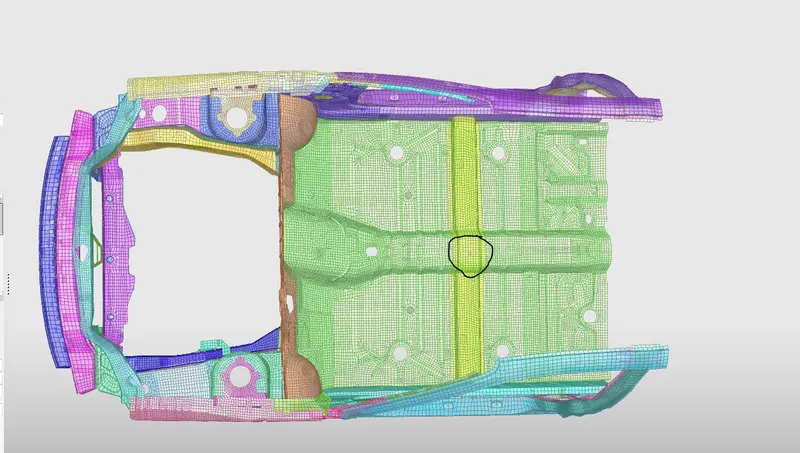
The red point in the middle indicates the mass is perfectly balanced in the center.
STEP-2 CREATING RIGID WALL:
1. A rigid wall is created after balancing the mass.
2. In load case, select Rigidwalls > new object > plane
3. Friction is defined for the rigid wall with a coefficient of 0.1 and in the Slide option, sliding with friction is selected
4. Two nodes are picked along the direction in the axis so the rigid wall is perpendicular to the BIW body.
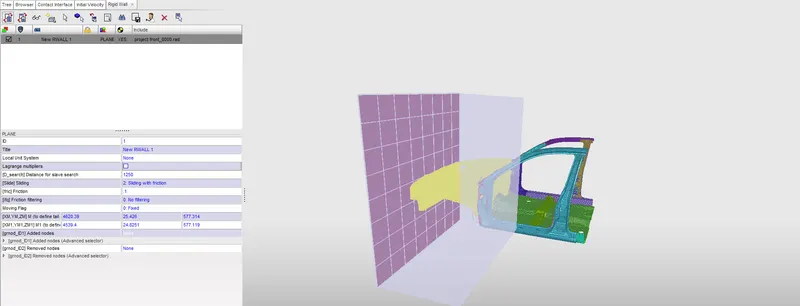
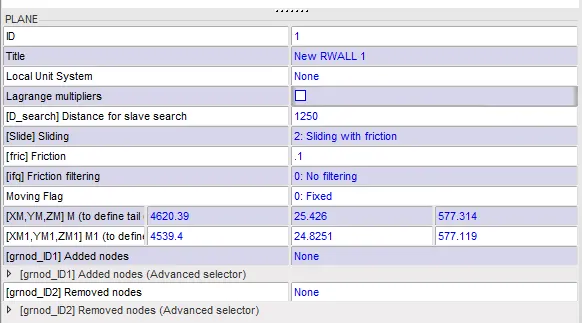
5. The parameters are given as required.
6. The Important parameter which needed to be specified is "[D_search] Distance for slave search" which will consider the nodes as a slave up to a specified value, here [D_search] is given as 1250.
7. The transparent volume in the image represents D_search distance.
STEP-3:Creating the Initial velocity (INIVEL)
1. As for performing the Simulation in a realistic case, the Velocity must be defined for the Body.
2. The velocity here makes the car move and crashes the wall.
3. The initial velocity is given as 35 mph which is converted into 15.6464 mm/ms as the solver follows this unit system.
4. The velocity is defined in the X-axis where the body should move in that direction.
5. In the load case, select Initial velocity > new object creation and enter the parameters.
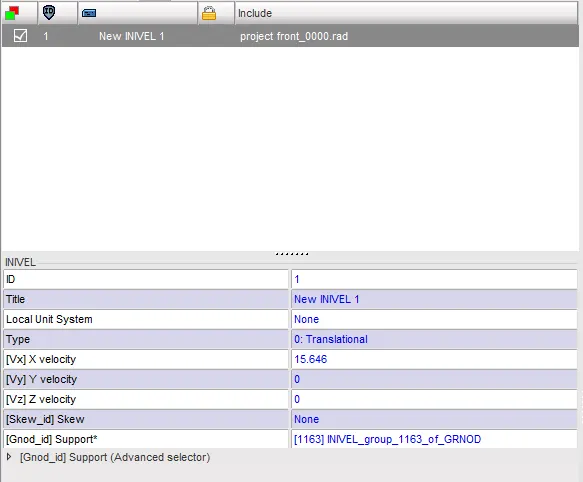
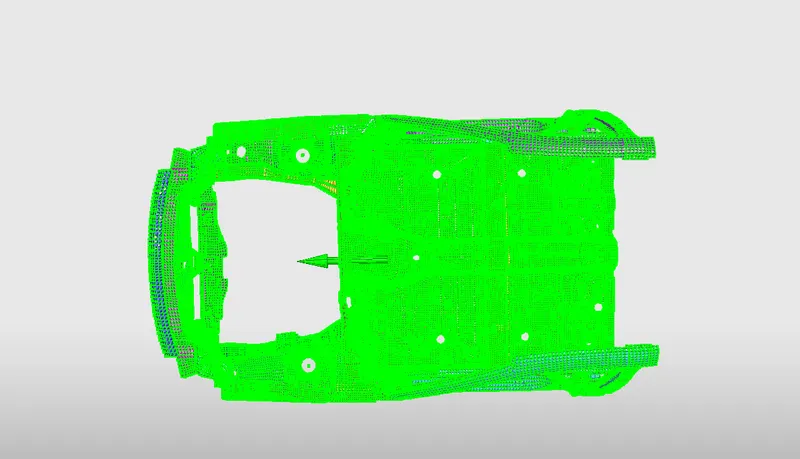
6. The Arrow indicates the direction of the velocity Applied.
STEP-4: CREATING CONTACT INTERFACE:
A contact interface should be defined to view the contact energy.
Here the type-7 Contact is used (Node to Surface), because of its high accuracy and correct physical representation.
The self impact is defined in the Contact interface as the body acts as both master and Slave.
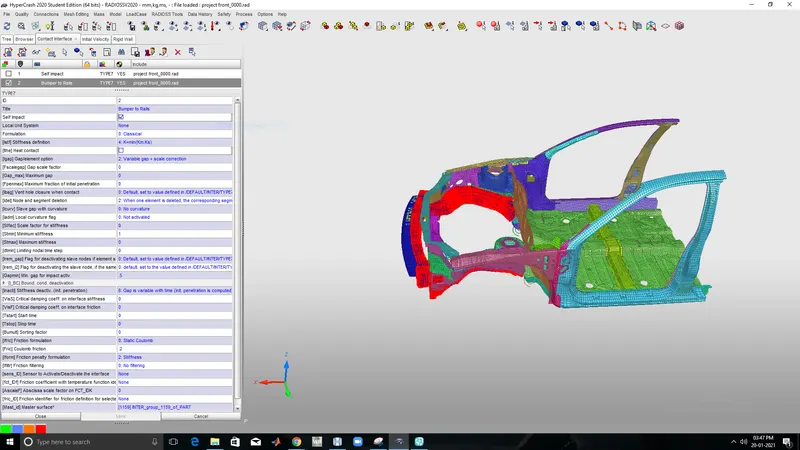
Another Type-7 Contact is created for measuring the axial forces between the bumper and Rails frame
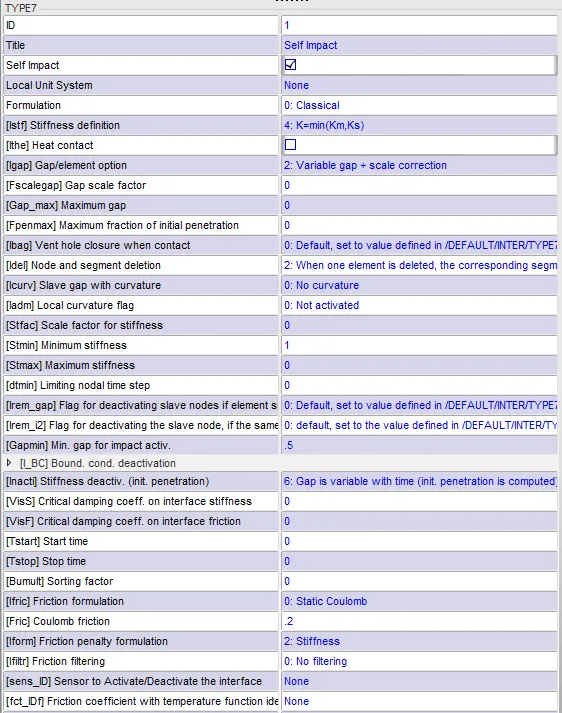
All the parameter values are set to be recommended values for the crash application.
Self impact-full body
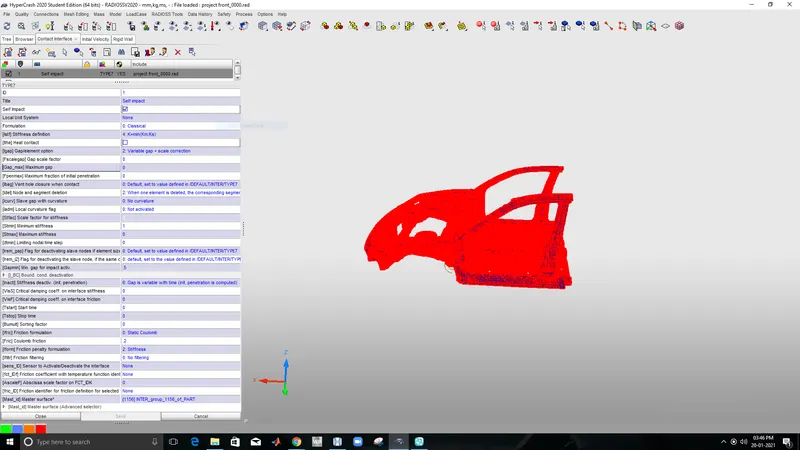
Self impact- Bumper to rails.
Parameters:
The red color in the image Indicates the nodes with both master and slave, whereas the master is defined as blue and the red as Slave.
After all these Steps The model is Exported as Radioss, and opened in Hypermesh.
STEP-5: CREATING CROSS SECTION.
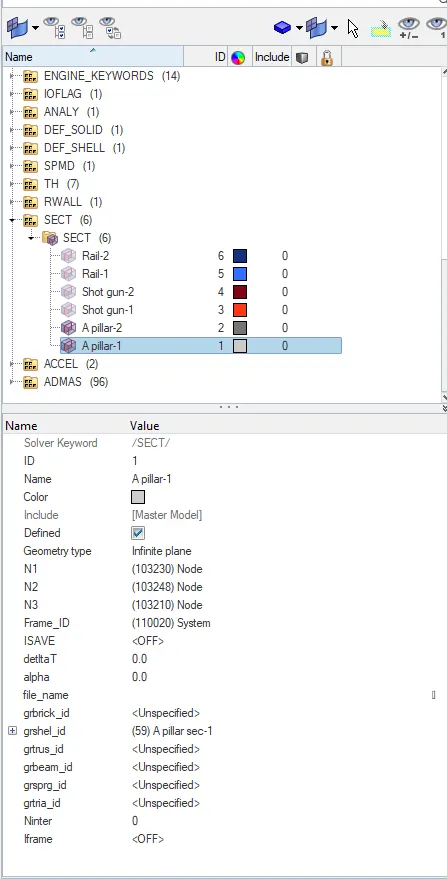
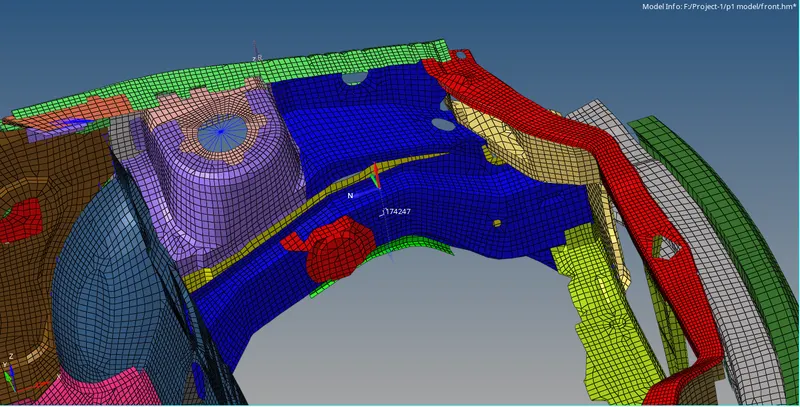
1. The cross-section is created to observe the forces Distributed in various components such as Rails, Shotguns, and A-pillars.
2. The cross-section must be Created in such a way that the Normal force observed in the component should be opposite to the velocity Applied.
3. For creating a cross-section a new set is defined as A-pillar, Shotgun, and Rails.
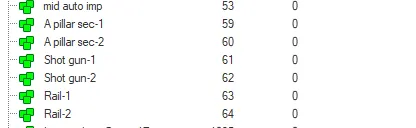
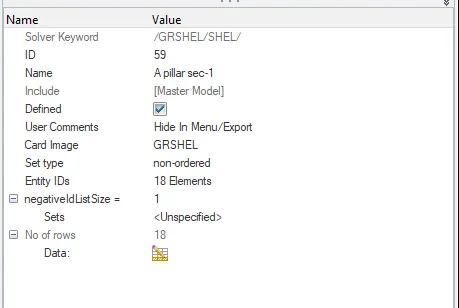
4. Give the card image as Grshell and Select a set of elements in the entity id where the cross-section might be placed and click proceed.
5. Follow the same procedure for Shotgun and Rails.
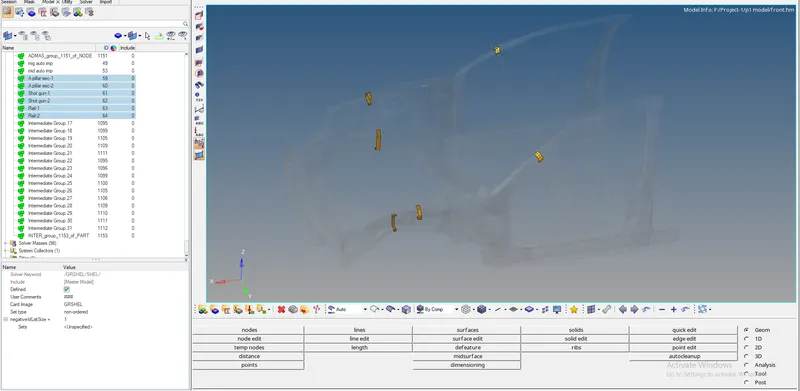
6. In The solver, area Create a new section by right-clicking > create > SECT.
7. Create a Frame for each section created.
8. Frame is created by right-clicking > create > FRAME > MOV
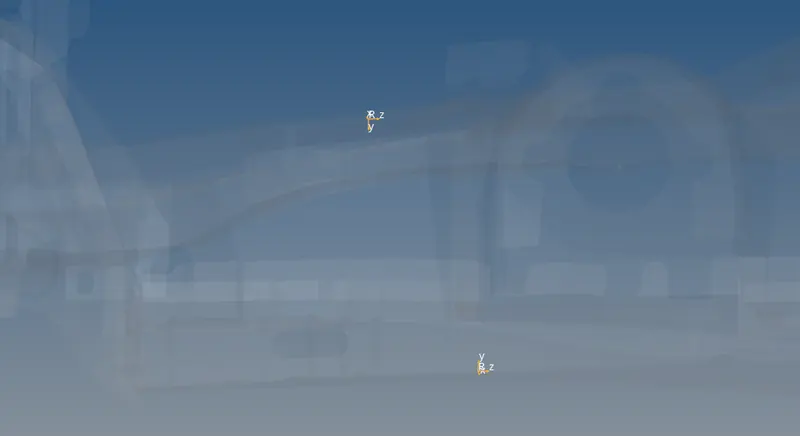
9. Assign the frame system to the respective Cross-section and give the value of the nodes in the frame.
10. Assign the set created in the model area in grshel_id
Repeat this process for other Components.
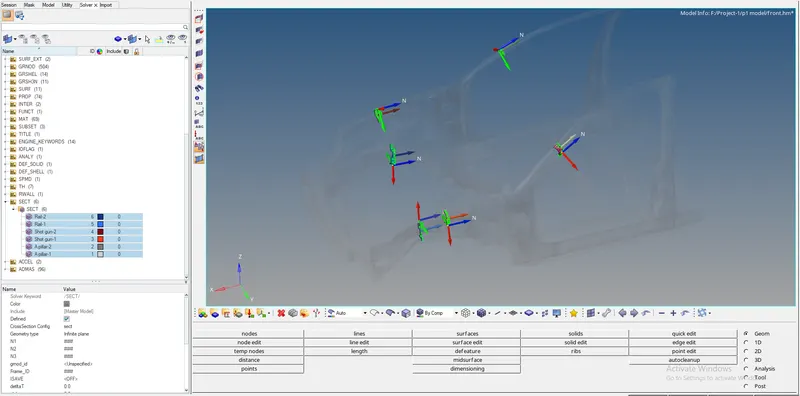
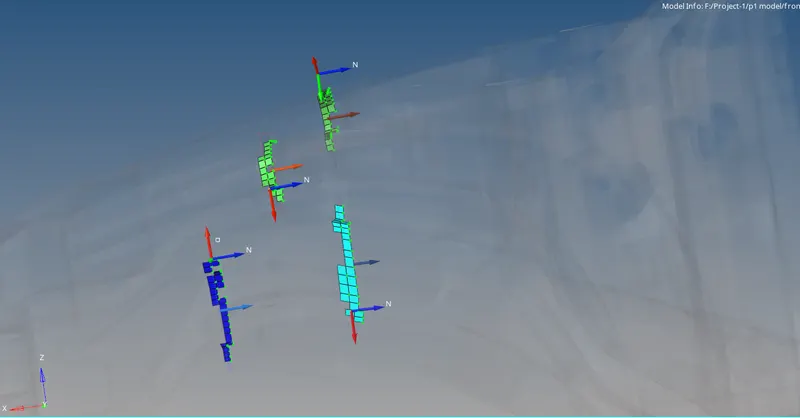
11. As we can see all the normal forces are acting in the opposite direction to the velocity applied.
STEP-6: Output Request
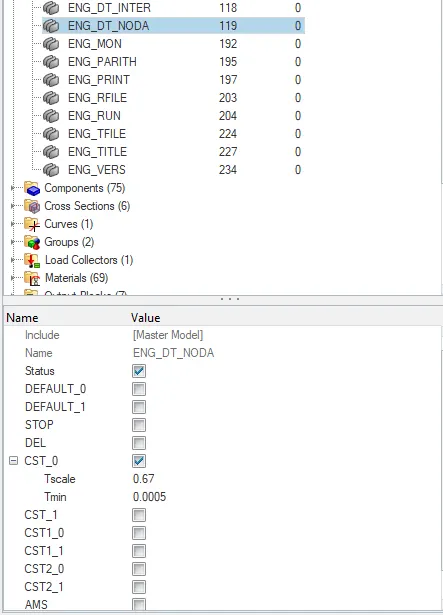
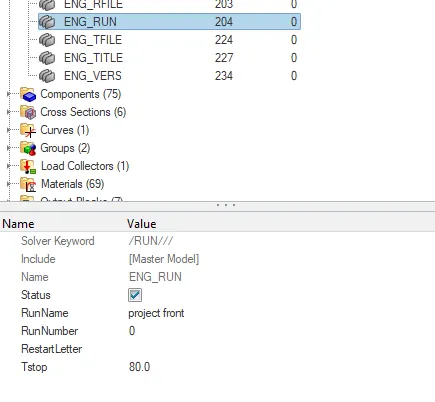
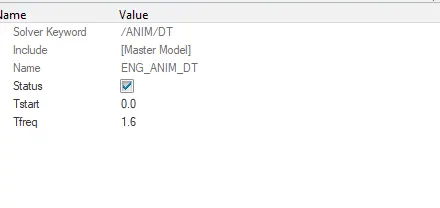
1. Give the required time step for running the simulation in the Control card.
2. Specify the time step = 0.0005 and time-frequency = 1.6 and runtime = 80ms.
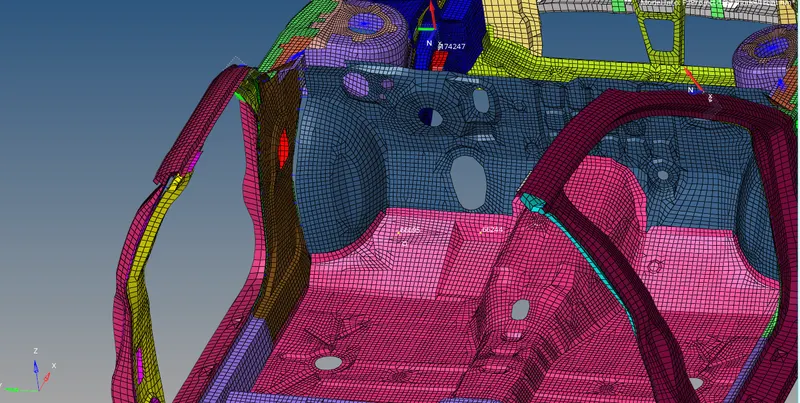
3.Create Intrusions on the dash wall at the node given 66695,66244
4Create Accelerometer in the Rock area in B pillar, for creating accelerometer click create > ACCEL in the Solver area and select a node.
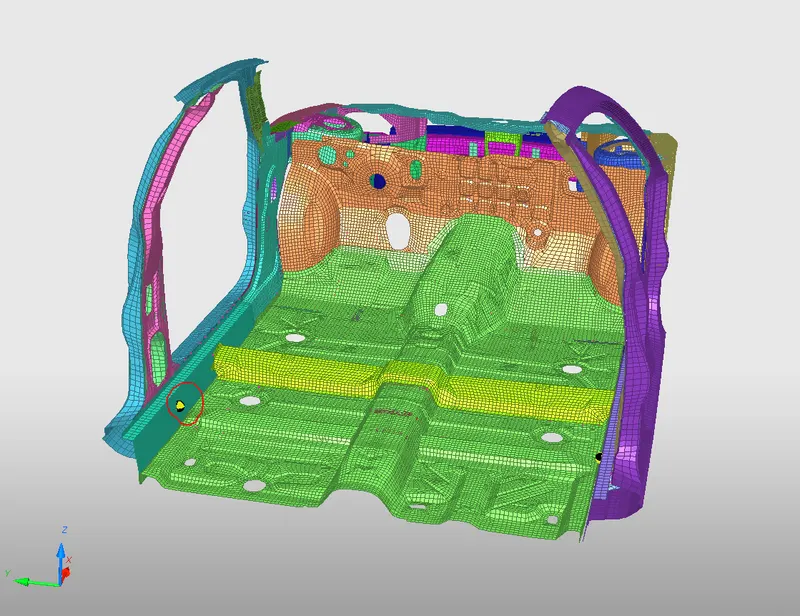
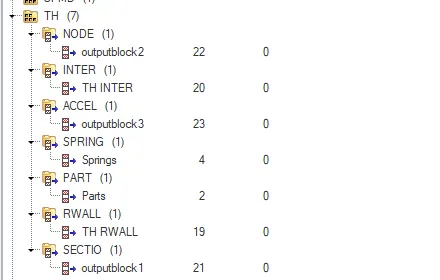
5. Time history should be created individually for requesting outputs for the cross-sections, Rigid wall, intrusions, Accelerometer, and interfaces.
6. Create TH for Rigid wall created.
7. Create TH for node and select the node for finding intrusion.
8. Create TH for Contact interface created.
9. Create TH for all the sections created.
10. Create TH for the accelerometer created at B-Pillar.
RUN THE SIMULATION:
1. Since the simulation cannot be performed in Hypercrash the model is exported as a RADIOSS file, which is then imported into Hypermesh to Run the simulation.
2. Click on the analysis panel in the Hypermesh.
3. Save the model in the local directory.
4. For Running The analysis: Analysis > Radioss is selected from the panel

5. The analysis runs and shows the result.
6. The energy error And mass errors are checked.
CYCLE TIME TIME-STEP ELEMENT ERROR I-ENERGY K-ENERGY T K-ENERGY R EXT-WORK MAS.ERR
159500 79.75 0.5000E-03 NODE 158987 -1.9% 0.3851E+05 0.4535E+05 2.852 -1211. 0.1236E-02
159600 79.80 0.5000E-03 NODE 440173 -1.9% 0.3853E+05 0.4533E+05 2.860 -1213. 0.1236E-02
159700 79.85 0.5000E-03 NODE 158145 -1.9% 0.3854E+05 0.4532E+05 2.849 -1214. 0.1236E-02
159800 79.90 0.5000E-03 NODE 440173 -1.9% 0.3856E+05 0.4530E+05 2.831 -1216. 0.1236E-02
159900 79.95 0.5000E-03 NODE 440173 -1.9% 0.3857E+05 0.4528E+05 2.827 -1217. 0.1236E-02
ELAPSED TIME = 8896.65 s
2:28:16
NORMAL TERMINATION
TOTAL NUMBER OF CYCLES : 160001
** COMPUTE RUNTIME INFORMATION SUMMARY **
STARTER RUNTIME = 6.62s (00:00:06)
# 001 ENGINE RUNTIME = 8896.65s (02:28:16)
------------------------------
STARTER+ENGINE RUNTIME = 8903.27s (02:28:23)
7. The energy error is -1.9 and the Mass error is 0.1236E-02 which lies within the Acceptable Conditions.
8. Click results for viewing the Analysis in an Animated and Graphical Format.
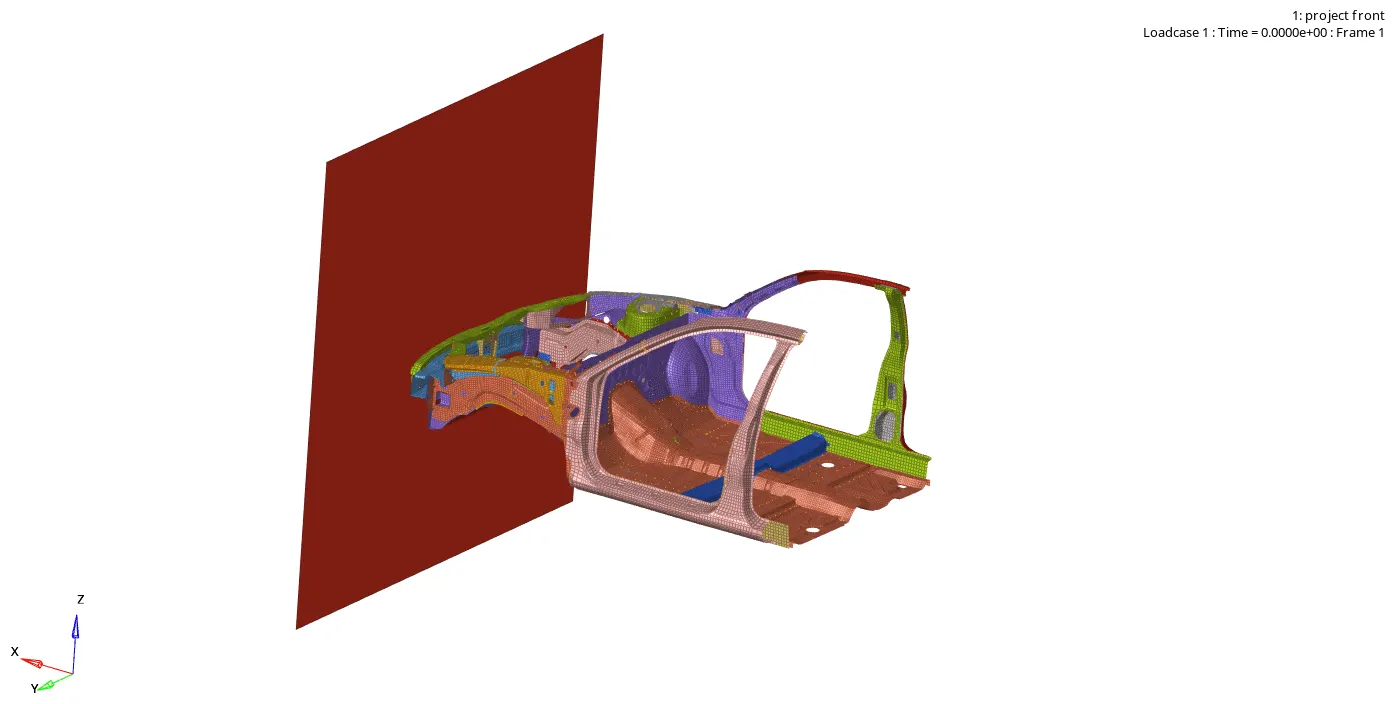
DISPLACEMENT OBSERVATION:
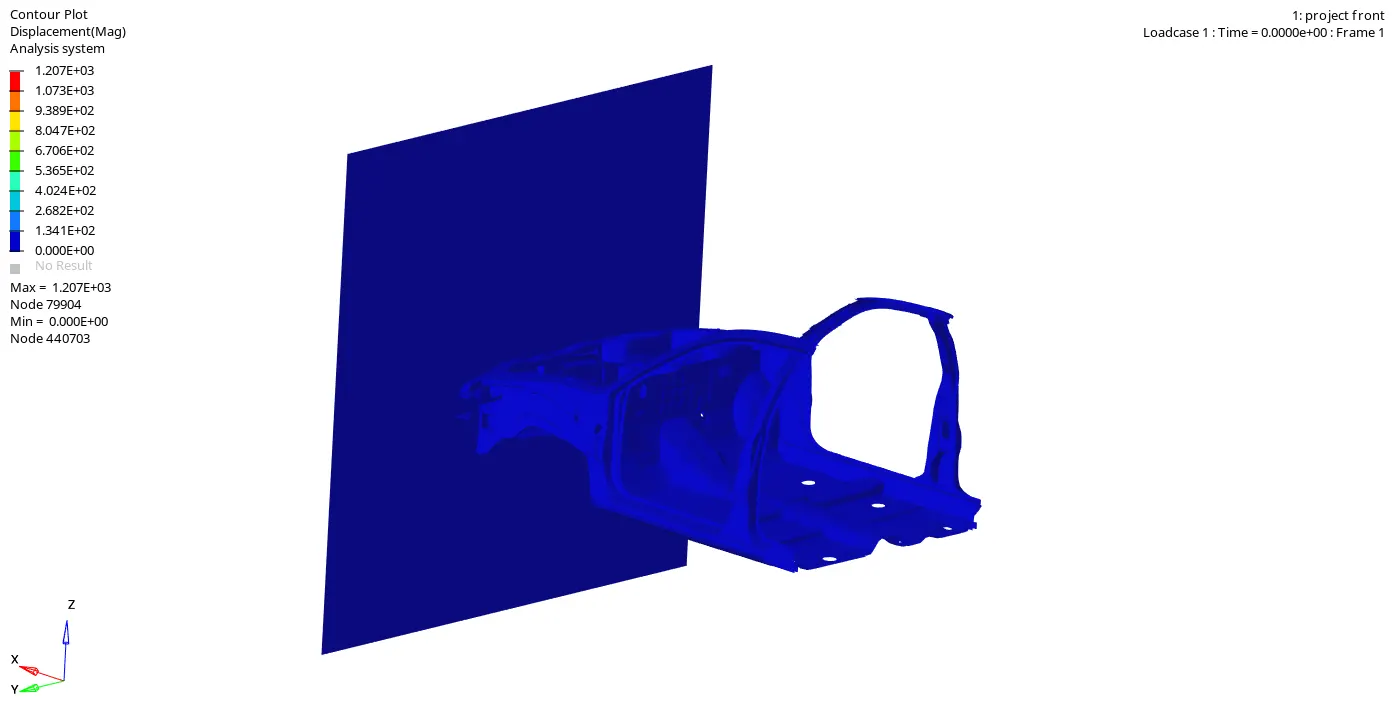
Maximum displacement: 1.207E+03 is at node 79904
Minimum displacement: 0.000E+00 is at node 440703
VON MISES OBSERVATION:
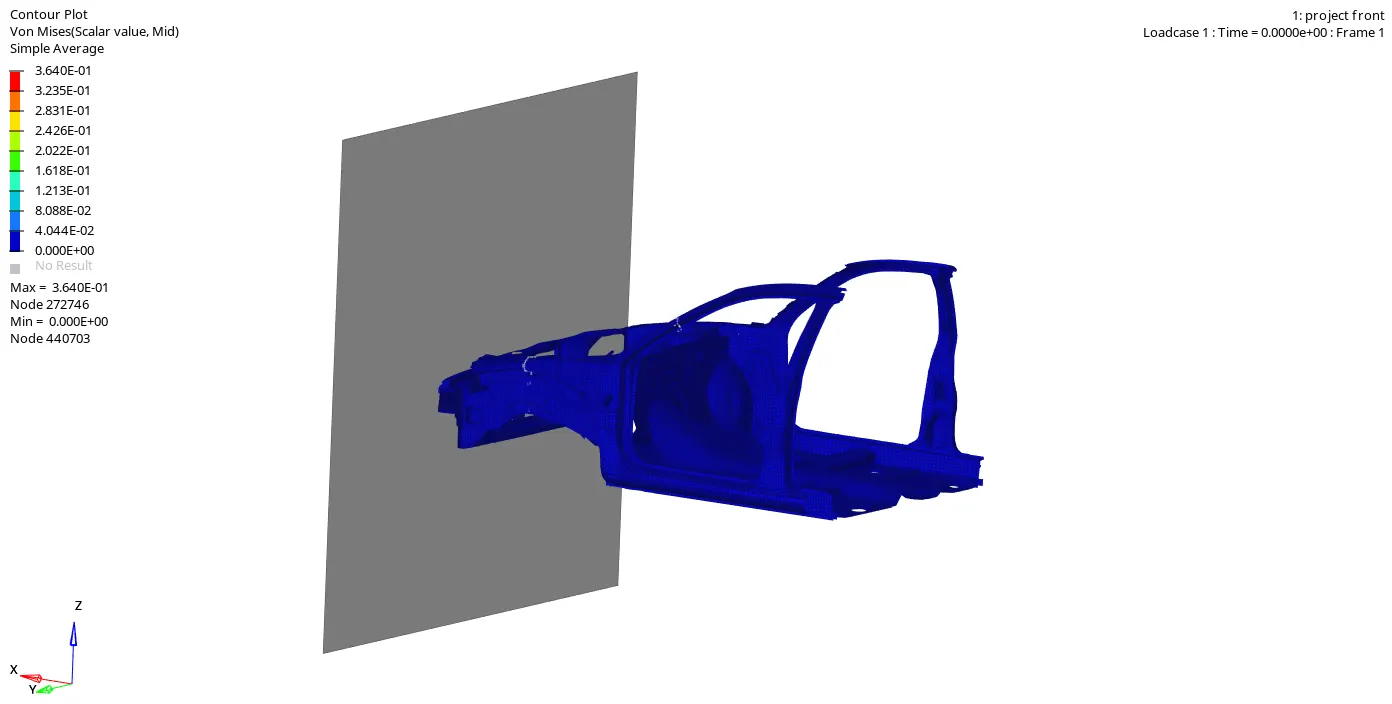
Maximum displacement: 3.640E-01 is at node 272746
Minimum displacement: 0.000E+00 is at node 440703
GRAPHICAL REPRESENTATION:
Graph 1: Time versus Internal energy, Kinetic energy, Hourglass energy, and Total energy:
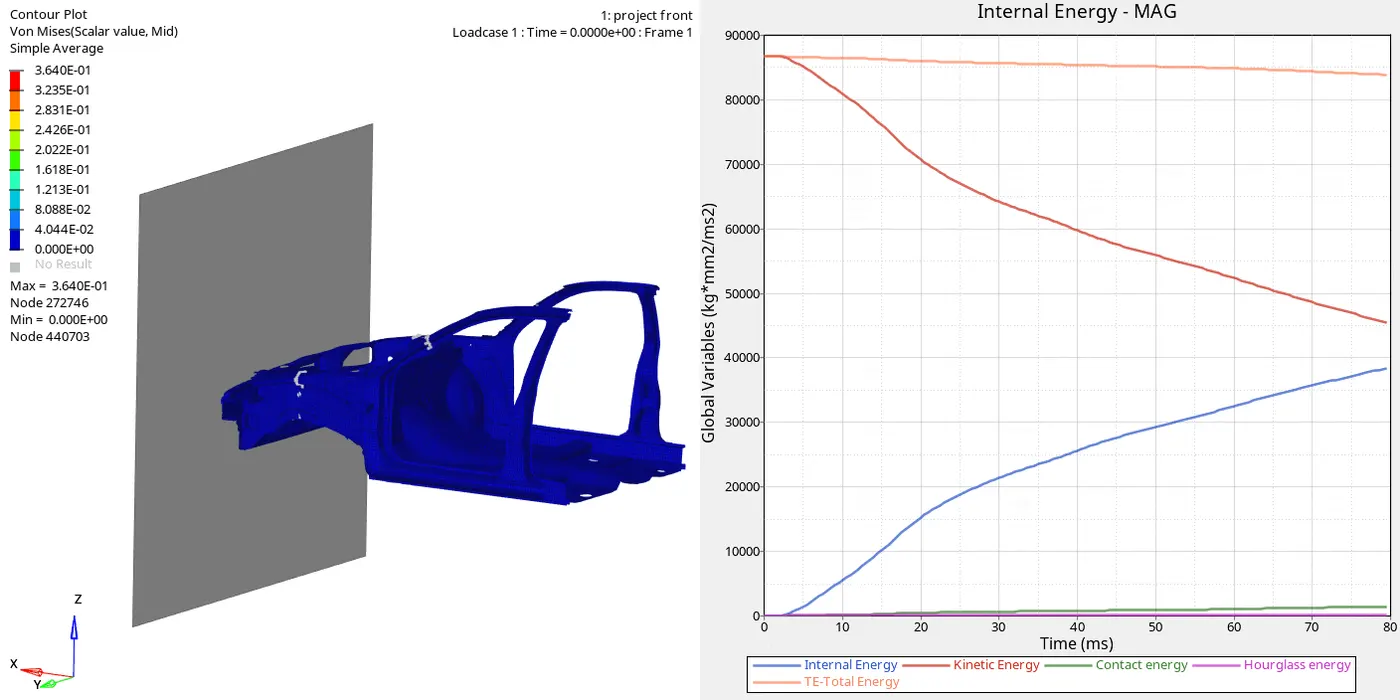
1.contact between the car and the rigid walls started at 8.5 ms
2. The kinetic energy is constantly decreasing due to the deformation while the strain energy or internal energy is increasing during the impact.
3. The total energy of the system remained balanced also a negligible spike in contact energy can be noted towards the end of the cycle.
4. There is no hourglass energy is formed due to the QEPH element formulation.
Graph-2: Contact Energy.
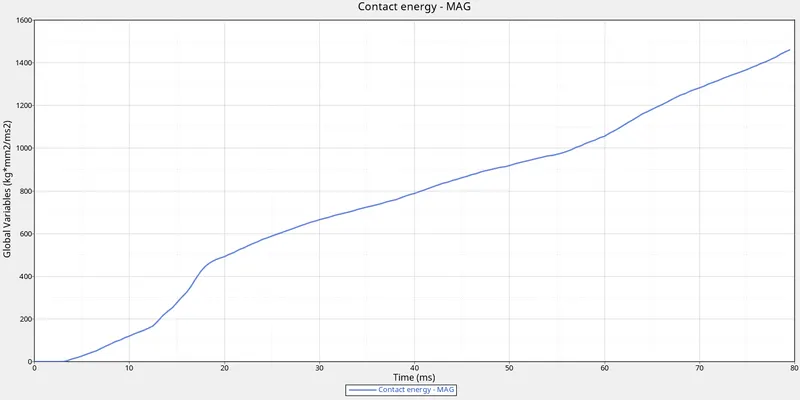
It is the energy developed between the MAster and slave in the interface while deformation.
Graph-3: Time vs Interface (For observing the axial force)
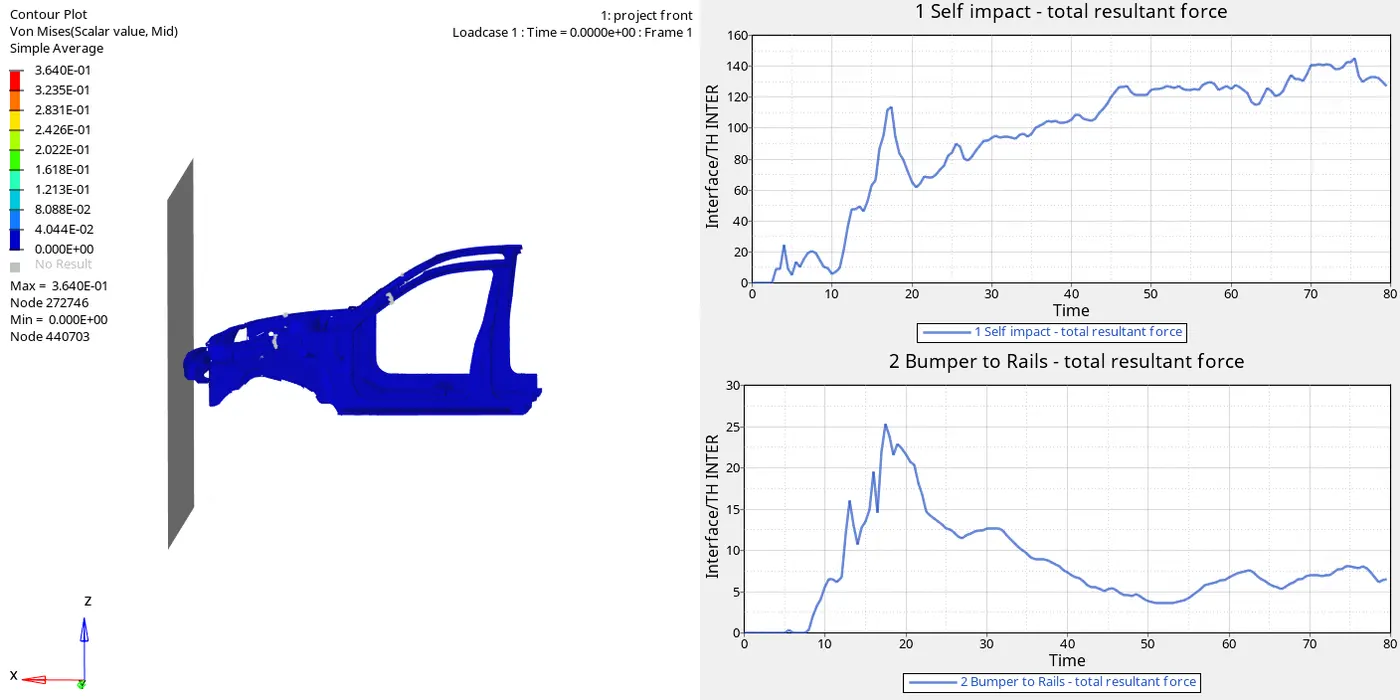
In self impact, both master and slave experience the force while acting on the rigid wall and increases at a point and decreases gradually before the turn.
After the turn, the force starts to increase gradually in a slow manner.
In Bumper to rails impact, the impact is starting From at 0.5ms.
As it can be seen in the graph Bumper has absorbed high impact than any other component being the first area to get impacted
The high impact can be during 10ms to 14ms bumper has absorbed the high impact, then gradually reduced; that means the area was crushed beyond the plastic range
There is again increase after 60ms and gradually decreasing.
Graph-4: Rigid wall Forces:
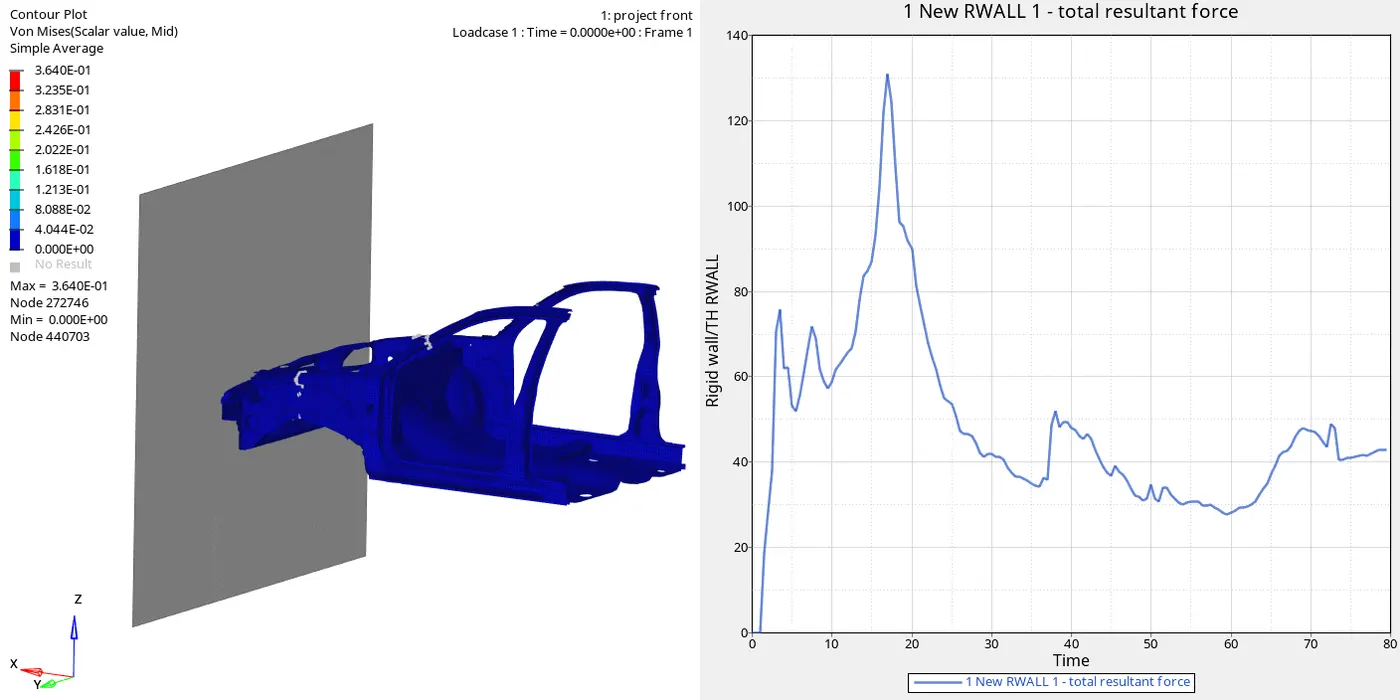
1. The Resultant force is 130kN peak value around 15ms just after collision with bumper
2. After some time at 30ms, it spiked slowly till 55kN and then reduced.
3. At 70ms forces on rigid wall increased to 95kN at 80ms
4. Variation in forces on the rigid wall due to impact of different components on that come into contact based on D_Search value and material property
Graph-5: Sectional Forces:
A-pillars
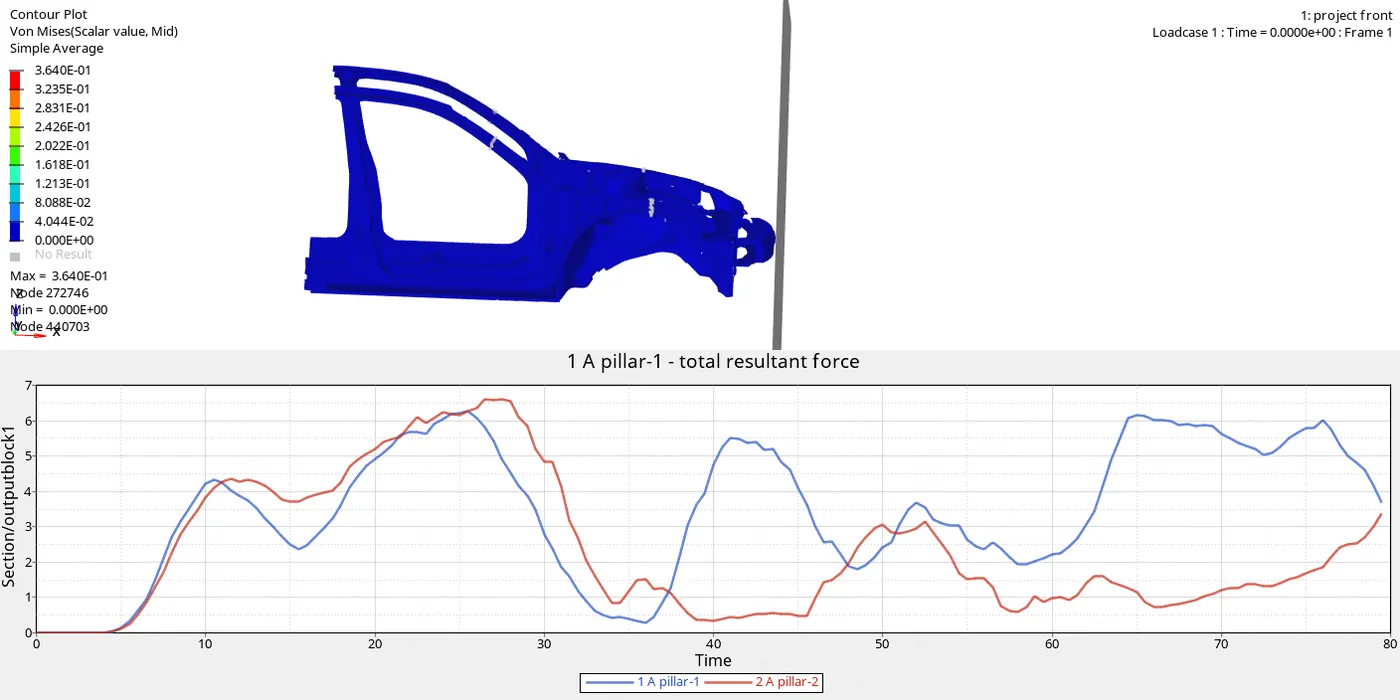
From the Graph The force observed in the A-pillar is more than the B pillar
Shotguns.
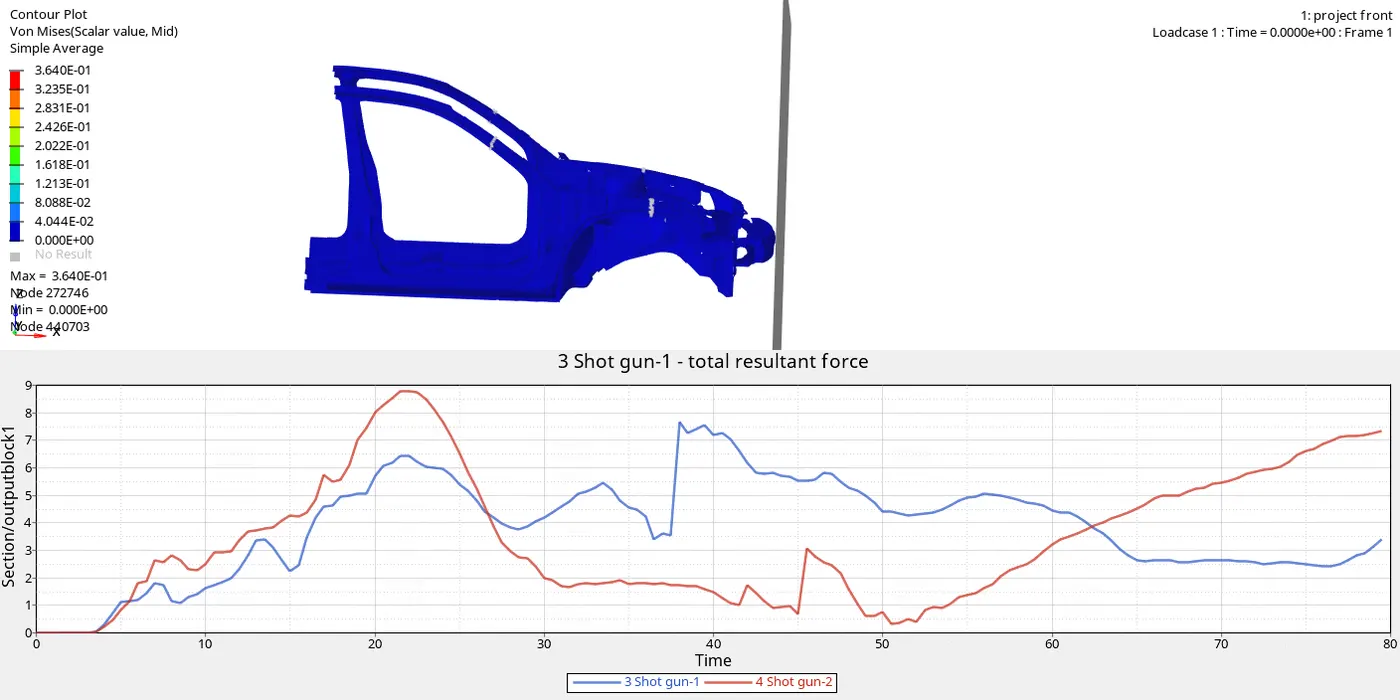
1. The shotgun is just above rails connecting A-Pillar
2. Sectional force on the shotgun-2 is greater than shotgun-1. at 20ms and forces in section 2 decreases gradually whereas the forces in 1 increases
3. shotgun endure high impact; ensure that less impact is done on A-pillar and other sub-assemblies
4. There is slight variation in sectional forces in both Shotguns; this is because of the node selection
Rails.
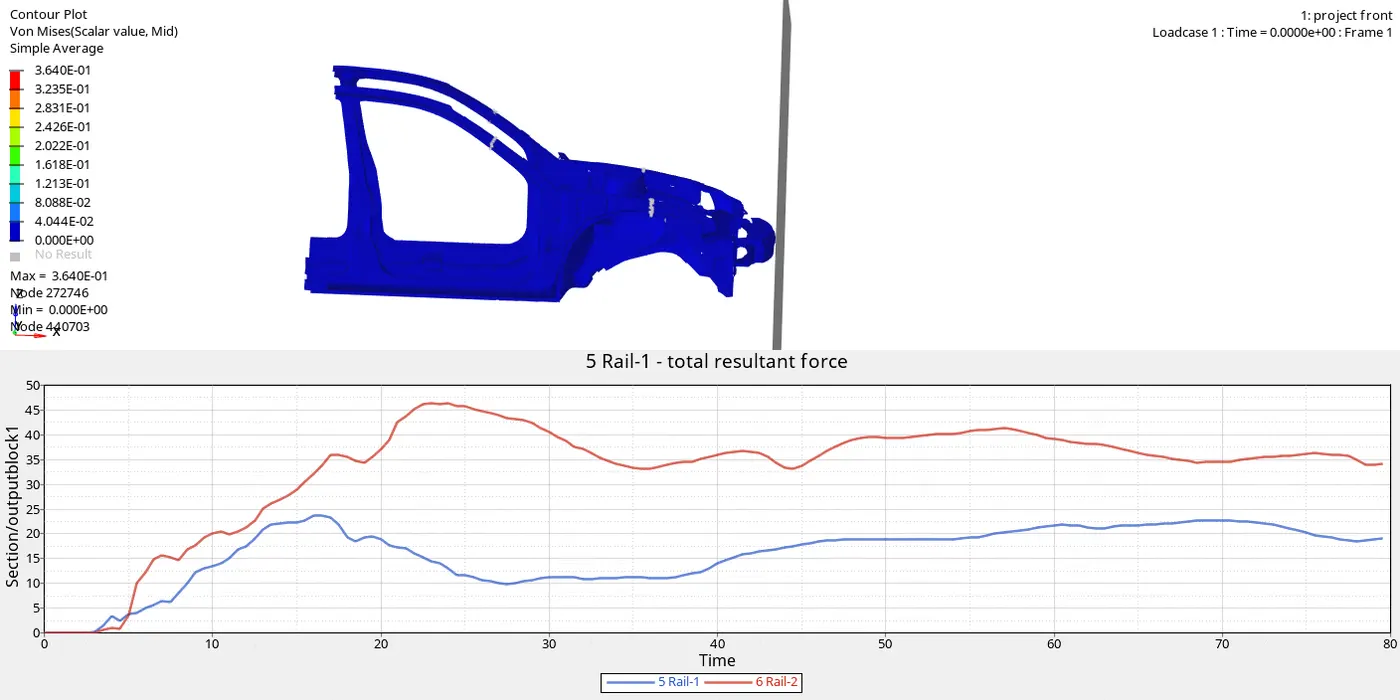
From the graph, the force acting on the rail-2 is greater than the force acting on the rail-1.
- It can be noted that the sectional forces vary across different part from where it is located with respect to time.
- From the graph, it can be noted that the force absorbed is 100%
- The shotgun absorbs almost 35% of the forces and the rail absorbs nearly 40% of the forces and the rest are transferred to the base
Graph-6: Acceleration Force on The B pillar:
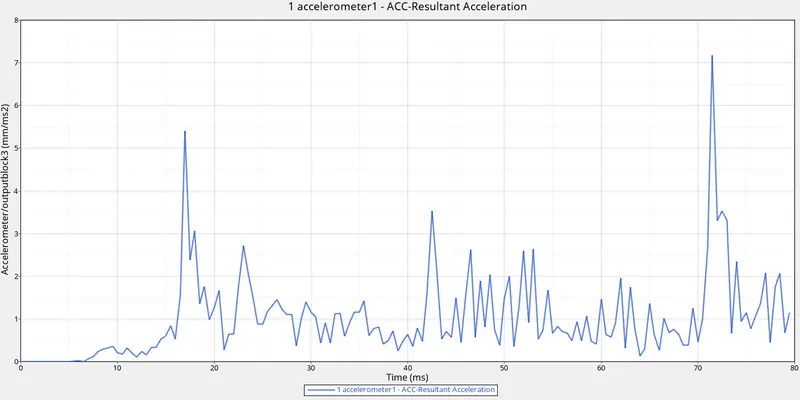
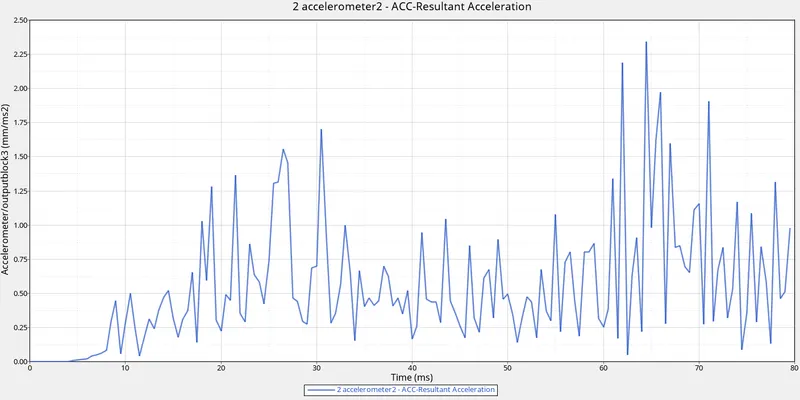
1. B- Pillar is the region where occupants are seated
2. Using Accelerometer acceleration at the nodes on B-Pillar is obtained
3. Peak acceleration values at both are almost the same with a slight variation.
4.The forces obtained in these nodes in the B pillar are comparatively less as most of the forces are absorbed in earlier stages of Impact.
Graph-7:Intrusions on the dash wall 66695,66244:
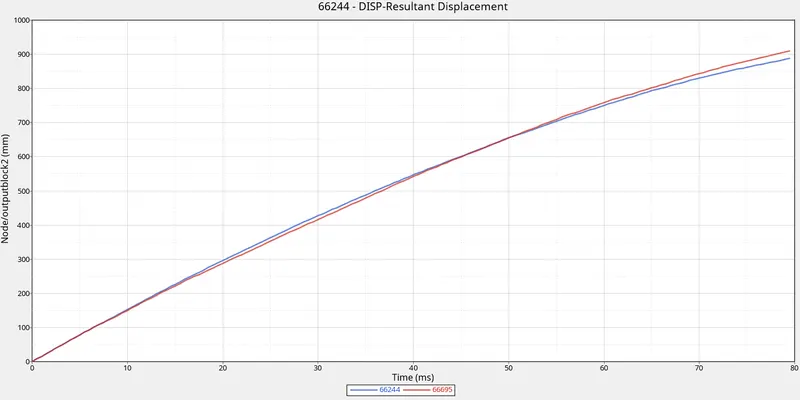
1. It is noted that the displacement increases over time, which indicates that the force is directly distributed on the nodes.
2. intrusions at braking and acceleration nodes are almost 850mm of displacement at 80ms.
CONCLUSION:
- From the above project, I've able to gain knowledge in simulating Frontal crashes and it's behavior.
- Got to Know about the Creation of cross-section and analyze the forces in the Cross-section.
- gained knowledge in creating Rigid wall, velocity, interface, and creating Output for those boundary conditions.