Assignment 6
Aim: To analyze, the frontal crash BIW of the car and observe the resultant output and energy plots from the simulation.
Objective:
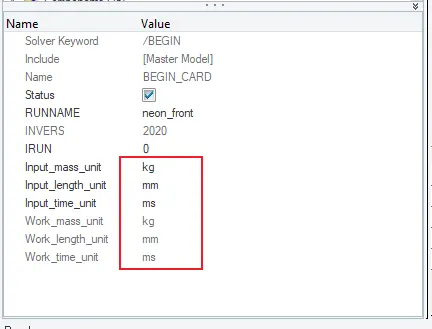
- Check unit system and either follow[Mg mm s] or [Kg mm ms].
- Create appropriate interface ,friction 0.2 and recommended parameters.
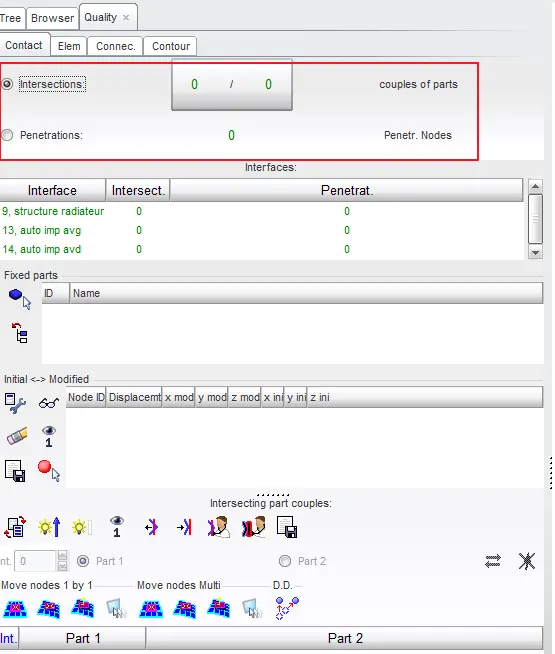
- Make sure of no penetrations and intersection.
- Correct rigid bodies if any issues.
- Create rigid wall with friction 0.1.
- Compare the model weight with the full scale 300k nodes model and use added masses to reach target weight 700kg while getting CG about the required range.
- Initial velocity 35 mph.
- Use model checker to ensure good quality.
- Time-step :0.5 to 0.1 microseconds.
- Run 80 ms.
Procedure:
Set- up has to be followed :
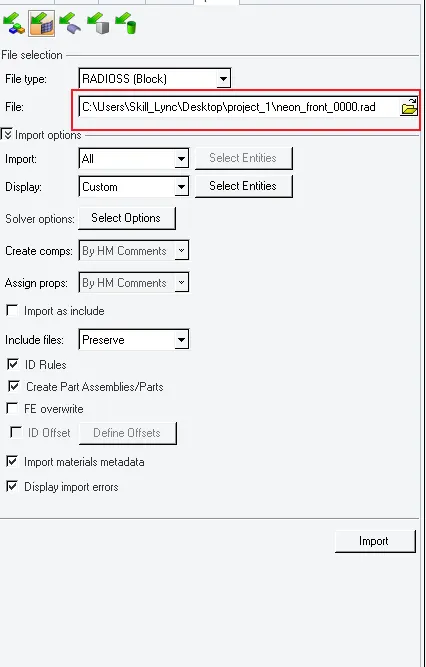
First, we want to import the neon_front file by using the import option and select the file that we want to import the data of file name neon_front_0000.rad that is reffered to as an input file of the simulation and click import. Now the file is imported and the import selection process and import file dialog box is shown below .
After importing , the input file a model will open and that is shown below ,
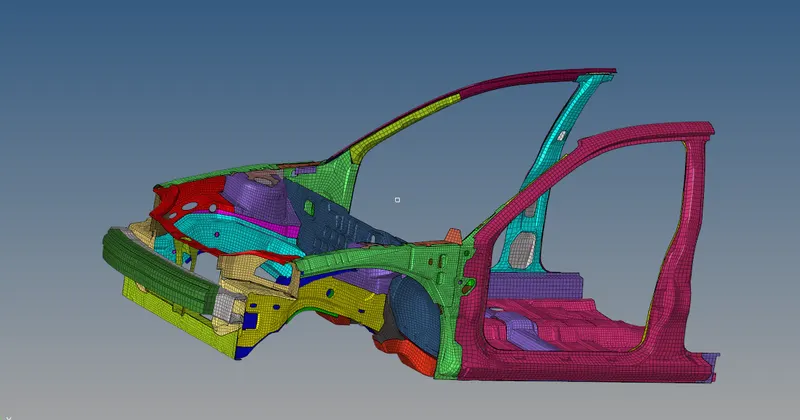
Fig. Open model
Now, check the unit system and verify that the same pattern of the unit system has followed in this simulation. It could be in either [Mg mm s] or [Kg mm ms] that are mentioned by the instructor. The unit system is required to obtain the resultant plots in the certain units. The unit system for this simulation is shown below .
After verifying the unit system to create an appropriate interface with the friction of 0.2 and using recommended parameters. Here there should be a default interface is present in the model that is shown below
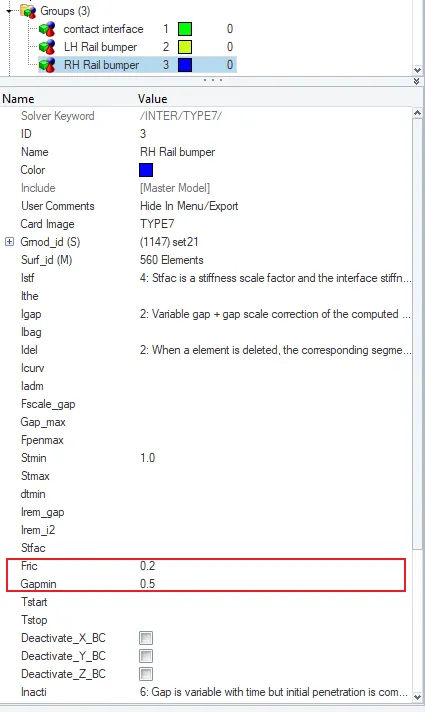
We are deleting the default interface (TYPE-7) that is present in this model because it indicate the group of different sectors of self contact in the vehicle.We want to create the total self contact in the vehicle. We want to ctreate the total self contact of the BIW body of the vehicle. Type-7 interface is using because it is node to surface contact .
Important Interface Parameters:
Igap - determine how the size of the gap is calculated
Gap_min - Minimum gap for activation of the interface.
Inactiv- Action to take if initial penetration exists.
Istf- affects how the stiffness of the interface is calculated .
Iform- friction formulation
St_min- Minimum stiffness to use in the interface.
Here the recommended parameters for the Type-7 interface and the friction of 0.2 that we entered are shown below ,
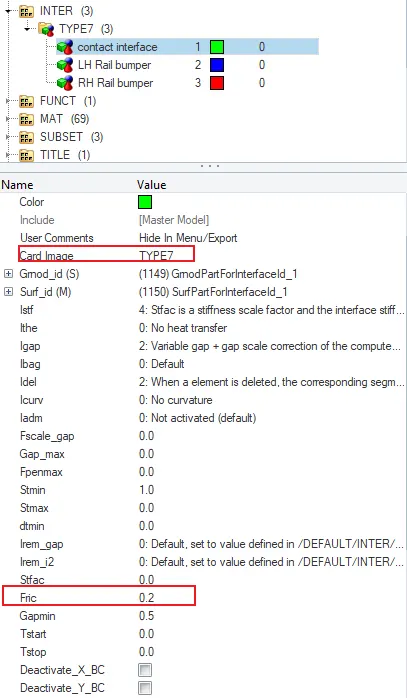
fig. self contact interface
Now check the penetration and intersection for the whole body of the vehicle,there are no penetration and intersection in body found hence the group is free from penetration and intersection .
Now, we want to check the rigid bodies by using the model checker option and if any issue may appear then clear that errors in this model , there are no issues occur.
Then create a rigid wall to crash the vehicle in a rigid wall and observe the simulation and energy between the wall and vehicle . Right click the solver >create >RWALL>select plane >enter the properties of the rigid wall of friction as 0.1 and the Dsearch as 2000. Select the engineering data and ensure the axis of XM,YM,ZM which denotes the vehicle movement from normal to the rigid wall. In XM axis we are selecting the vehicle bumper . Thereforwe the RWALL properties and the Data given in this simulation are shown below
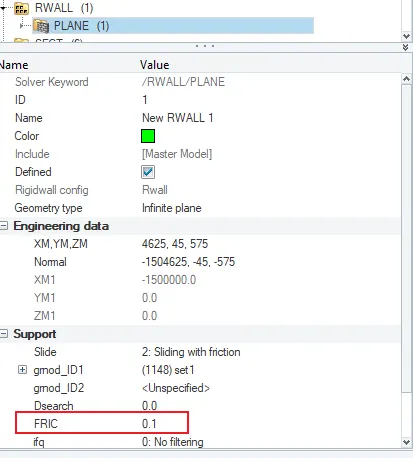
Fig. Rigid wall properties
A created rigid wall of friction as 0.1 and the frontal area is shown as below,
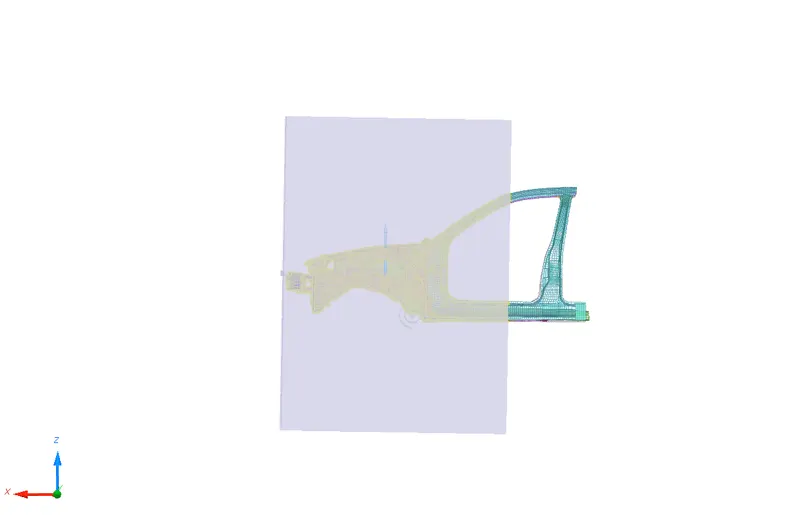
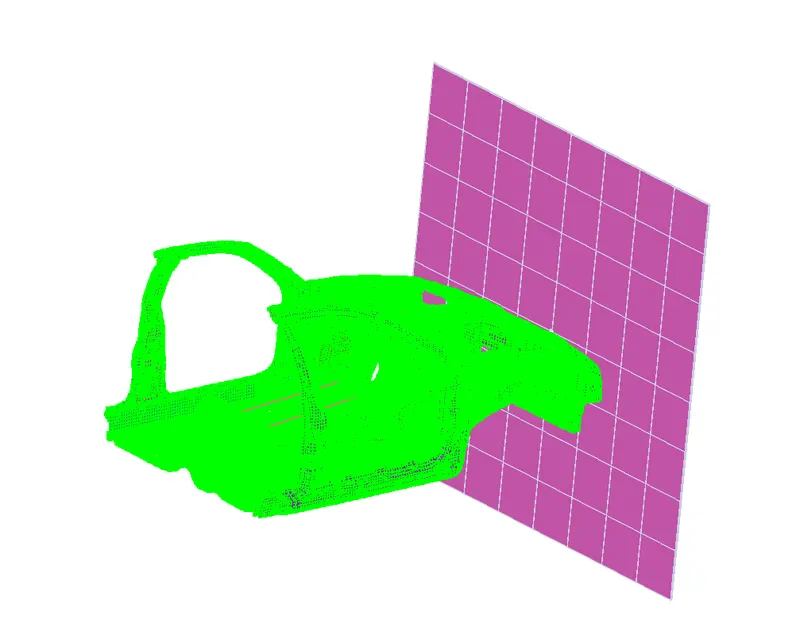
Frontal car with rigid wall
Now we want to move the CG in the required range by adding the mass for each node and to create the excess mass for selected certain nodes that is depends upon movement of CG. Ensure that CG is present between the centre of the driver seat . first, we verify that the actual total mass present in nodes by selecting the mass>balancing option in hypercrash. Before that, import the edited file which is worked on hypermesh into hypercrash.Here the actual total mass shows as 188kg for 300k nodes. To view, the CG click the overview option and view the model it will show the CG as adot point .
To move CG increase the mass value from 188kg to 700kg that value is mentioned by the instructor, By selecting Loadcase >added mass it shows the total nodes and the mass value for those nodes,In added mass , select type=1. It will create asection enter the mass value to add total mass value in frontal area of the vehicle by balancing mass CG will come to required position.
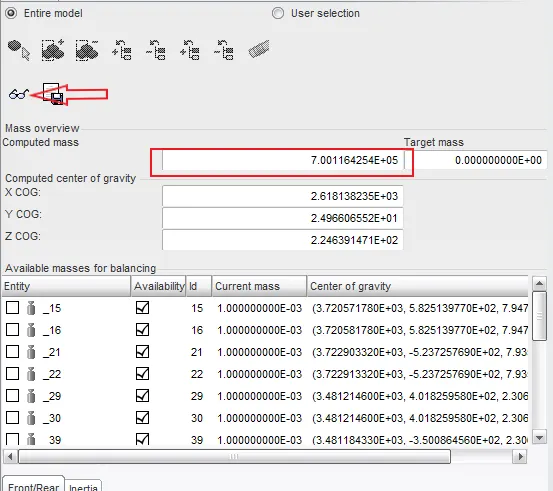
Fig. Value added mass
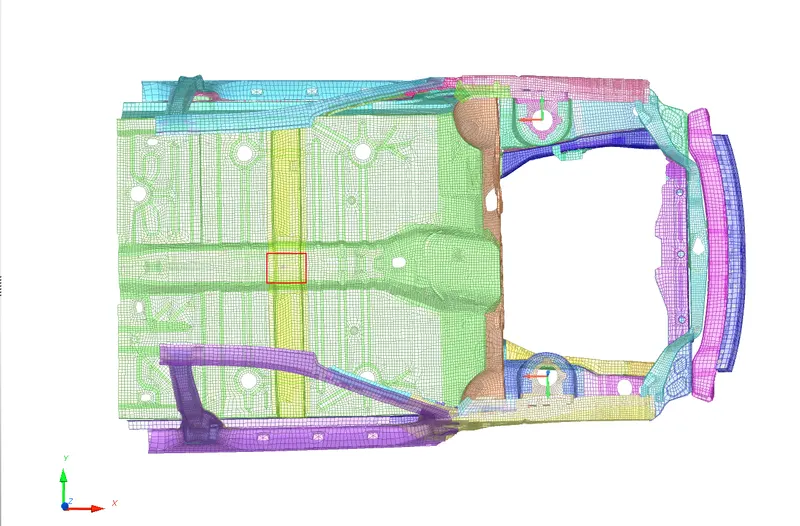
Fig. Centre Gravity point
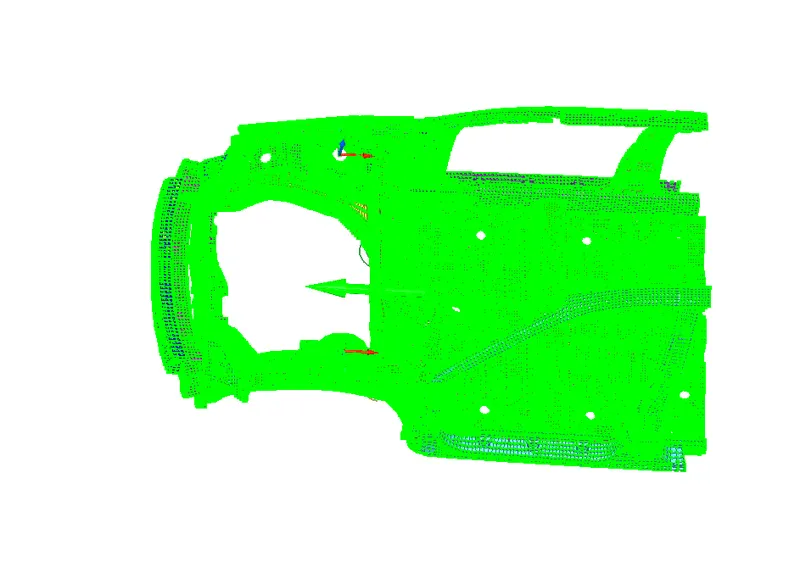
Now we want to give the Initial velocity of a vehicle as 35mph that is given by the instructor. By right click the solver>creare>INVEL>setup the properties by giving the value of velocity as 15.65mm/ms ,it is obtained by the uniot of 35mph.
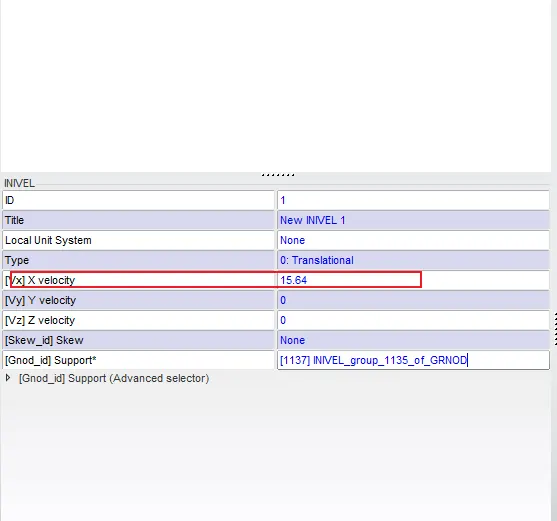
Then click Gnod_ID and select the group and comfirm it. Therefore the initial velocity is created shown below,
To mention the time step as 0.5 to 0.1 ms by selecting the solver >engine keywords>DT/Noda and enter the value of Tmin in that setup table as 0.001. And to set run time of simulation as 80ms by selecting Solver>Engine keywords>run>Tstop and enter the simulation run time . The time step and run time setup data are shown below,
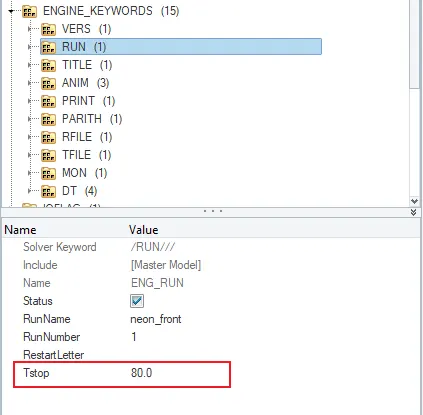
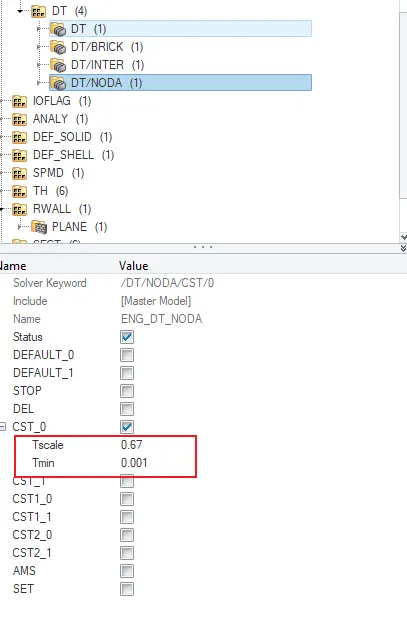
Fig. Time step and run time properties
OUTPUT REQUEST:
SECTIONAL FORCE:
After edited all the setup for the simulation then we have to set the output request that depends upon what the output we want in that simulation. Here we want to obtain the sectional force in the rail at location of indicated node 174247 and parallel opposite side node , to create the cross-section by selecting the solver>create>SECT> then we want to create a movable frame in that cross-section and select nodes of origin ,X-axis and XY axis to obtain the normal N direction opposite from the crash direction x. Below image shows the recomended nodes section force and the created frames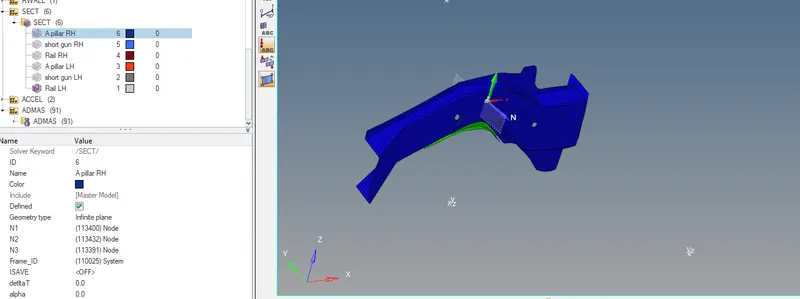
Fig. cross-section
In a movable frame , we want to select the origin node(N1) , axial node (N2), and plane node (N3). The same node intimate in the system is required in the section node ID. Anode selection and the axis point for the sectional force is shown below,
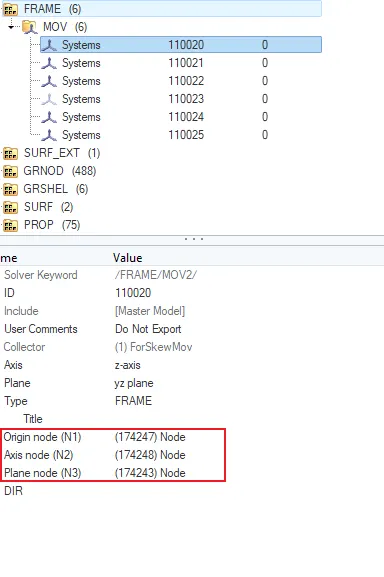
Frame property
Force
A-PILLAR CROSS-SECTION FORCE
To create the cross-section by selecting the solver >create>SECT>then we want to clear a movable frame in that cross-section and select the nodes of origin, X-axis ,and XY axis to obtain the normal N direction opposite from the crash direction X. This frame is created for the analysis of F3 force that is normal Z here they are considered as a sectional force while on the crash simulation. we want to select the origin node(N1) , axial node (N2), and plane node (N3). The same node intimate in the system is required in the section node ID. Anode selection and the axis point for the sectional force is shown below,
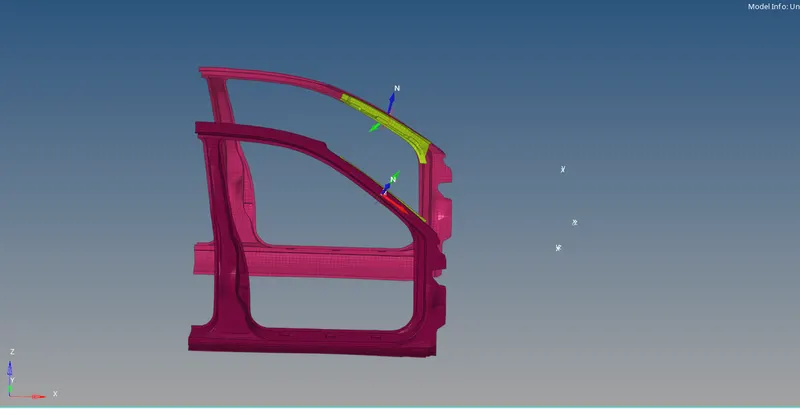
Fig. A-pillar cross-section
here all the cross-sections and the frames are shown below ,
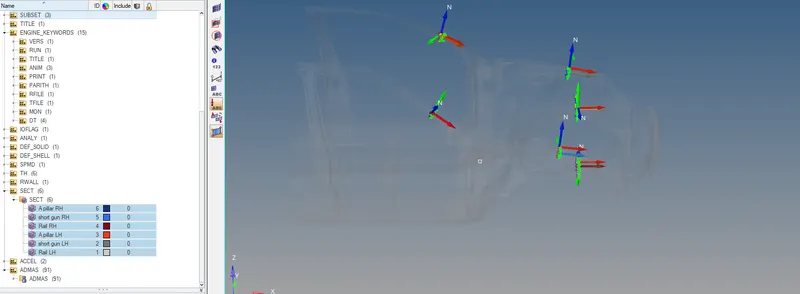
Fig. Cross-section and the frames
ACCELEROMETER:
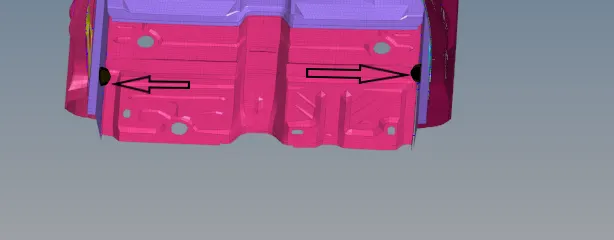
Here we want to observe the output of the accelaration curve received on the accelerometer at the base of the B-pillar. By selecting the solver>right click> and select create>ACCEL it will create acceleration of the B-Pillar. It create accelerometer for that node same procedure is followed for opposite side of B-pillar shown below,
INTRUSION:
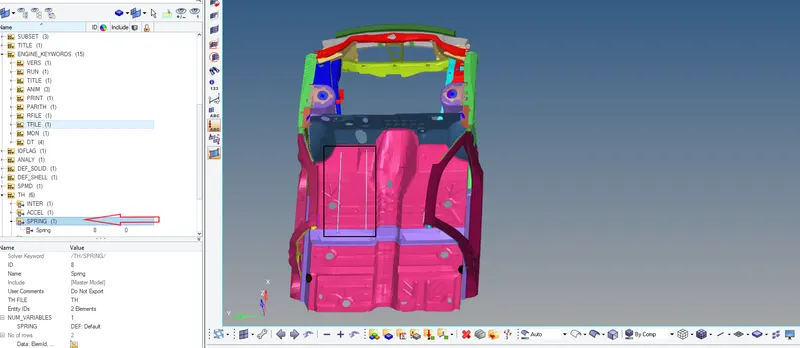
To create the intrusion on the dash wall at nodess of 66695 and 66244. by selecting the solver>TH>node>and click the select Entity Ids and right click on the node selection tab and enter the node number it will consider that node for output observation. The same procedure is followed for 66244 node hence it is created and that is shown below;
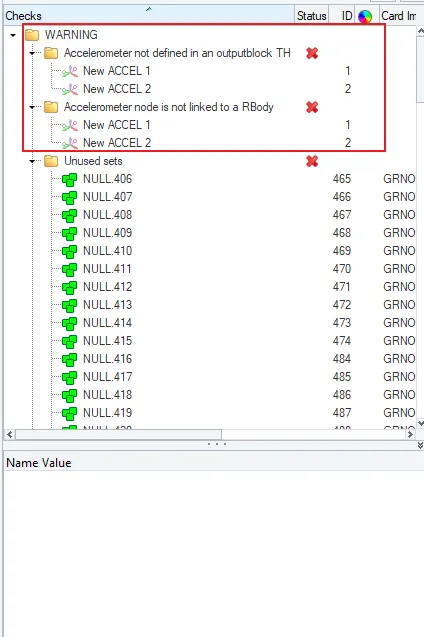
Before running the simulation check wether the model is in good condition or not by using the model checker option. Now import the model into hypercrash and select quality>model checker>click run icon it will check the total model and show the results. If any errors will appear after the completion of the model checker , clear the errors to run the simulation.Here the model checker is run completely and that run completely and that is shown below,
OUTPUT PLOTS:
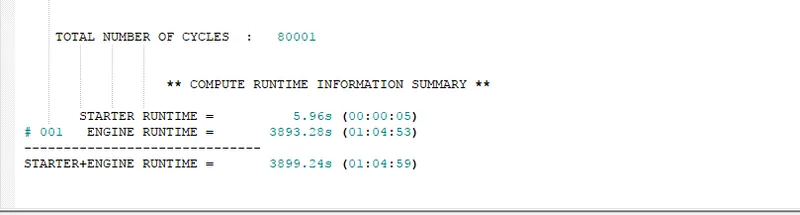
The total number of cycles and the simulation time also noticed in that output given below:
ENERGY PLOTS:
To create the plot for each energy and absorbs that what was happening during the crash and how could the element get deforming while applying some force.
Now select hyperchart option that will give the empty graph as adisplay. Import the file Frontal_crashT01 and click the apply option.
AXIAL FORCE:
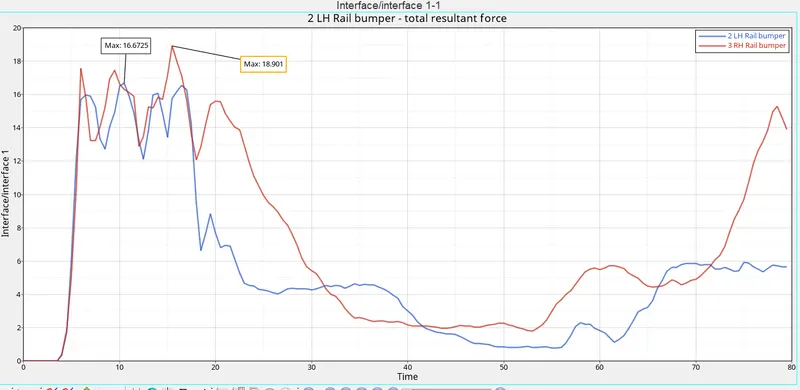
The above graph shows the axial force received on the rails from the bumper during the crash simulation. It is obtained by creating the interface between rail and the bumper in that interface we are giving the master as the bumper and slave as the rails. The axial force is obtained when frontal area is crashed on the rigid wall the slave is impacting with the master node and that the force is obtained here. The maximum axial force is observed in this simulation is 18.901KN at the time of 17ms. The recommended parameter of the type-7 interface are executed for this simulation .Due to the contact interface between the master and the slave nodes the axial force is observed from the rail in this plot.
SHORTGUN CROSS-SECTION FORCE:
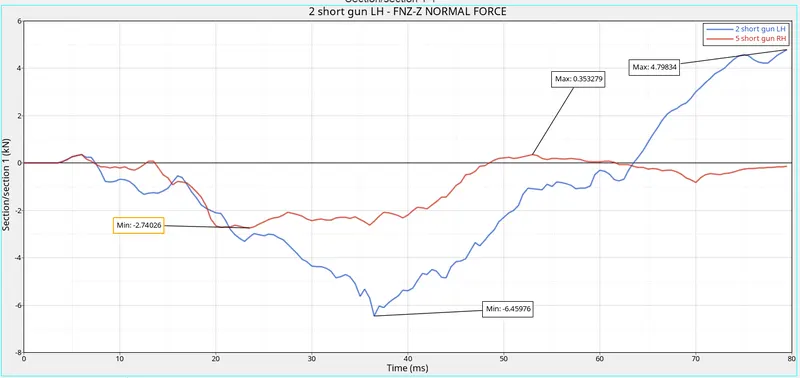
From the above graph ,we are observing the shortgun cross-sectional force that is created on the parallel side of the shortgun part in the vehicle .A shortgun cross-section force is created to observe the force during the crash of the vehicle , the direction is defined by the moving frame through the normal Z direction.
Each cross-section represents each skew system that should be indicated in that cross-section properties. The graph shows the maximum value for one side of the shortgun force is 6.45976KN at the time of 37ms and the other side is 2.74026KN at the time of 25ms this difference is due to the mass differences and the frame direction acted on the forces In this result , the force we obtained is irrespective of the direction so positive and negative value is not considered it will change through the movement of the frame during the crashing. By comparing with these two shortgun sectional forces left side shortgun obtain more forces of 6.45976KN compare with the right side shortgun force 2.74026KN this may depend upon the value-added mass in the vehicle.
A-PILLAR CROSS-SECTION :
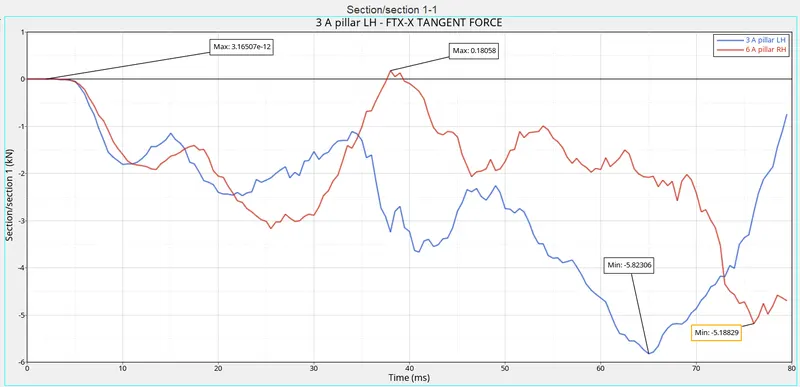
From the above graph , we are observing the A-pillar cross-sectional force that is created on the parallel side of the A-pillar in the vehicle .A shortgun cross-section force is created to observe the force during the vehicle crash, the direction is defined by the moving frame through normal z direction . Each cross-section represents each each skew skew system that should be indicated in the cross-section properties. The graph show the maximum value for the one side of the A-pillar force is 5.82306KN at the time of 65ms this difference may appear due to the node differences and the frame direction acted the force. In this result , the force we obtained is irrespective of the direction so positive and negative is not considered it will change through the movement of the frame during the crashing. By comparing with these two A-pillar sectional forces left side of the A-pillar obtained more force 5.82306KN compared to the right side A-pillar force 5.18829KN this may depend upon the value added mass in the vehicle.
ACCELEROMETER:
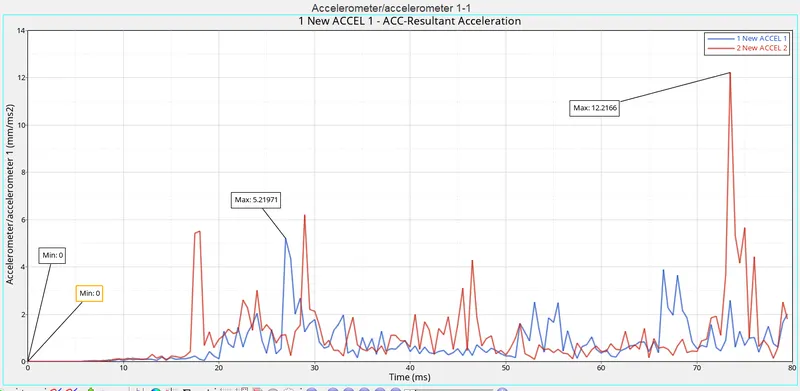
Fig. Accelerometer plot
The accelerometer is observed in each B-pillar of the vehicle by the selecting the base node of the two pillars and include the node for the output blocks to find the accelerometer in each pillar. The above graph shows that accelerometer 1 and accelerometer 2 are stable up to 7ms and it gets raise upto 10ms. Maximum point of accelerometer 1 is 5.21971mm/ms^2 at the time of 28ms and the accelerometer 2 is 12.2166mm/ms^2 at the time of 74ms. These difference is due to the deformation of elements and the added mass during the CG.
INTRUSION:
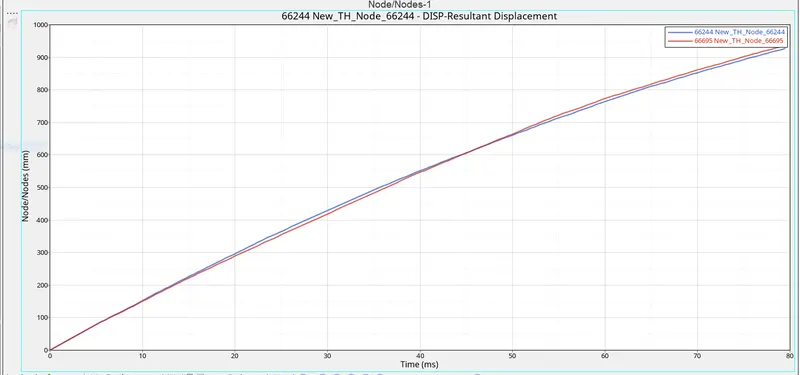
The intrusion is the process of identifying the displacement of some refrence point or line or node . Here we can calculating the displacement of the two nodes in dash wall such as 66695 and 66244 are there node ID . The node are selected and the above graph shows the two displacement points of these two nodes.The maximum displacement point in node 66695 is 934.168 mm at the time of 78ms and the maximum displacement point in node 66244 is 875.84mm at the time of 78msBy comparing these two nodes, the node 66695 takes more displacement during the crash simulation.
CONTACT ENERGY :
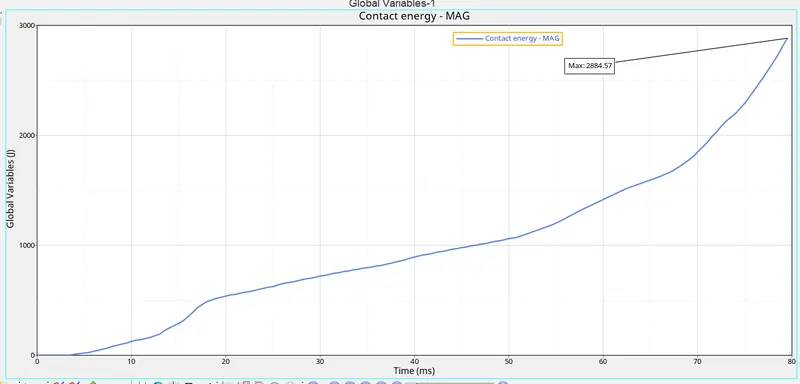
A contact energy is observe during vehicle crashing on the rigid wall it will get deformation of element and the penetration is also appear in the crash simulation. The force is created between the master and the slave node during the penetration the force and the penetration is calculated as the contact energy .Here the contact energy is calculated during the maximum point of 2884.57 J when the time of 78ms.
LEARNING OUTCOME:
Setup the model and create the card and their properties for the frontal crash analysis using hypermesh, Radioss and the hypercrash. To know the types of force needed to calculate during the analysis.Analysis of frontal crash simulation is done.
CONCLUSION:
Hence the frontal crash simulation is done and has obtained the output plots for the sectional force in the rails, the axial force received on the rail from the bumper, shortgun cross-section , A-pillar crossection , acceleration curve , and the intrusion on the dashwall. Therefore the frontal area of the vehicle is crashed on a rigid wall hence energy error observed as 0.00% and the mass error observed as 0.000 % , so the study is finally done.