Assignment 5-RADIOSS Interfaces & Study of Effect of Notches Challenge
Objective
To perform the meshing of the provide Bumper component and run the simulation for the crash tube with different condinditions(i.e. chaniging type, creation and deletion of notches in various cases) as mentioned in the question.
1.Bumper Meshing
In this the meshing operation is performed on the bumper model with the element size of 6 mm,then the model is checked for the free edges etc.
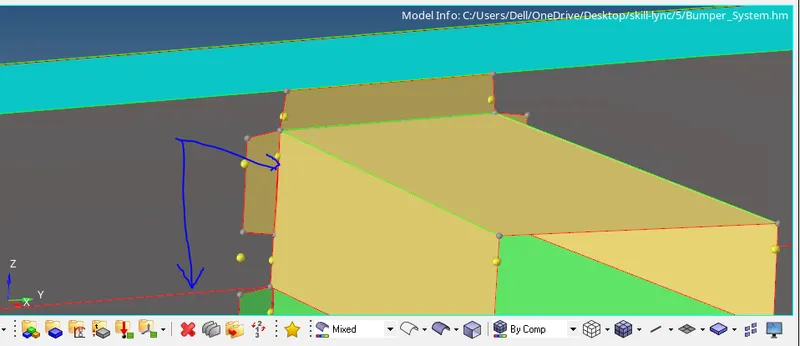
- In the first step after importing the file toggle the edges at sthe shown location to create connected surfaces.
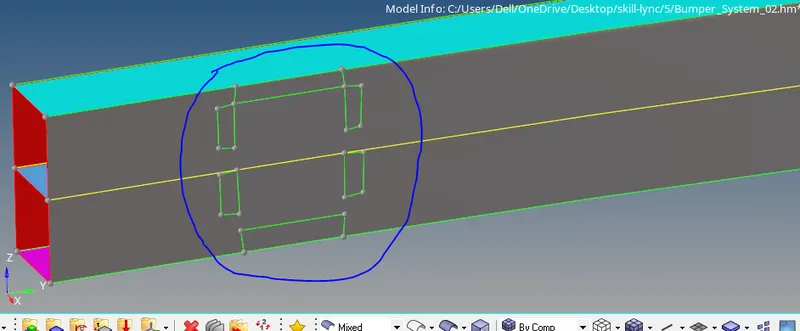
- After this create the patches as shown in image by taking the surface trim to connect the two geomtries in the model.
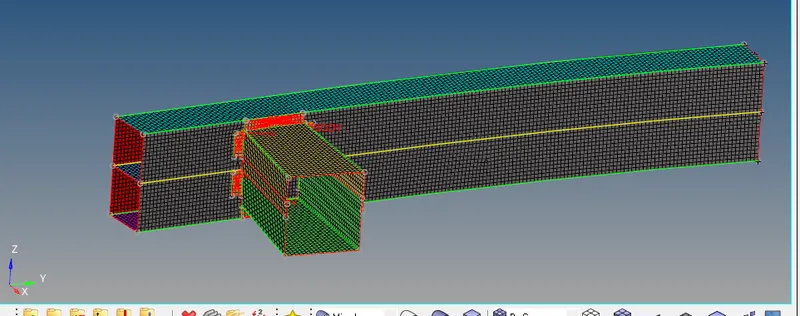
- Once the patches are trimed on the surface then start meshing the component with the required element size.
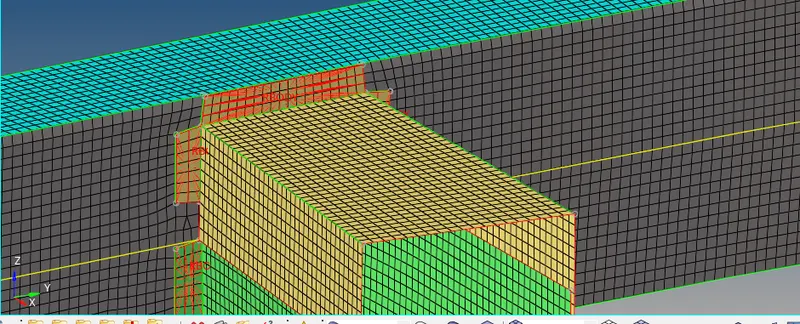
- After the meshing is done create a component named RIGIDS and use the path node to create the rigids at patch locations to connect the two model. fpr creating rigids go to 1-D panel rigids and then create the rigids at required location.
2. Simulation run
Case 01
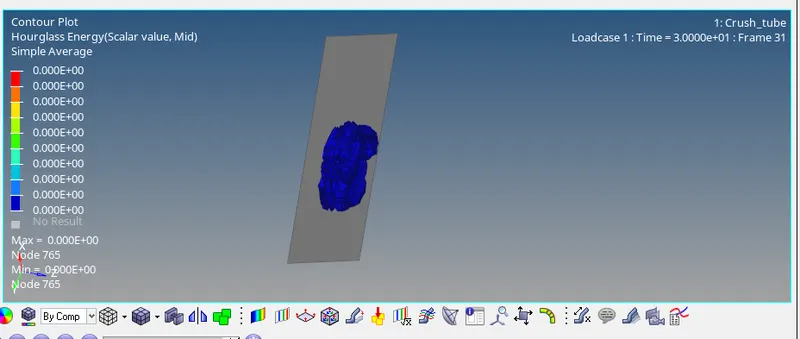
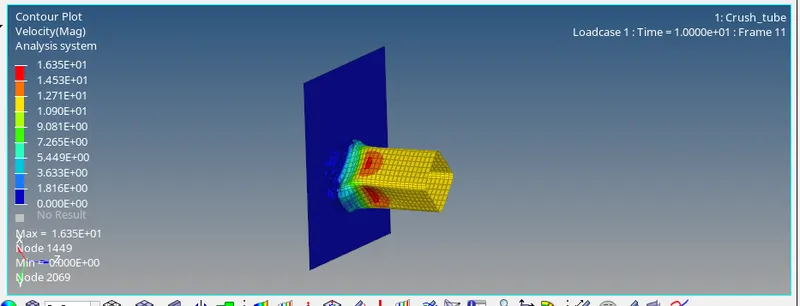
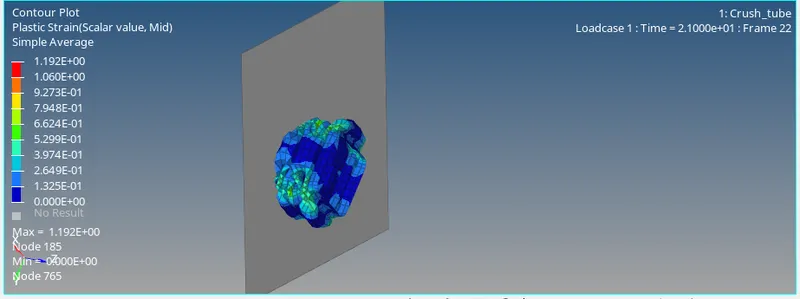
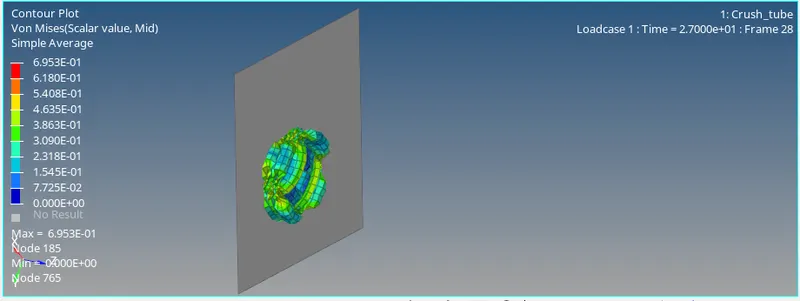
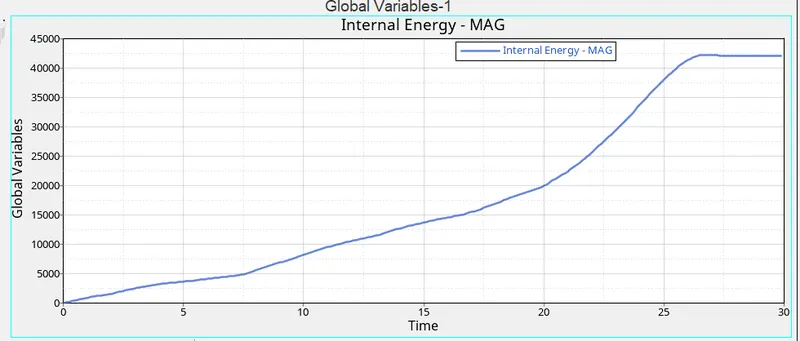
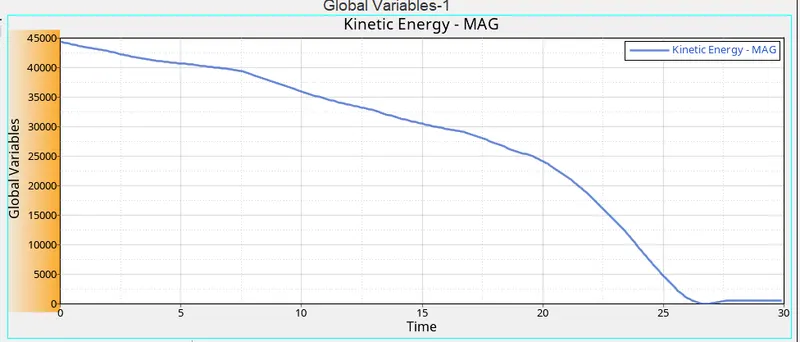
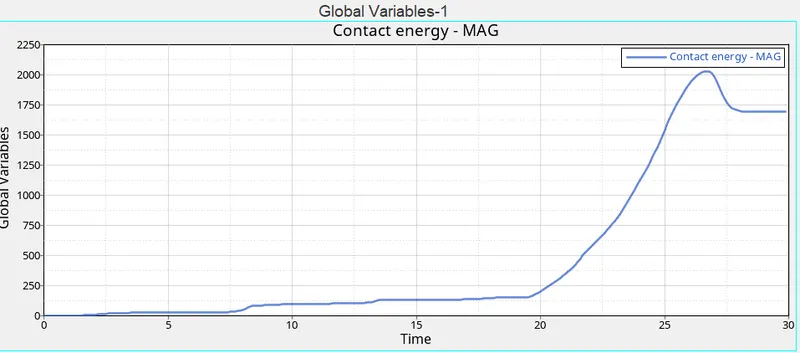
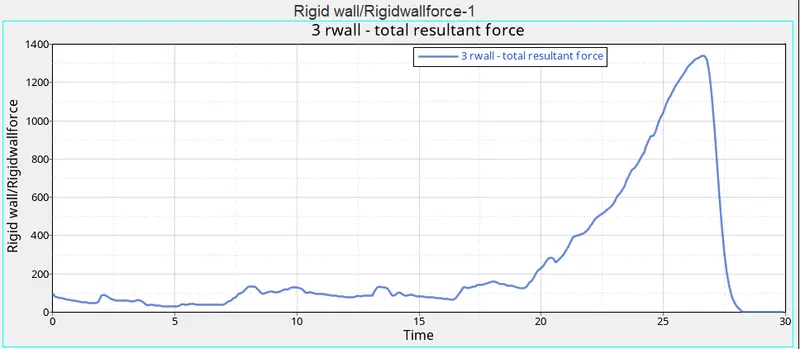
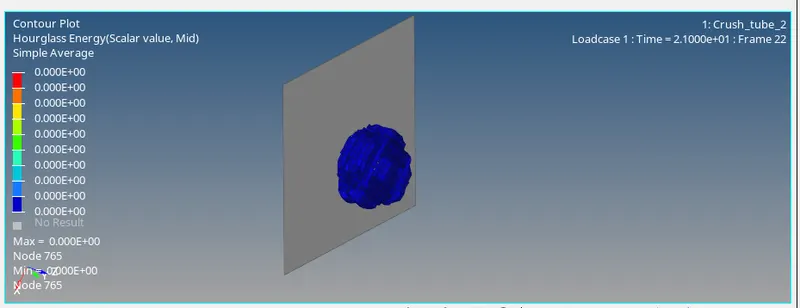
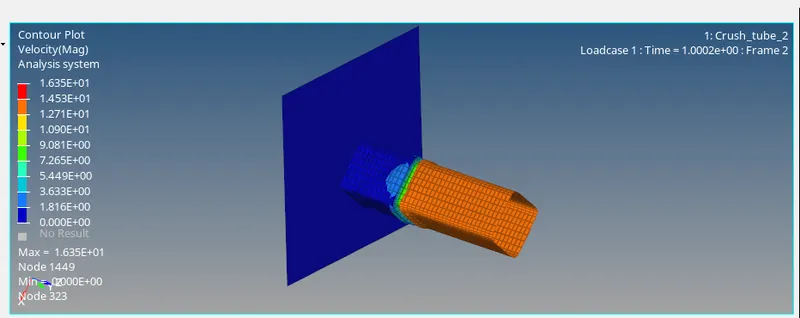
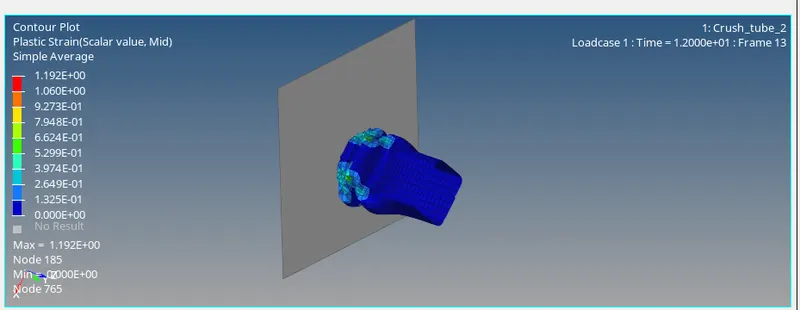
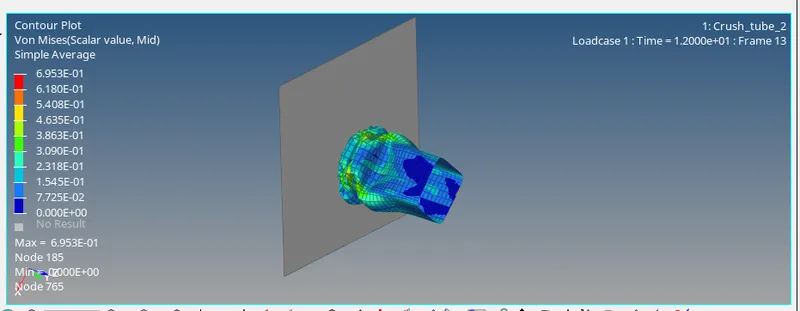
- In this case the provide model is run without making any changes to it and then the contours are plotted for hourglass , velocity , plastic strain and von misces stress, also the graph are plotted for the internal energy kinetic energy, contact energy and rigid wall forces as mentioned in the question.
- The general procedure is followed for running the model , once the rad file is imported import menu the model is switched to mesh view from wireframe mode.
- Then the analysis tab is selected and the location directory for saving the files is specified and the simulation is run.
- Once the simulation is completed then it is checked that energy error and mass error are under the specified range or not .
- For case 01 the energy error is -3.8 % and mass error is 0 % is which is under the required range.
- After this hyperview is opened and the required contours are plotted for hourglass , velocity , plastic strain and von misces stress, also the graphs are plotted for the internal energy kinetic energy, contact energy and rigid wall forces
 Case 02
- In this case the provide model is run by changing the Inacti=6 and then the contours are plotted for hourglass , velocity , plastic strain and von misces stress, also the graph are plotted for the internal energy kinetic energy, contact energy and rigid wall forces as mentioned in the question.
- The general procedure is followed for running the model , once the rad file is imported import menu the model is switched to mesh view from wireframe mode.
- Then the analysis tab is selected and the location directory for saving the files is specified and the simulation is run.
- Once the simulation is completed then it is checked that energy error and mass error are under the specified range or not .
- For case 02 the energy error is -3.8 % and mass error is 0 % is which is under the required range.
- After this hyperview is opened and the required contours are plotted for hourglass , velocity , plastic strain and von misces stress, also the graphs are plotted for the internal energy kinetic energy, contact energy and rigid wall forces.
 Case 03
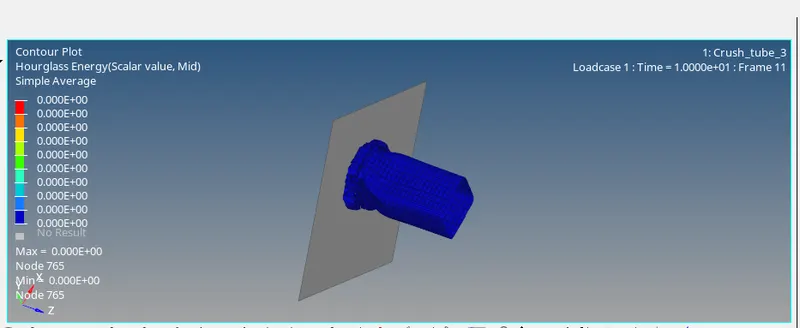
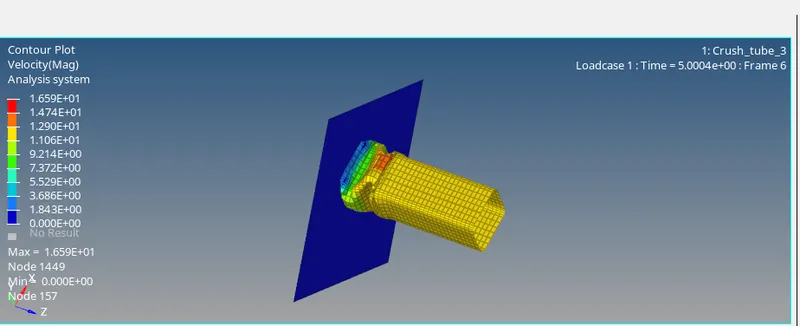
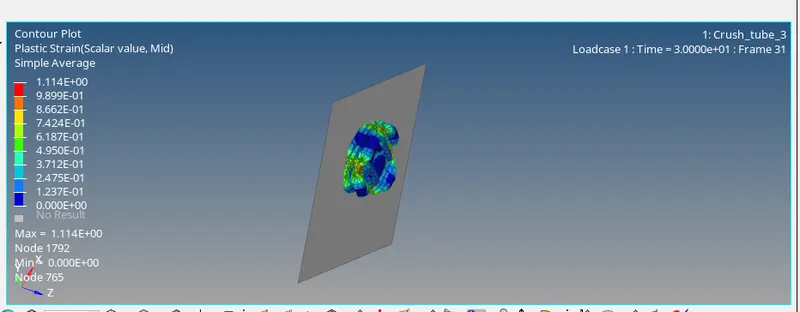
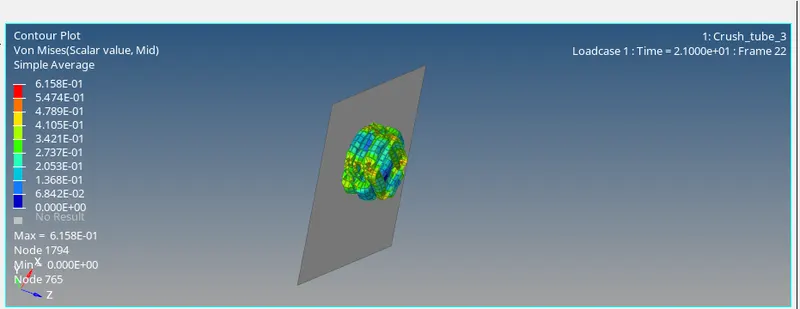
- In this case the provide model is run by creating the type 11 contact and then the contours are plotted for hourglass , velocity , plastic strain and von misces stress, also the graph are plotted for the internal energy kinetic energy, contact energy and rigid wall forces as mentioned in the question.
- The general procedure is followed for running the model , once the rad file is imported import menu the model is switched to mesh view from wireframe mode.
- Then the analysis tab is selected and the location directory for saving the files is specified and the simulation is run.
- Once the simulation is completed then it is checked that energy error and mass error are under the specified range or not .
- For case 03 the energy error is -4.1% and mass error is 0 % is which is under the required range.
- After this hyperview is opened and the required contours are plotted for hourglass , velocity , plastic strain and von misces stress, also the graphs are plotted for the internal energy kinetic energy, contact energy and rigid wall forces.
Case 04
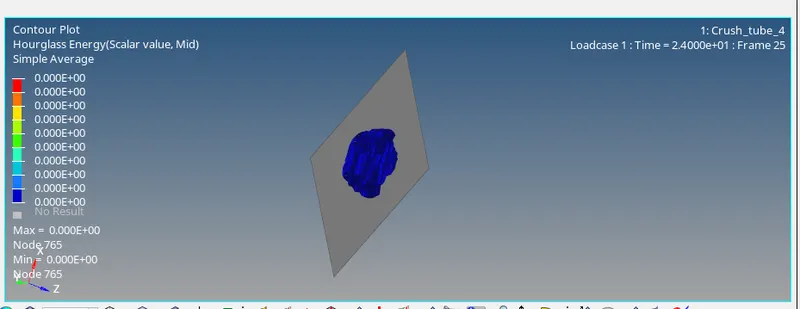
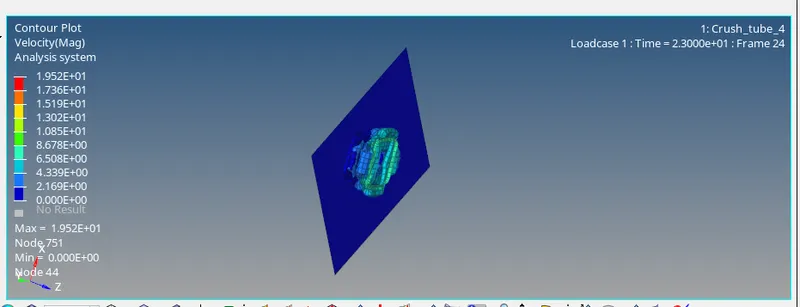
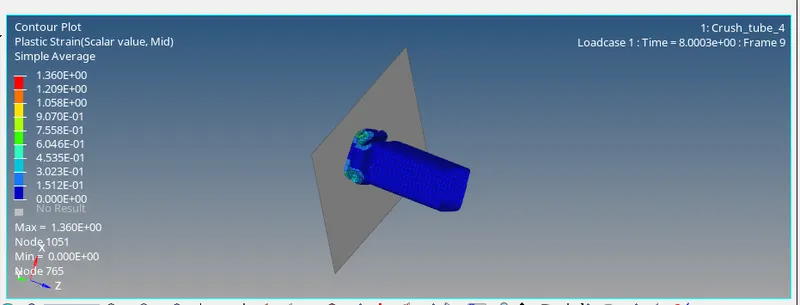
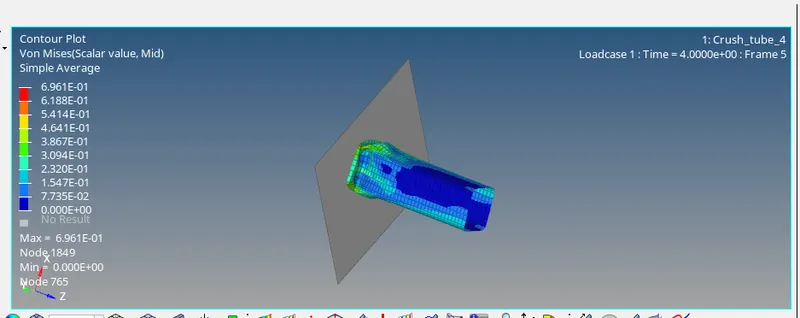
- In this case the provide model is run by removing both notches and removing boundary condition on rigid body node and then the contours are plotted for hourglass , velocity , plastic strain and von misces stress, also the graph are plotted for the internal energy kinetic energy, contact energy and rigid wall forces as mentioned in the question.
- The general procedure is followed for running the model , once the rad file is imported import menu the model is switched to mesh view from wireframe mode.
- Then the analysis tab is selected and the location directory for saving the files is specified and the simulation is run.
- Once the simulation is completed then it is checked that energy error and mass error are under the specified range or not .
- For case 04 the energy error is -2.7 % and mass error is 0 % is which is under the required range.
- After this hyperview is opened and the required contours are plotted for hourglass , velocity , plastic strain and von misces stress, also the graphs are plotted for the internal energy kinetic energy, contact energy and rigid wall forces.
Case 05
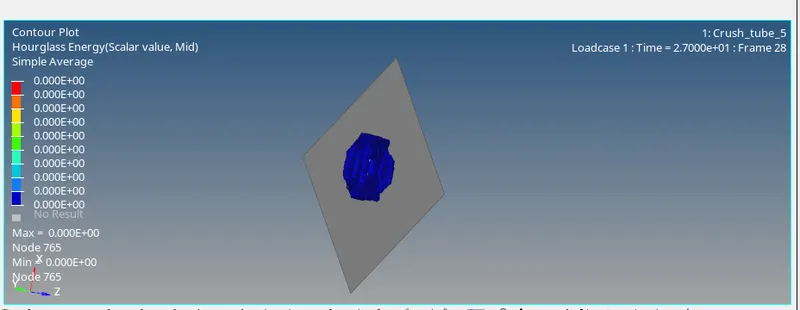
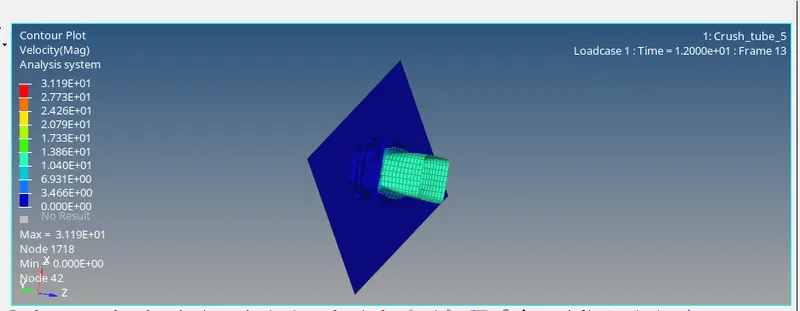
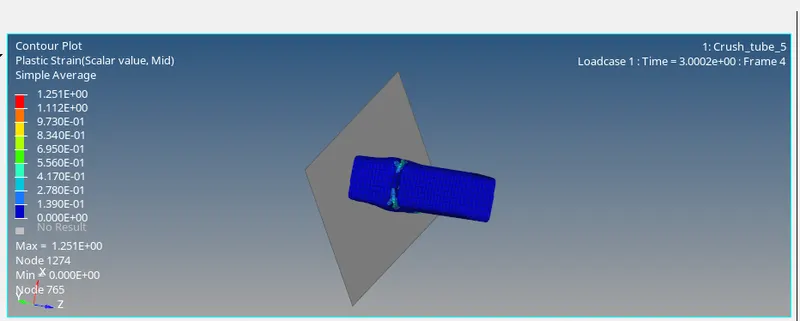
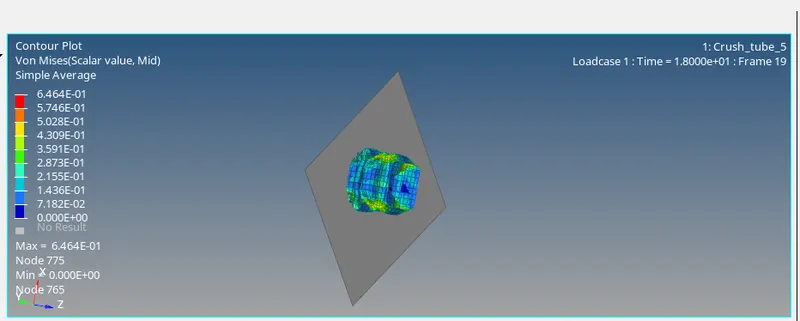
- In this case the provide model is run by creating a new notch in the middle ,select the whole section and then the contours are plotted for hourglass , velocity , plastic strain and von misces stress, also the graph are plotted for the internal energy kinetic energy, contact energy and rigid wall forces as mentioned in the question.
- The general procedure is followed for running the model , once the rad file is imported import menu the model is switched to mesh view from wireframe mode.
- Then the analysis tab is selected and the location directory for saving the files is specified and the simulation is run.
- Once the simulation is completed then it is checked that energy error and mass error are under the specified range or not .
- For case 05 the energy error is - 3.3 % and mass error is 0 % is which is under the required range.
- After this hyperview is opened and the required contours are plotted for hourglass , velocity , plastic strain and von misces stress, also the graphs are plotted for the internal energy kinetic energy, contact energy and rigid wall forces.
 Case 06
- In this case the provide model is run creating a new notch with nodes only from opposing 2 faces and then the contours are plotted for hourglass , velocity , plastic strain and von misces stress, also the graph are plotted for the internal energy kinetic energy, contact energy and rigid wall forces as mentioned in the question.
- The general procedure is followed for running the model , once the rad file is imported import menu the model is switched to mesh view from wireframe mode.
- Then the analysis tab is selected and the location directory for saving the files is specified and the simulation is run.
- Once the simulation is completed then it is checked that energy error and mass error are under the specified range or not .
- For case 06 the energy error is -0.6 % and mass error is 0 % is which is under the required range.
- After this hyperview is opened and the required contours are plotted for hourglass , velocity , plastic strain and von misces stress, also the graphs are plotted for the internal energy kinetic energy, contact energy and rigid wall forces.
Result Tabular Data
|
Cases |
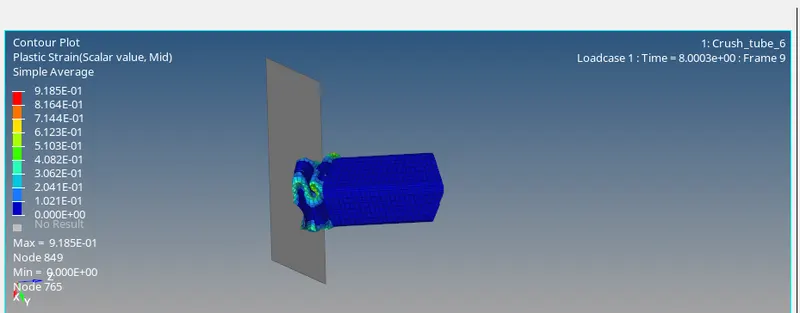
Max Plastic Strain |
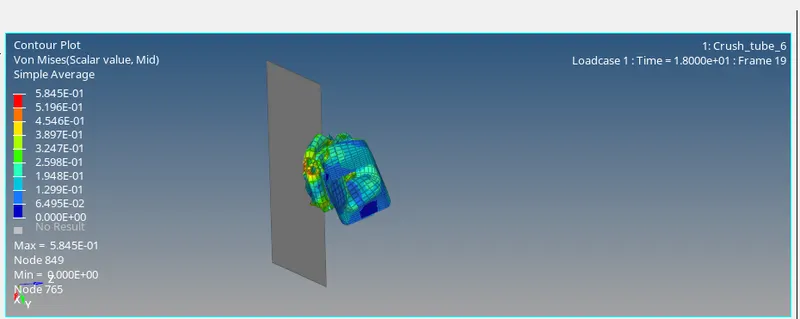
Max Von Mises |
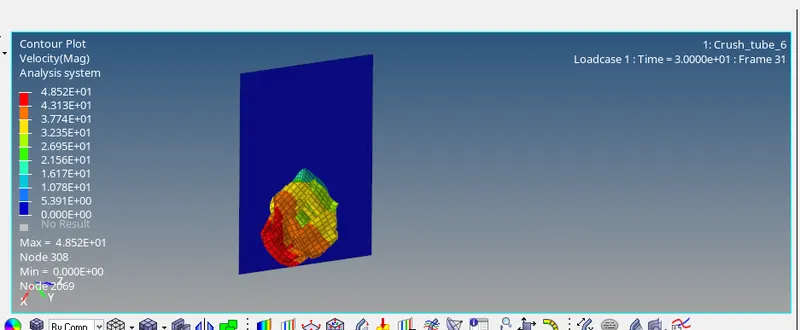
Max Velocity |
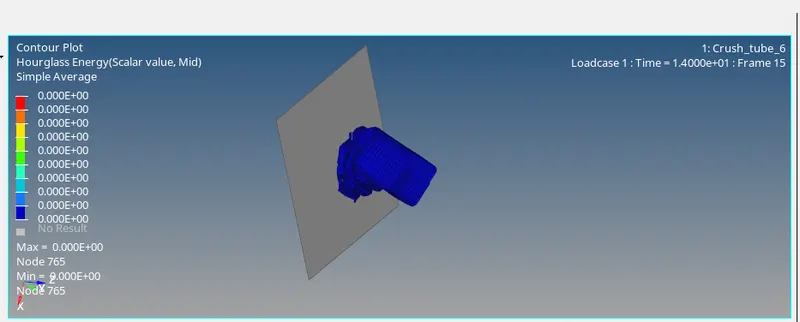
Max Hourglasss energy |
Simulation time (s) |
No of cycle |
|
Case 01 |
1.192 | 6.953e-1 | 1.635e+1 | 0 | 751.22 | 83469 |
|
Case 02 |
1.192 | 6.953e-1 | 1.635e+1 | 0 | 745.99 | 83469 |
|
Case 03 |
1.114 | 6.158e-1 | 1.659e+1 | 0 | 756.84 | 83455 |
|
Case 04 |
1.360 | 6.961e-1 | 1.952e+1 | 0 | 476.53 | 77243 |
|
Case 05 |
1.251 | 6.464e-1 | 3.119e+1 | 0 | 796.17 | 89830 |
|
Case 06 |
9.185e-1 | 5.845e-1 | 4.852e+1 | 0 | 439.83 | 84693 |
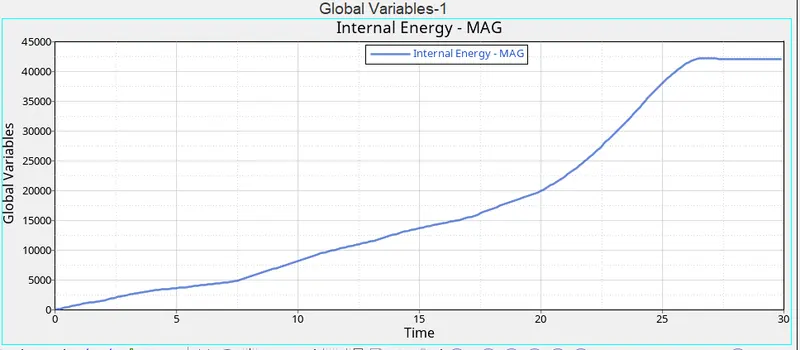
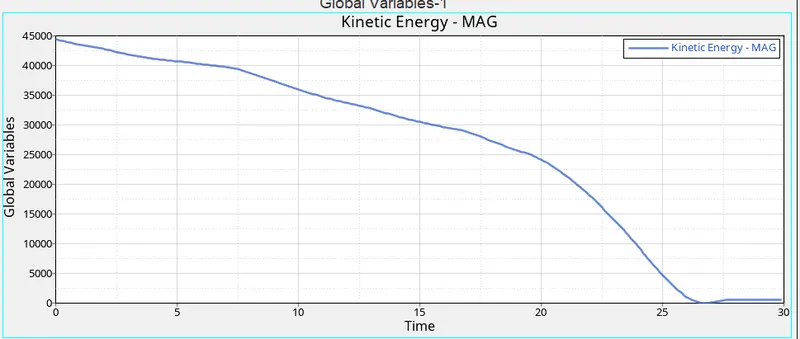
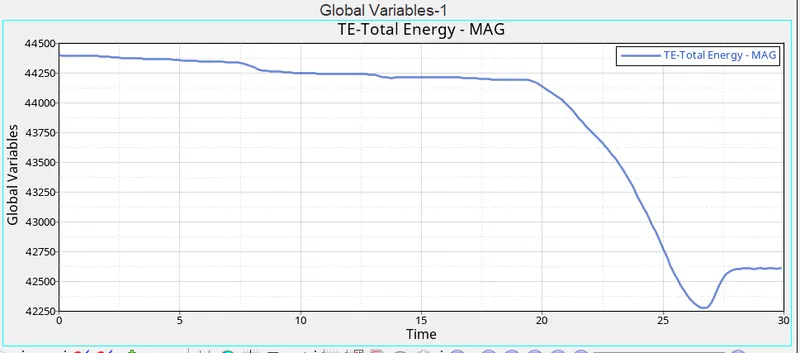
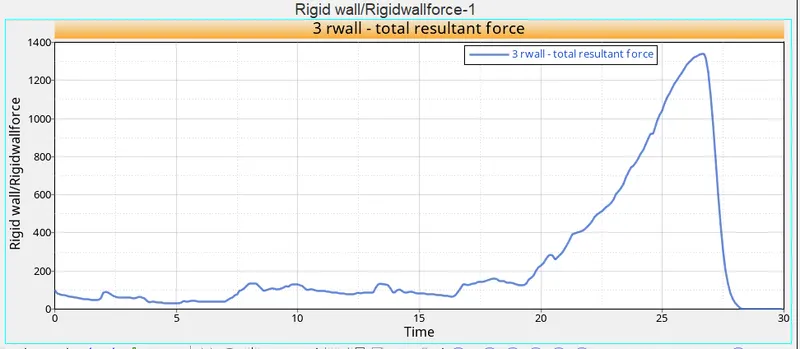
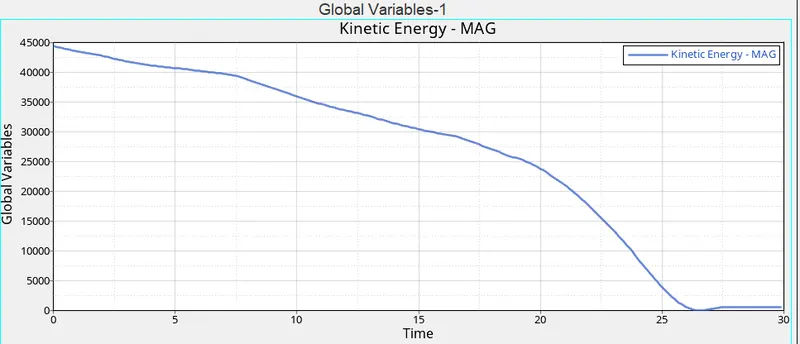
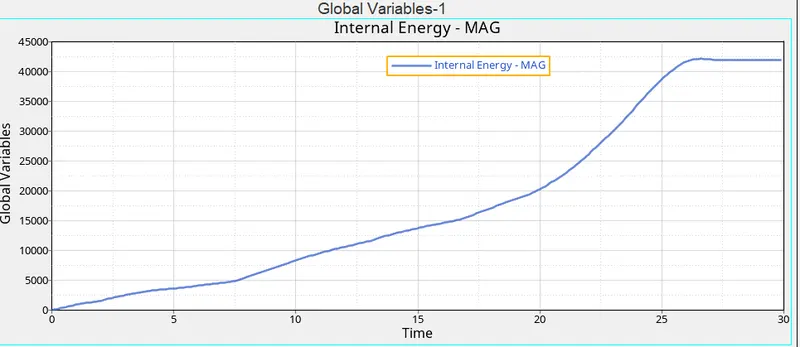
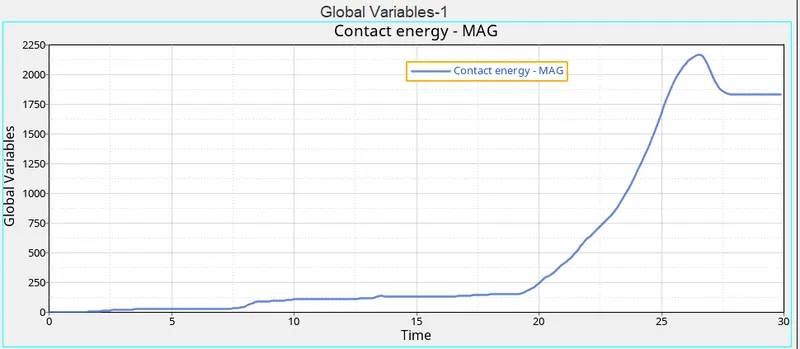
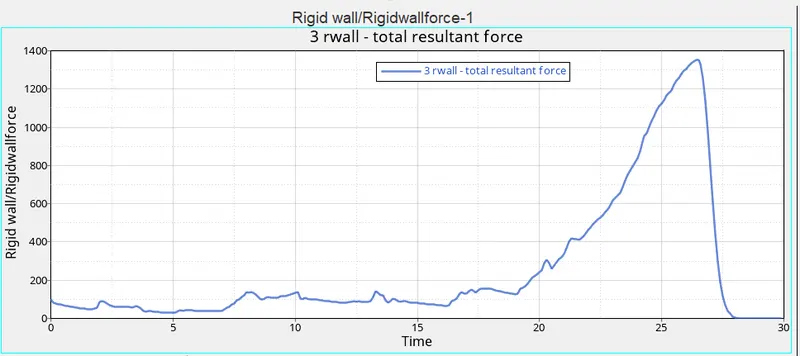
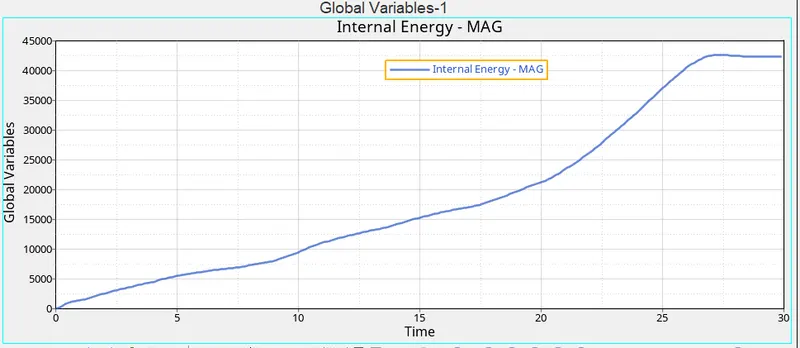
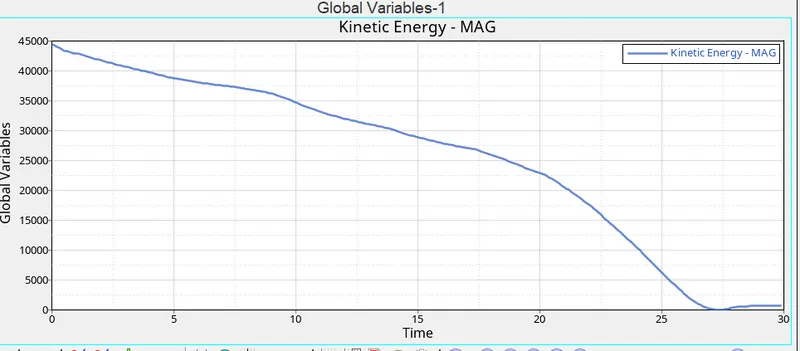
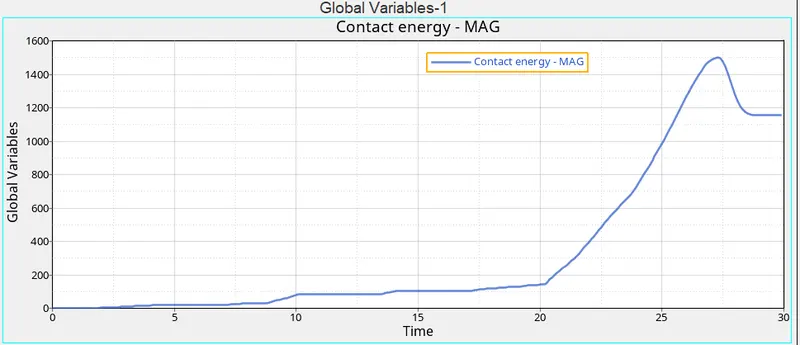
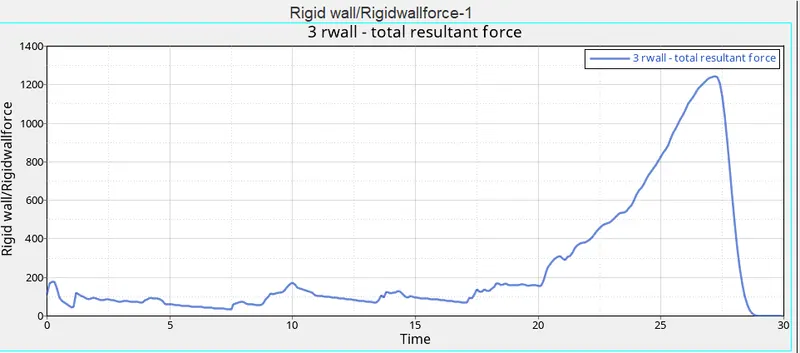
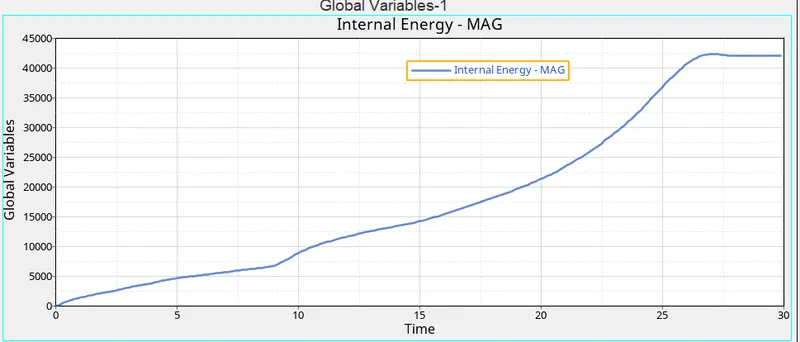
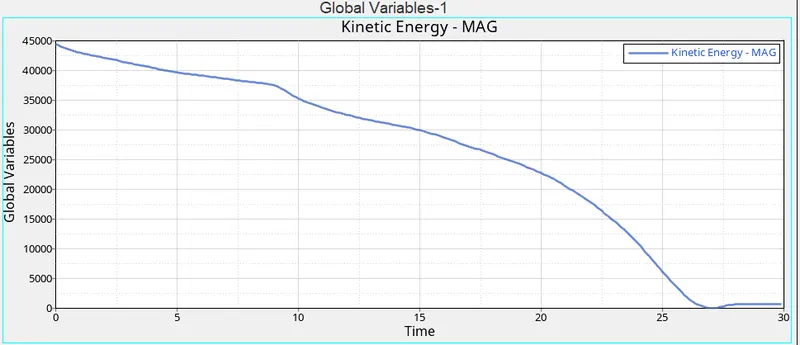
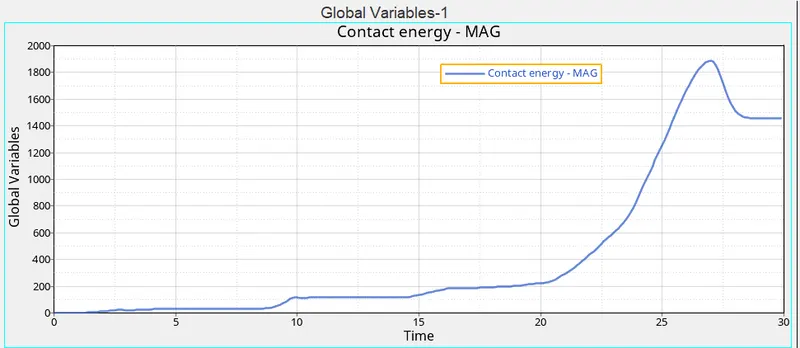
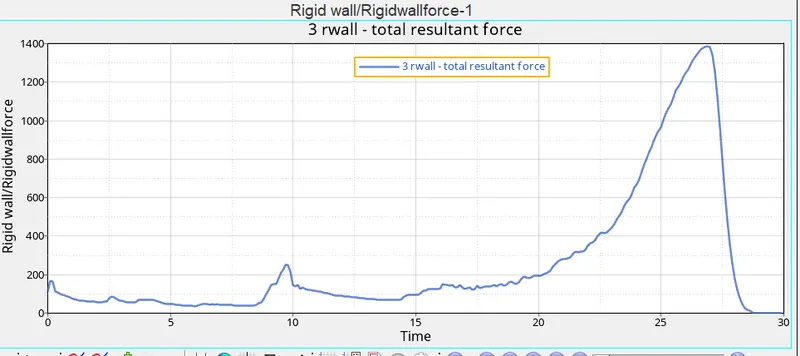
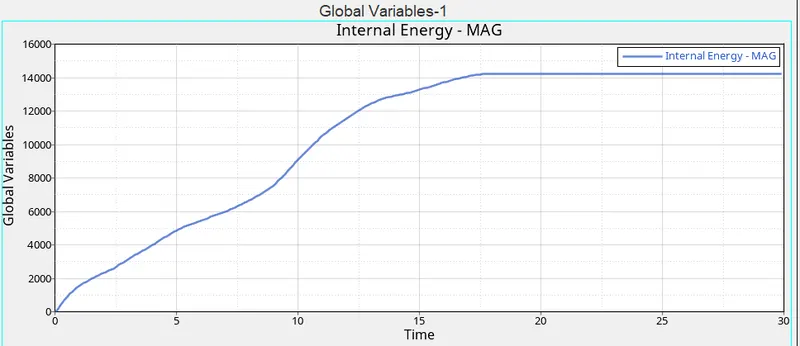
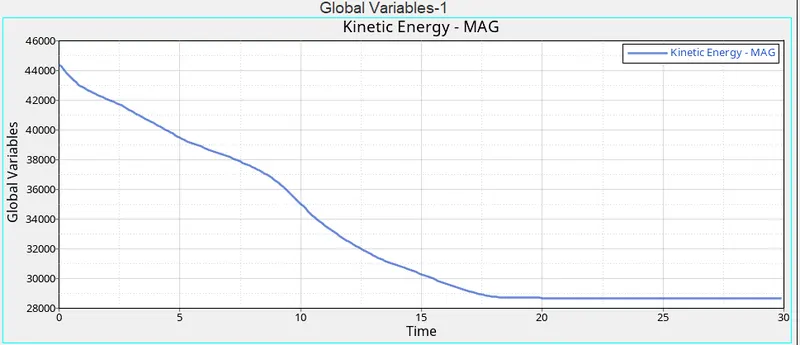
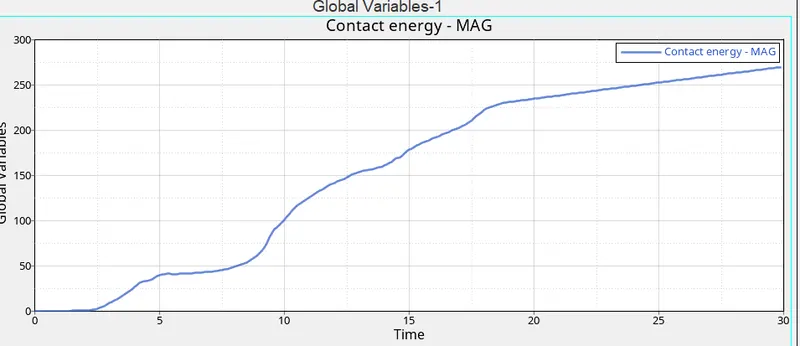
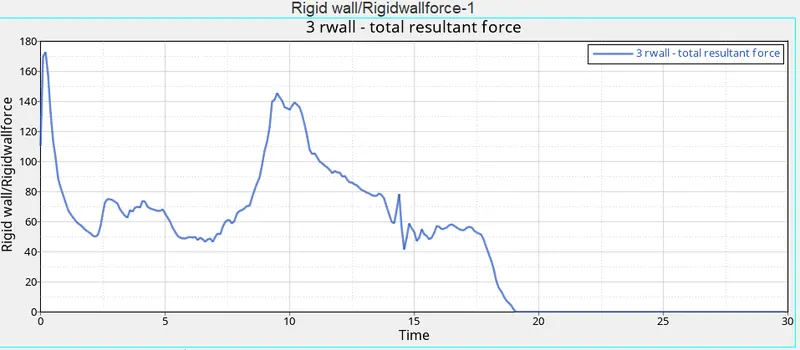
From he graphs plotted for the internal energy ,kinetic energy, contact energy and rigid wall forces it is observed that the behaviour of the curve in the first four cases is almost similar without much difference in valus but when we compare the fifth modle we can observe that there is significant increase in the contact energy and the rigid wall forces for case 05 compared to previous four cases, also the model simulation is much more stable in case 05 compared to other cases.
now coming to the case 06 the contact enenrgy value decreses to very low due to the the geomtric modification in the model which also resulted inth etwiting and flipping of crash tube on getting in contact with the wall , resulting in disruption of result values, due to these a significant and sudden change is also observed in the rigid wall forces value in the case 06.
Now from the tabular data it can be observed that the hourglass energy for all the cases observed is zero the value of the plastic strain is not changing much with the changes in type or the design changes(i.e. deletion and crestion of new notches in different cases), but in case 06 it is observed that the changes in plastic strain much due to the irregular deformation of model at the time of crash.
The cycle time observed is almost similar in all case with major decrease in value in case 04 when we have performed the simulation without any notch and highest in case 05 where we created a full notch at mid section.
The velocity value is observed to increasing from case 01 to case 06 with highest in case 06 due to sudden twisting and flipping of model at the time of crash in the simualtion.
Conclusion
For case 01,the file was run with the basic setup to provide the understanding for the process of crash testing simulation.With this case we learned how to perform basic test run and which contours and graphs are needed to be plotted for the comparison purpose.
For case 02, we have change the Inacti=6 and then the model is run, in this initial penetration is then removed at possible regions or reduce to 30% of the defined gap and adjust the gap with Inacti. This will then leads to decrease in simulation time, Rwall force,simulation time, contact energy, etc because of removal of any initial penetration.
For case 03, type 11 contact interfaceis used with required properties values, due to its edge to edge or line interaction there is an increases in the computational time observed without any significant change in the value of the energy and it is observed that there is a small reduction in the total number of cycles.
For case 04, both the notches are removed then the model is run with required parameters. the rigid bounday condition on the model is also removed as per the the instruction. there is no significant change in energy value is observed , however when comparing to the previous model it is found out that previous model have majorly deformation starting at the notches region.
For case 05, as per the question a new notch is created at the mid portion of the model in the whole section, now the simulation is performed on this model with the required partameters . On performing the simulation it is observed that plastic strain, von misces stress and internal energy remains almost similair or can say with very slight changes but a significant ammount of change can be observed in the velocity value, also the number of cycles observed in this case are highest among all the cases. also it can be observed that due to notch on the whole section(i.e. on both the sides) at the mid region the model shows more stability in the simulation process.
For case 06, the notch is created only on one side in this case, due to this when this model is run with the required parametes then it is found that there is an abrupt behaviour shown by the model during simulation. It is getting abbruptly twisted at the time of crashing and showing a flipping process at the crash point.Due to notch at only one side the deformations are abrupt and also there is an sudden decreses in the energy is observed also the rigid wall forces reduces to zero drastically way before the actual time compared to other simulation cases.
Finally we can conclude that generally it is recommended to remove any kind of initial penetration occuring in the model which can leads to an increase in the values contact energy, internal energy,contact energy etc, also it is observed that notches are are playing an important role in how deformation is occuring in the model .