Assignment 5-RADIOSS Interfaces & Study of Effect of Notches Challenge
Aim-
- Run the crash tube model as it is.
- Change the Inacti=6 and run.
- Create the type 11 contact and run.
- Remove both notches and remove boundary condition on rigid body node then run.
- Create a new notch in the middle ,select the whole section and run.
- Create a new notch with nodes only from opposing 2 faces and run.
Procedure-
- Create the mesh for bumper assembly,mesh size should be 6mm.
Go to Preferences - Criteria File Settings - Target element size. Enter Target element size = 6. Now press F12 to go to automesh panel. Enter element size =6 and mesh type to 6.
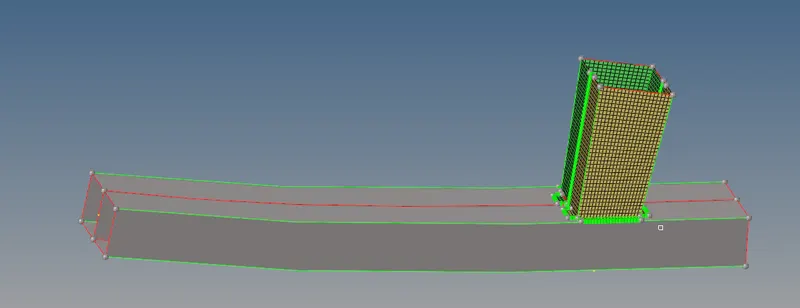
- Meshing each component seperately and having spot weld wherever necessary
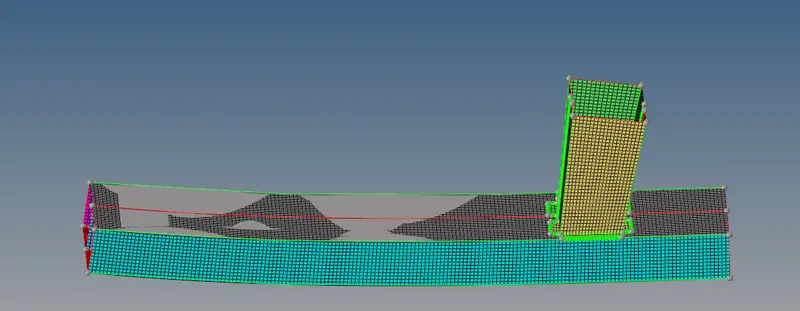
Case1 - Run the crash tube model as it is (Type 7 Contact).
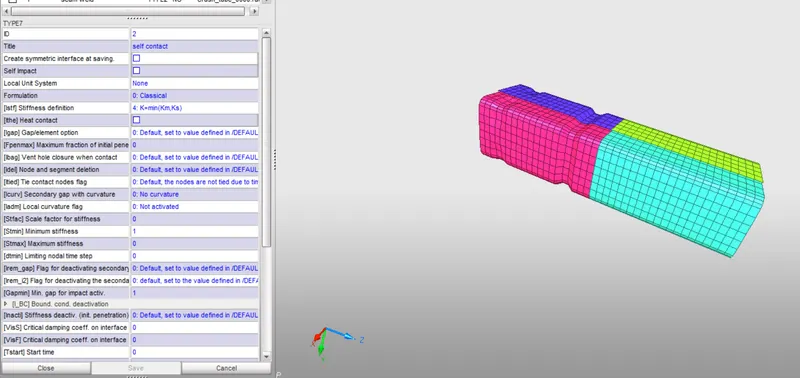
1) In this case we run the crash tube model as it is without changing the parameters in Hypercrash as shown in the image given below.
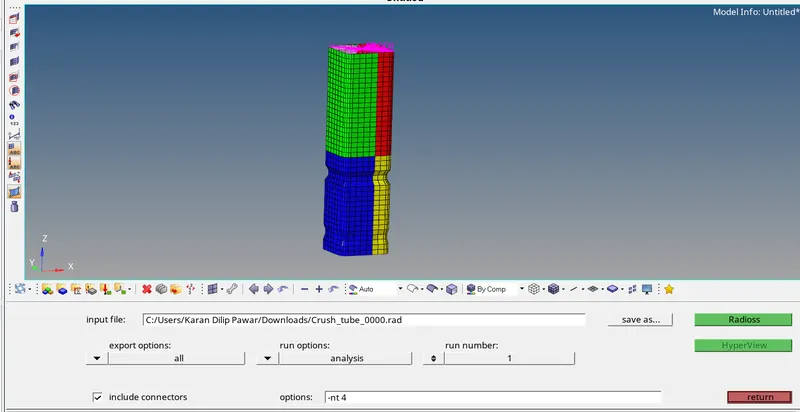
2. Importing the .rad file in Hyperworks as Radioss and then running the simulation using the radioss option under analysis module as shown in the image given below.
3. After Running the module we look for Energy error and mass error in folder we saved i.e 0001.OUT file.
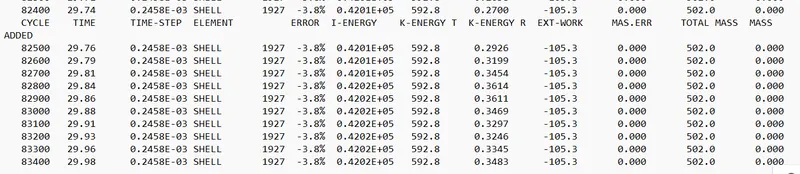
Energy Error- -3.8% Mass Error- 0%
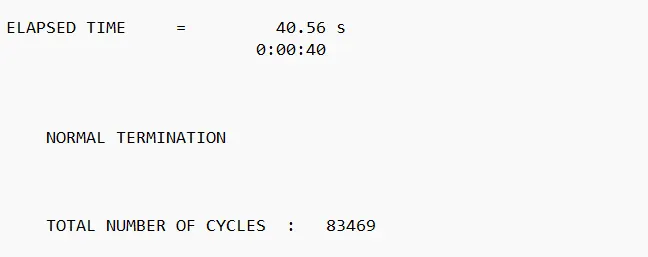
Elapsed Time- 40.56 Total No. of cycles-83469
4. We now go to hyperview and import the .h3d file we check for contour plot for Vonmisses and Contact forces in the animation which is shown below.
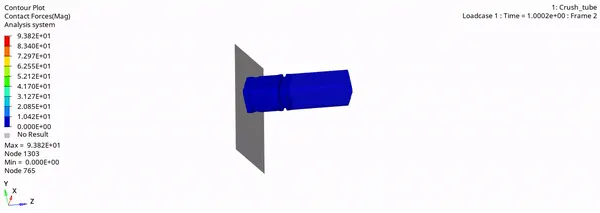
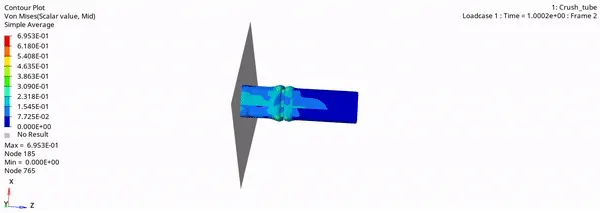
Max Von Mises Stress : 0.6953 GPa
Max Contact Forces: 93.82 N
5. Now proceding further to plot the graph for RWALL forces ,contact forces,internal energy by hypergraph 2D and we will import file T01 which we saved in the folder.
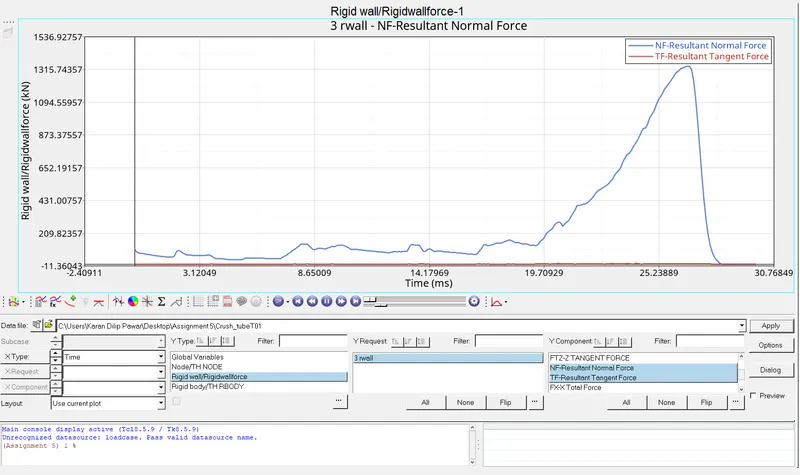
- The rigid wall forces is increasing gradually and the maximum value is recorded at Time- 26 ms and Force- 1317KN and then lowers down from the peak.
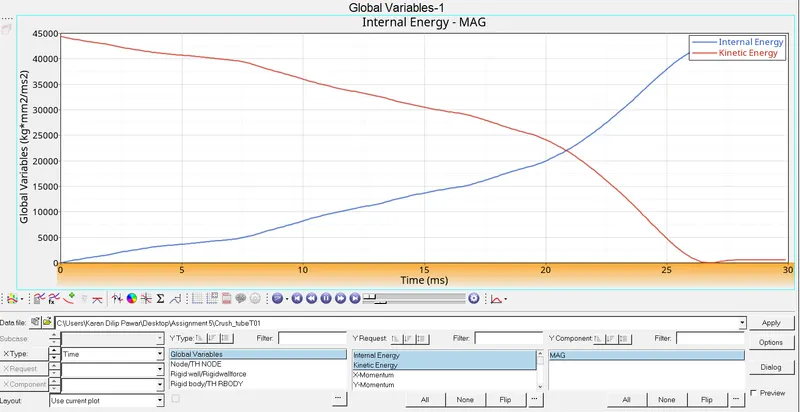
- The internal energy found to be increasing gradually from the beginning itself from 0ms because it is attached to a rigid wall and records maximum at Time-26ms and 43000J whereas the Kinetic energy decreases gradually with time and at 26.8 ms becomes almost zero.
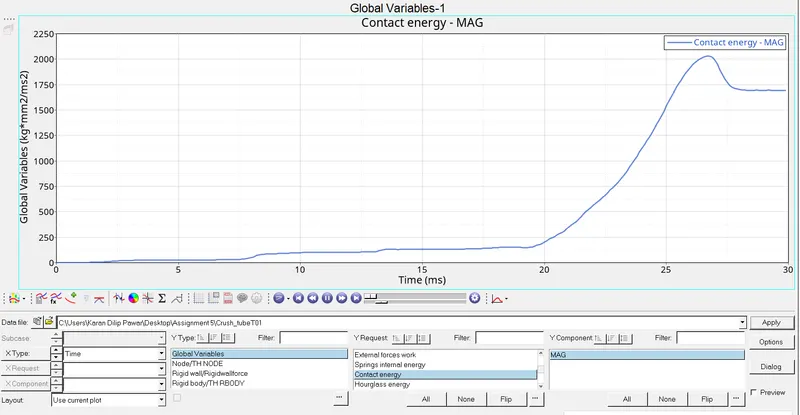
The contact energy also increases gradually with time the maximum value is recorded at 26.7 ms i.e. 2000 J and then, decreases w.r.t time then goes to constant rate till the end of the simulation i.e. 1750 J.
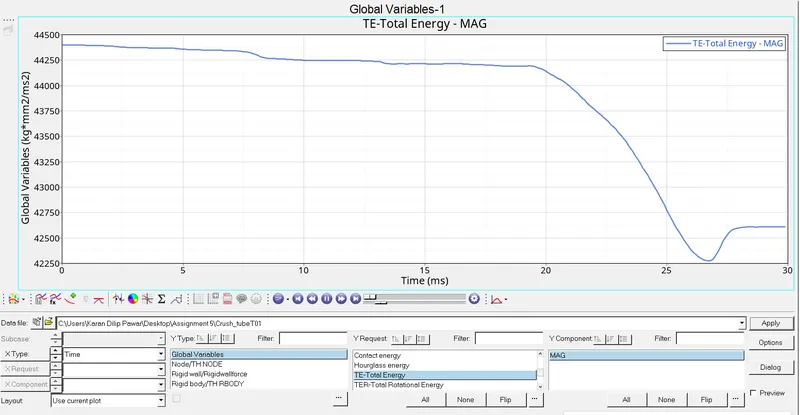
- The Total Energy decreases gradually with increase in time, it goes to as low from 42250 J and then drops down slowly between time 10 to 19ms then goes to constant state at the end of 30 ms i.e. 42625 J.
2) Case 2: Change the Inacti=6 and run (Type 7 Contact).
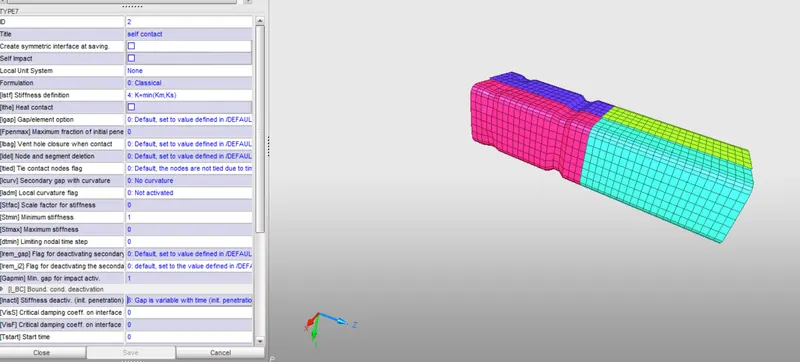
1) In this case we run the crash tube model by changing the value of Inacti =6 (Gap is Variable with time) in Hypercrash as shown in the image given below.
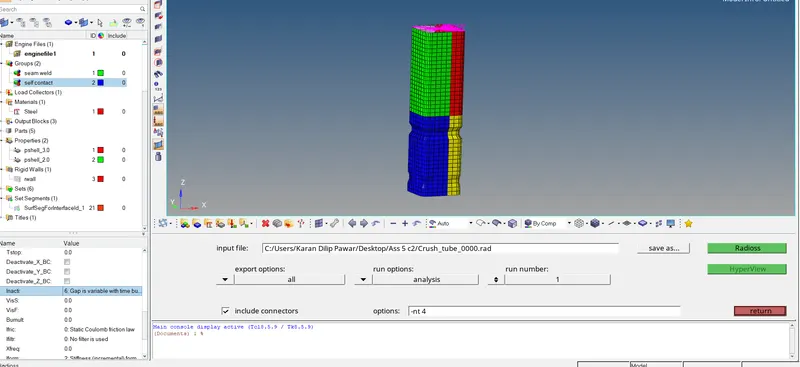
2. We then import the .rad file in hyperworks in Radioss under Analysis module and save it in different folder as shown in image below.
3. We look out for the energy error and mass error in 0001.out in the form of the text editor as shown in the image given below.
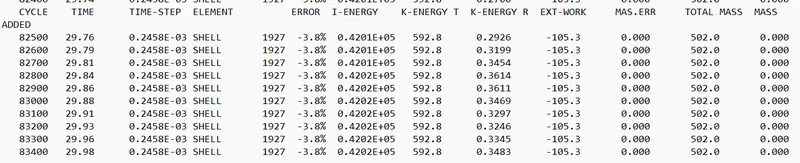
Energy Error- -3.8% Mass Error- 0%
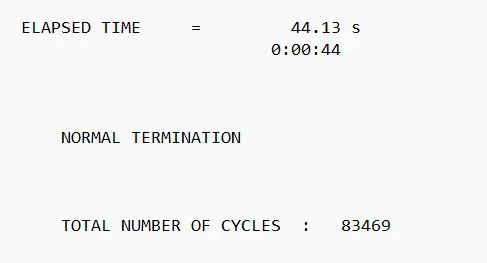
Elapsed Time- 44.13 s Total No of Cycles- 83469
4. We now go to hyperview and import the .h3d file we check for contour plot for Vonmisses and Contact forces in the animation which is shown below.
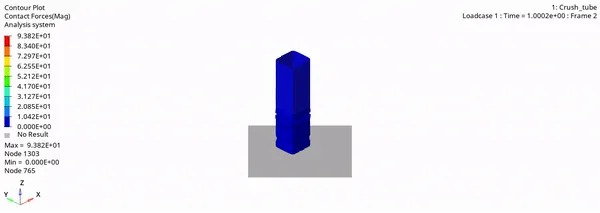
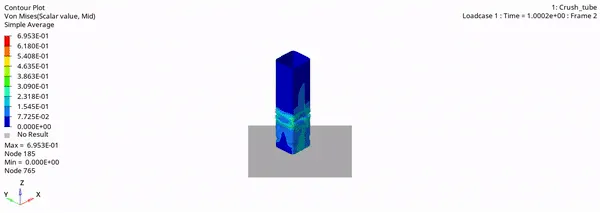
Max Von Mises Stress : 0.6953 GPa
Max Contact Forces: 93.82N
5. Now proceding further to plot the graph for RWALL forces ,contact forces,internal energy by hypergraph 2D and we will import file T01 which we saved in the folder.
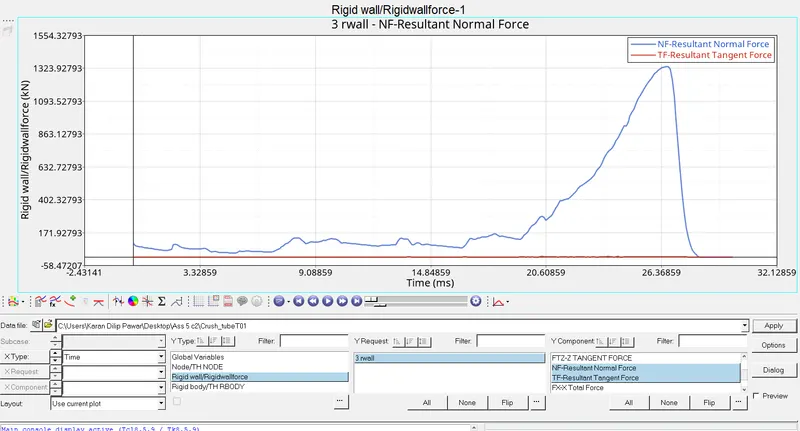
- The Rigid wall forces is increasing gradually and the resultant is observed to be maximum at 26.58ms i.e 1325KN.
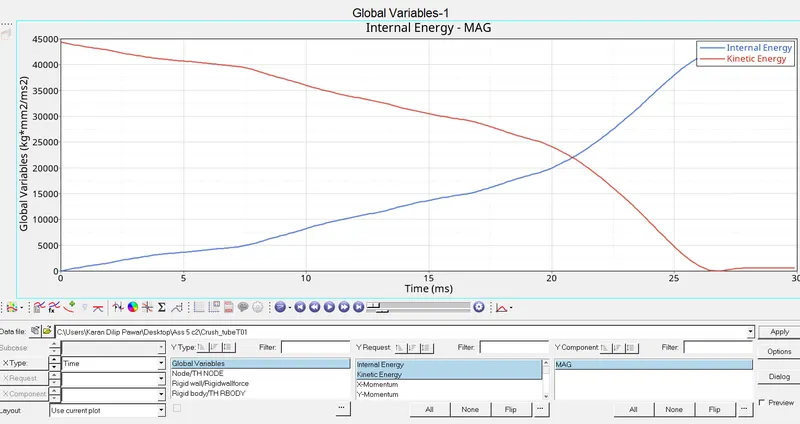
The Internal Energy increases gradually with time as the forces are being applied at one end its value is maximum at 26.7 ms i.e. 43,000 J and Kinetic Energy decreases gradually with increase in time i.e. it comes to 0 J at 26.7 ms.
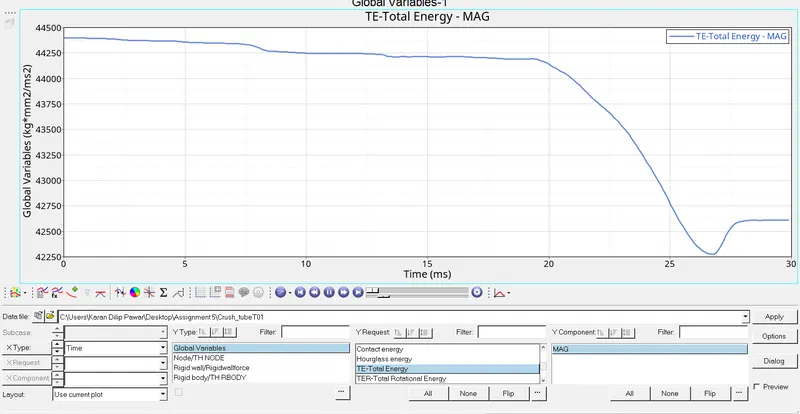
- The total energy is observed to be at the peak at the beginning which is 44350KN and then gradually decrease with time suddenly drops at 27 ms for 42270KN and then remains constant hereafter from 30ms for 42650KN.
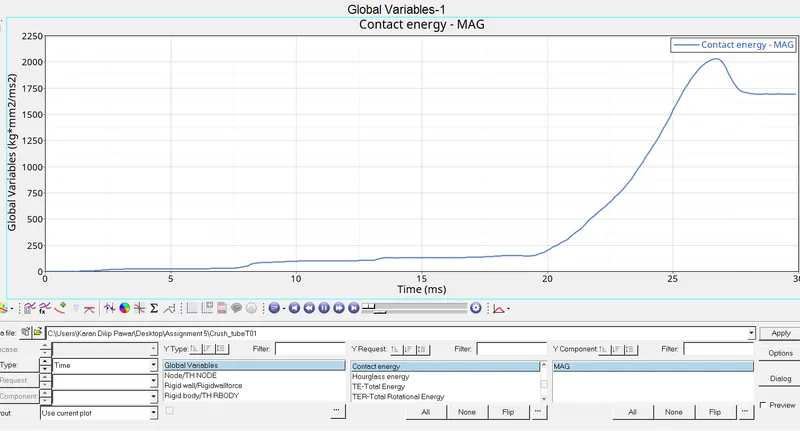
The contact energy also increases gradually with time the maximum value is recorded at 26.7 ms i.e. 2000 J and then, decreases w.r.t time then goes to constant state till the end of the simulation i.e. 1750 J.
3) Case 3: Create the type 11 contact and run (Changing from Type 7 to Type 11).
1. In this case we change the card type from 7 to 11 with recommended properties as share in video.
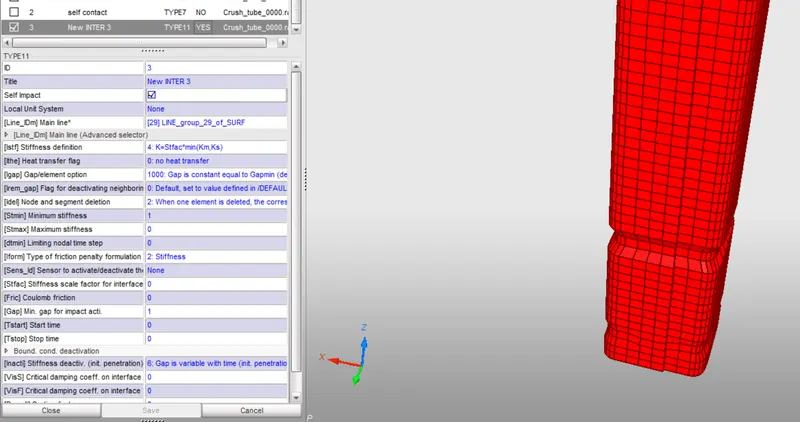
2. We then import the .rad file in hyperworks in Radioss under Analysis module and save it in different folder .
3. We look out for the energy error and mass error in 0001.out in the form of the text editor as shown in the image given below.

Here we can observe the change in energy error from first two cases
Energy Error - -2.7% Mass Error- 0%
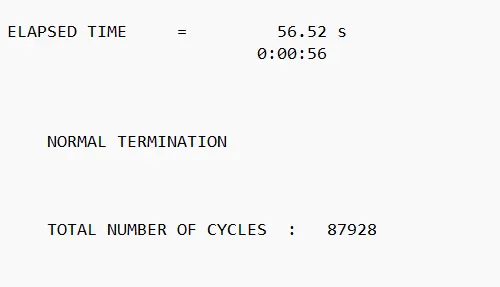
Elapsed Time- 56.52s Total No. of Cycles- 87928.
4. We now go to hyperview and import the .h3d file we check for contour plot for Vonmisses and Contact forces in the animation which is shown below.
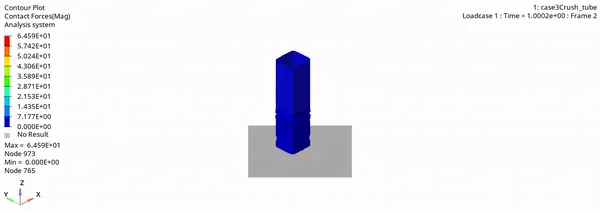
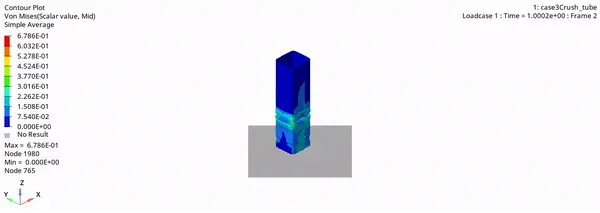
Max Von Mises Stress : 0.678 GPa
Max Contact Forces: 64.59N
5. Now proceding further to plot the graph for RWALL forces ,contact forces,internal energy by hypergraph 2D and we will import file T01 which we saved in the folder.
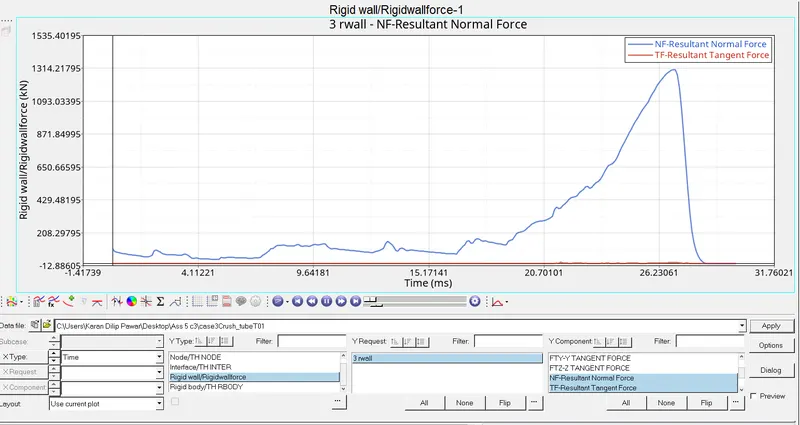
- As compare to other two cases here we can observe the rigid wall forces increases at 27ms i.e 1314KN and sudden drop down to zero as the simulation completes.
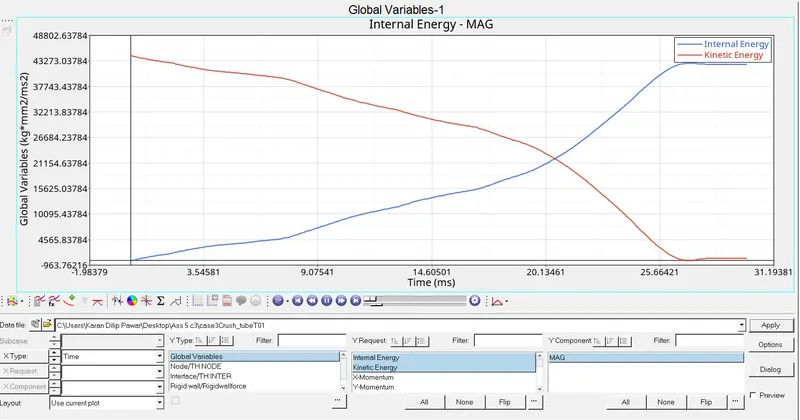
- The Internal Energy increases gradually with time as the forces are being applied at one end its value is maximum at 26.7 ms i.e. 43,270 J and Kinetic Energy decreases gradually from 43350 KJ with increase in time i.e. it comes to 0 J at 26.7 ms.
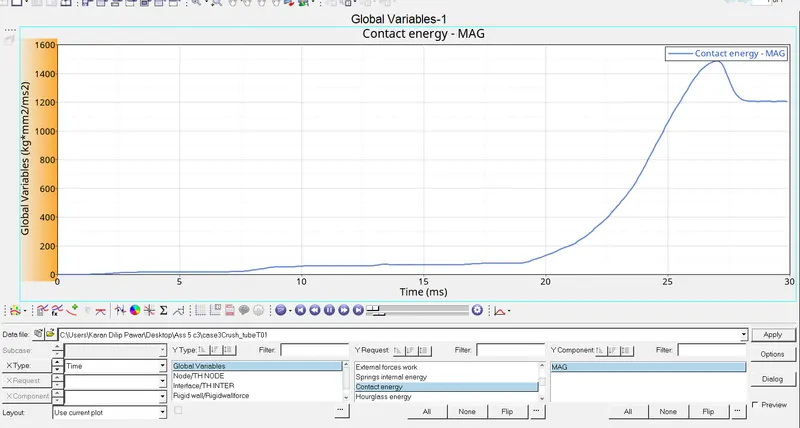
- As compare to other two cases here the contact energy peak value is 1500J at 27ms which is less than other two the contact energy increase gradually and then decreases from 27 ms and hereafter maintains a constant rate to 1200J till the end of the simulation.
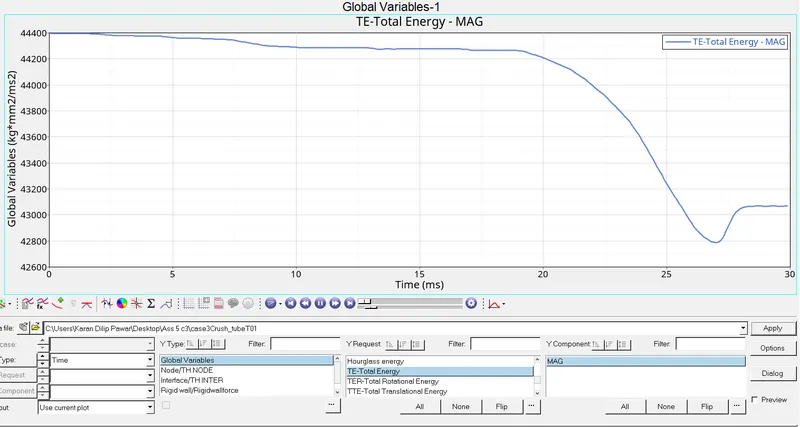
- Here too as compare to first two cases total energy is observed to be at peak at the beginning which is 44400 which is having higher value than other two cases and then gradually decreases with time the sudden drop at 27ms for 42800J and hereafter remains constant from 28 ms i.e 43100J.
4) Case 4: Remove both notches and remove boundary condition on rigid body node then run.
1. In this case first remove the boundary condition as mentioned. and also removing the both the notch from the model by pressing F7- Align Node. to delete the Boundary conditions, go to the Solver Deck Click on Solver > The Solver Deck will be opened. > Delete the BCS Entity in the Solver Deck.
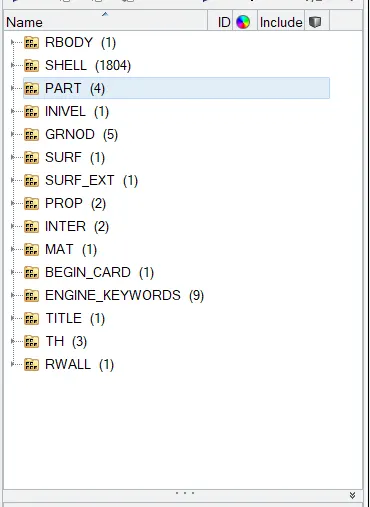
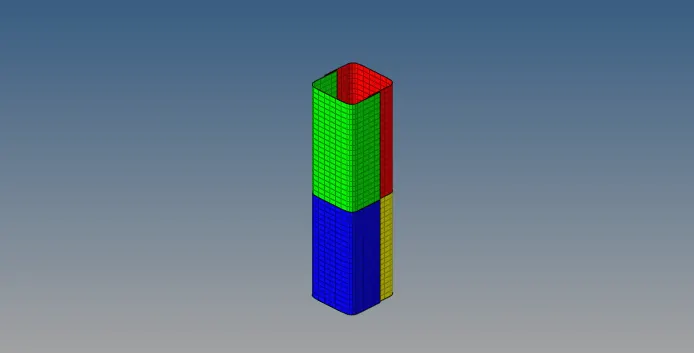
2. We then import the .rad file in hyperworks in Radioss under Analysis module and save it in different folder .
3. We look out for the energy error and mass error in 0001.out in the form of the text editor as shown in the image given below.

Here the Energy Error- -3.0% and Mass Error- 0%
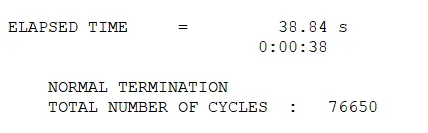
Elapsed Time- 38.84s Total No of Cycle- 76650.
4. We now go to hyperview and import the .h3d file we check for contour plot for Vonmisses and Contact forces in the animation which is shown below.
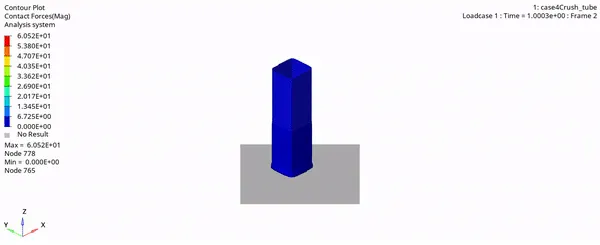
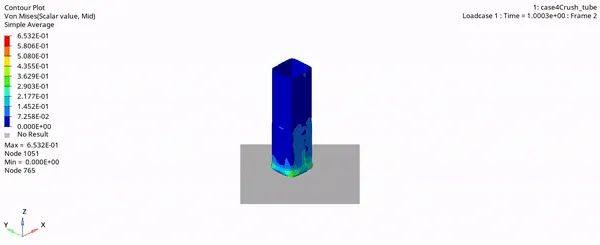
Max Von Mises Stress : 0.6532 GPa
Max Contact Forces: 60.52N
5. Now proceding further to plot the graph for RWALL forces ,contact forces,internal energy by hypergraph 2D and we will import file T01 which we saved in the folder.
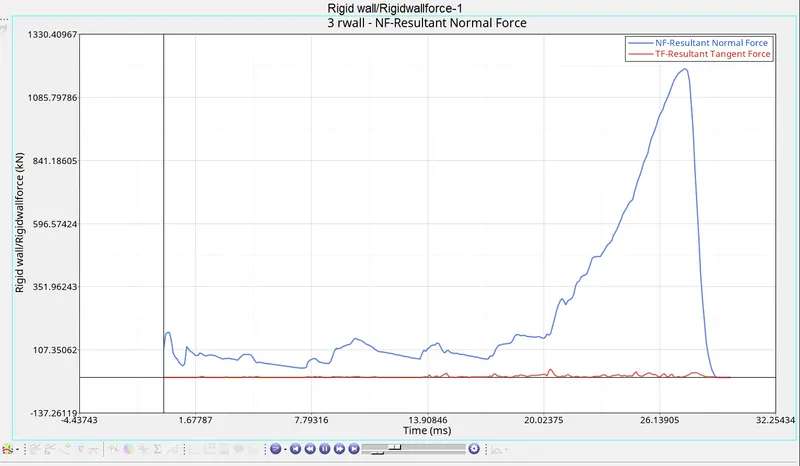
- Here
As compare to other 1st three cases here we can observe the rigid wall forces increases at 27ms i.e 1200KN and sudden drop down to zero as the simulation completes. here compare to other cases rigid wall force is less by almost 150KN.
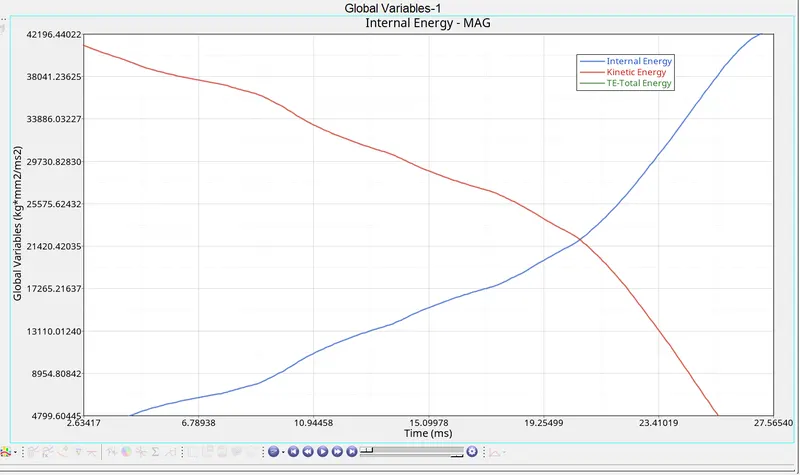
- The Internal Energy increases gradually with time as the forces are being applied at one end its value is maximum at 26.7 ms i.e. 42,196 J and Kinetic Energy decreases gradually from 43350 KJ with increase in time i.e. it comes to 0 J at 26.7 ms.
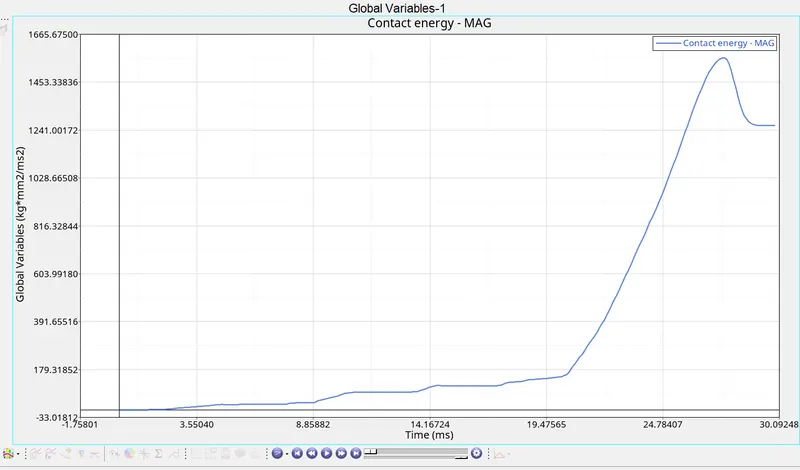
As compare to other 1st two cases here the contact energy peak value is 1500J at 27ms which is less than other two. the contact energy increase gradually and then decreases from 27 ms and hereafter maintains a constant rate to 1241J till the end of the simulation.
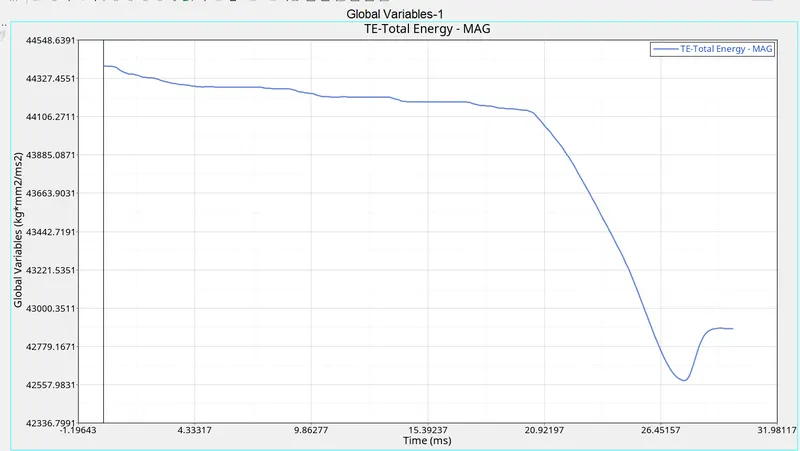
- Here too as compare to first two cases total energy is observed to be at peak at the beginning which is 44400 which is having higher value than other 1st two cases and then gradually decreases from 20 ms and the lowest at 27ms for 42600J and hereafter remains constant from 28 ms i.e 42500J.
5) Case 5: Create a new notch in the middle ,select the whole section and run.
1. In this case we create a notch in middle by translate option by pressing Shift+f4
2. We then import the .rad file in hyperworks in Radioss under Analysis module and save it in different folder .
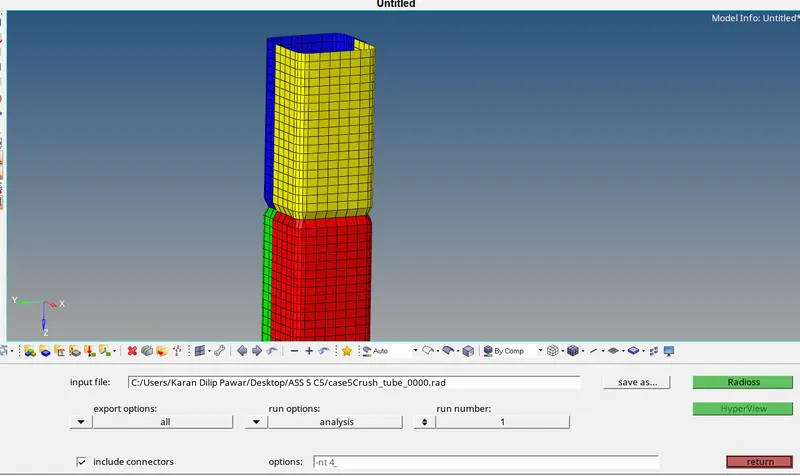
3. We look out for the energy error and mass error in '0001.out' in the form of the text editor as shown in the image given below.

Here the Energy Error- -3.3% and Mass Error- 0%
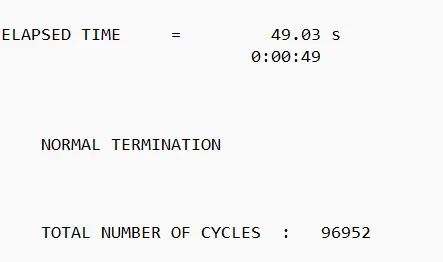
Elapsed Time- 49.03s Total No of Cycle- 96952.
4. We now go to hyperview and import the .h3d file we check for contour plot for Vonmisses and Contact forces in the animation which is shown below.
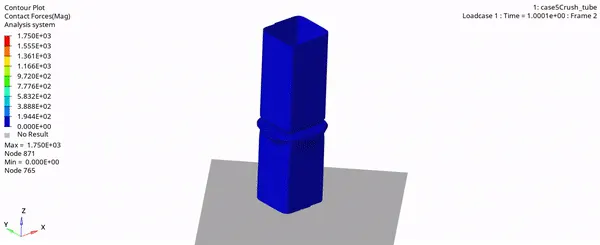
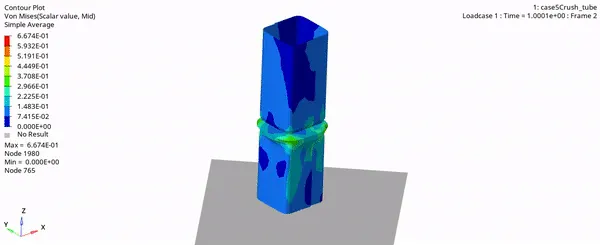
Max Von Mises Stress : 0.667 GPa
Max Contact Forces: 1750N
5. Now proceding further to plot the graph for RWALL forces ,contact forces,internal energy by hypergraph 2D and we will import file T01 which we saved in the folder.
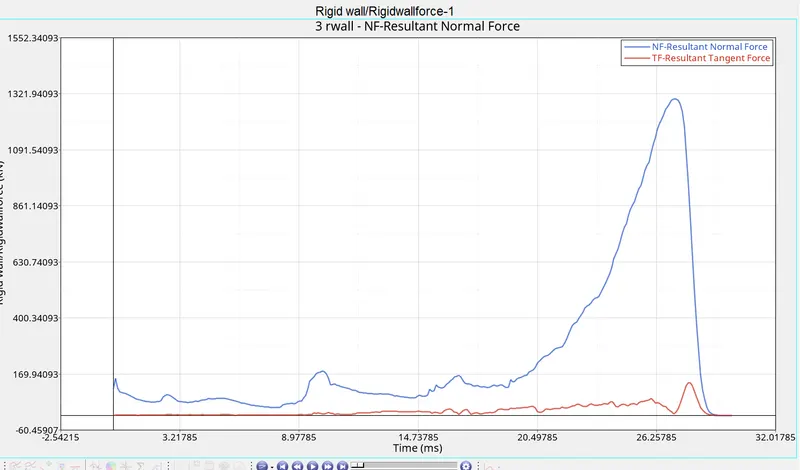
- The Rigid wall forces is increasing gradually and the resultant normal force is observed to be maximum at 27ms i.e 1300KN.which is higher than the earlier case by 100KN and drops from the peak instantly to zero a steep curve can be observed.
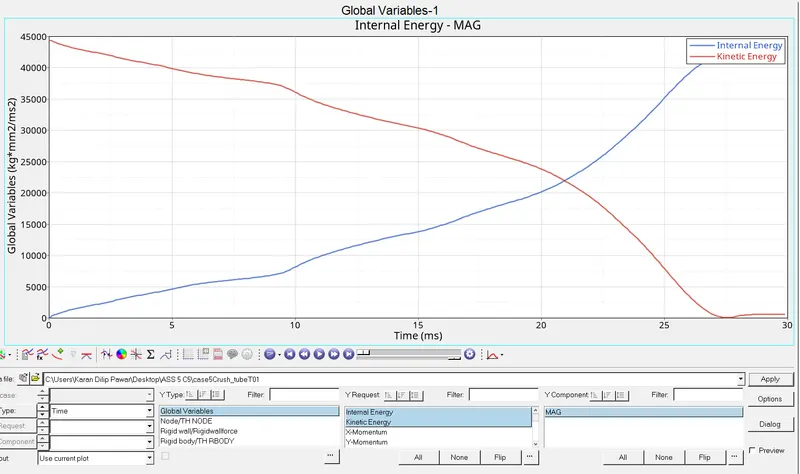
- The Internal Energy increases gradually with time as the forces are being applied at one end its value is maximum at 26.7 ms i.e. 44000 J and Kinetic Energy decreases gradually from 45000 KJ with increase in time i.e. it comes to 0 J at 26.7 ms.
 '
'
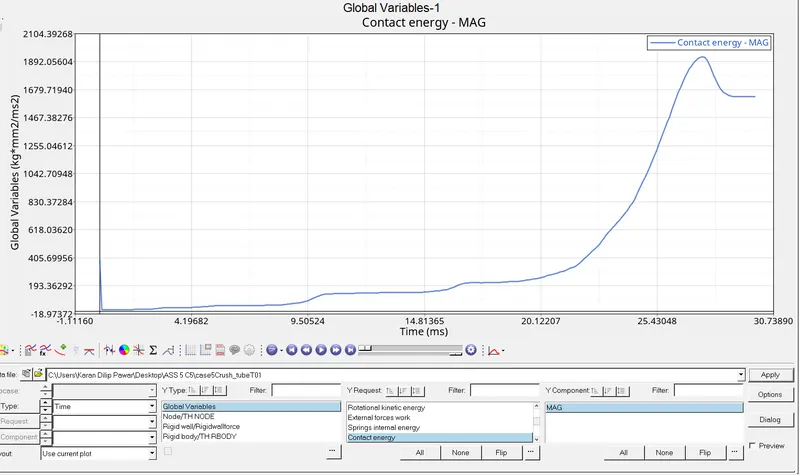
- The contact energy also increases gradually with time the maximum value is recorded at 27 ms i.e. 1900 J and then, decreases w.r.t time then goes to constant state till the end of the simulation i.e. 1650 J. as compare to other cases here we can observe that the peak value (highest value) have been reduced by 200-300 J.
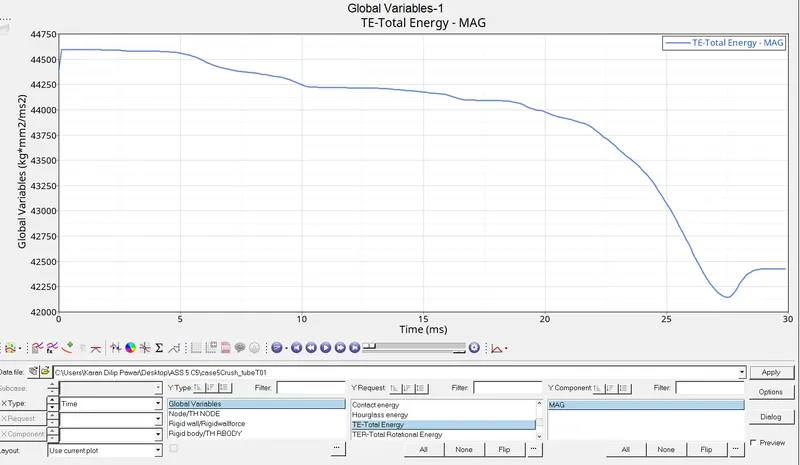
- The Total Energy decreases gradually with increase in time, it goes to as low from 44500 J and then drops down slowly between time 10 to 22 ms then goes to constant state at the end of 30 ms i.e. 42470 J. as observed from the other cases the value of total energy have been increased due to addition of notch in between.
6) Case 6: Create a new notch with nodes only from opposing 2 faces and run.
1. In this case we will create a notch on two opposite sides while the other two will not be having a notch. the notch will be created by translate command by pressing shift+f4.
2. We then, import the .rad file in Hyperworks and then, run the simulation using the radioss option under analysis module as shown in the image given below.
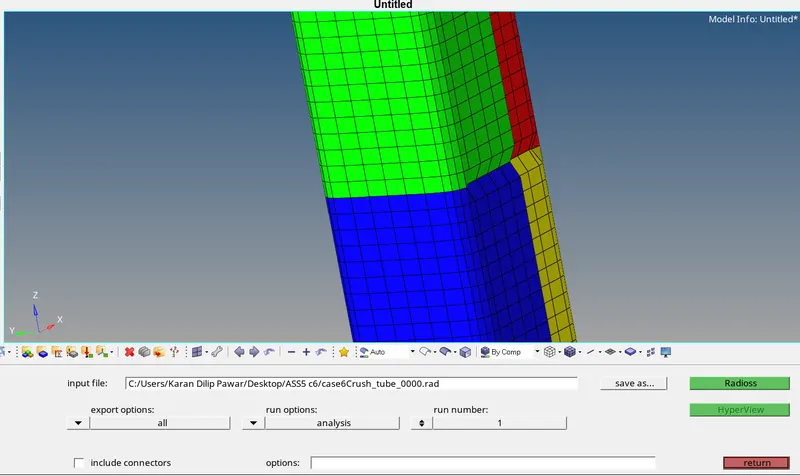
3. We look out for the energy error and mass error in '0001.out' in the form of the text editor as shown in the image given below.
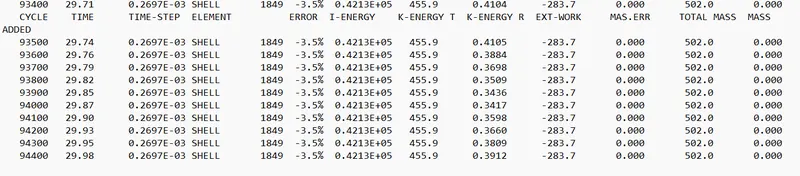
Here the Energy Error- -3.5% and Mass Error- 0%
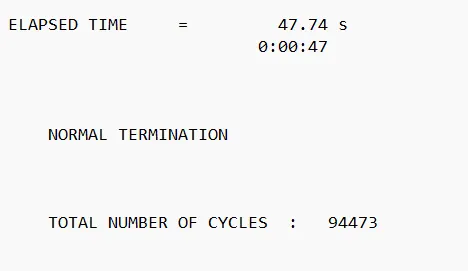
Elapsed Time- 47.74s Total No of Cycle- 94473.
4. We now go to hyperview and import the .h3d file we check for contour plot for Vonmisses and Contact forces in the animation which is shown below.
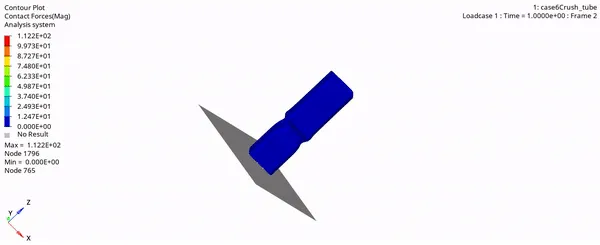
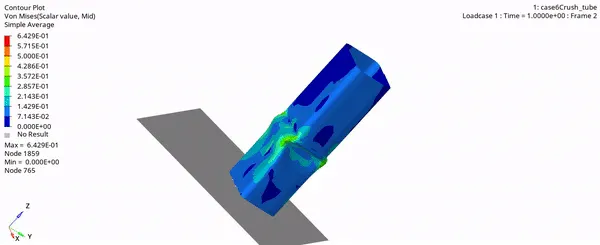
Max Von Mises Stress : 0.6429 GPa
Max Contact Forces: 11.22N
5. Now proceding further to plot the graph for RWALL forces ,contact forces,internal energy by hypergraph 2D and we will import file T01 which we saved in the folder.
 \
\
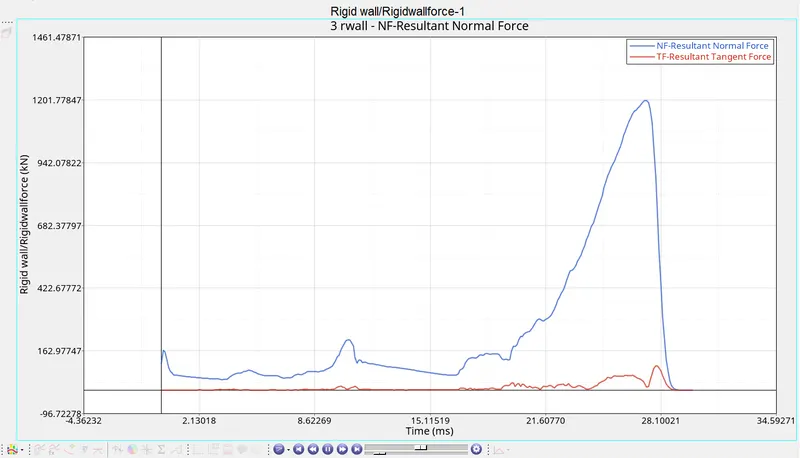
- The Rigid wall forces is increasing gradually and the resultant normal force is observed to be maximum at 27ms i.e 1201KN.which is lesser than the earlier case 5 by 100KN and drops from the peak instantly to zero a steep curve can be observed.
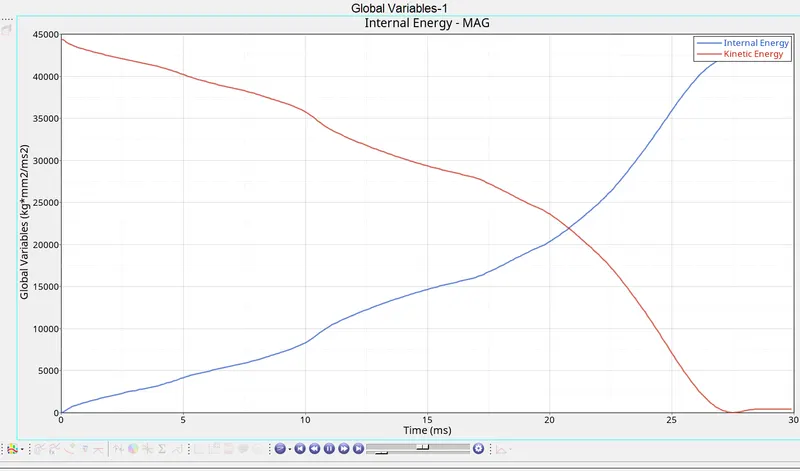
- The Internal Energy increases gradually with time as the forces are being applied at one end its value is maximum at 26.7 ms i.e. 44000 J and Kinetic Energy decreases gradually from 45000 KJ with increase in time i.e. it comes to 0 J at 26.7 ms.
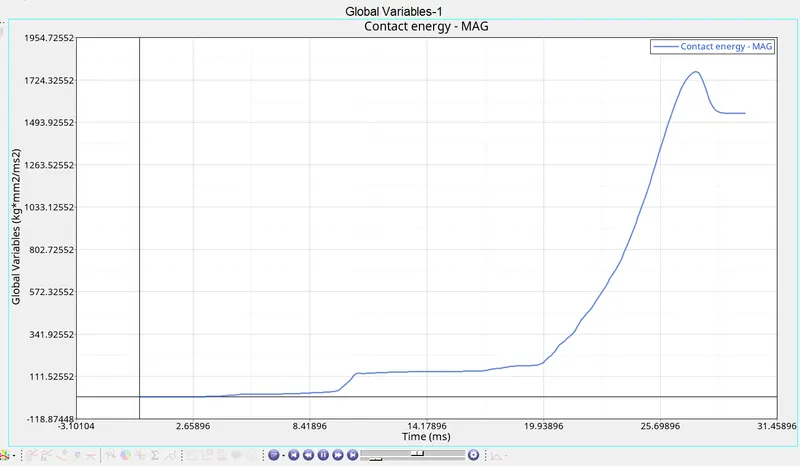
- The contact energy also increases gradually with time the maximum value is recorded at 27 ms i.e. 1760 J which is lower than the earlier case and then, decreases w.r.t time then goes to constant state till the end of the simulation i.e. 1550 J. as compare to case 5 here we can observe that the peak value (highest value) have been reduced by 100-150 J.
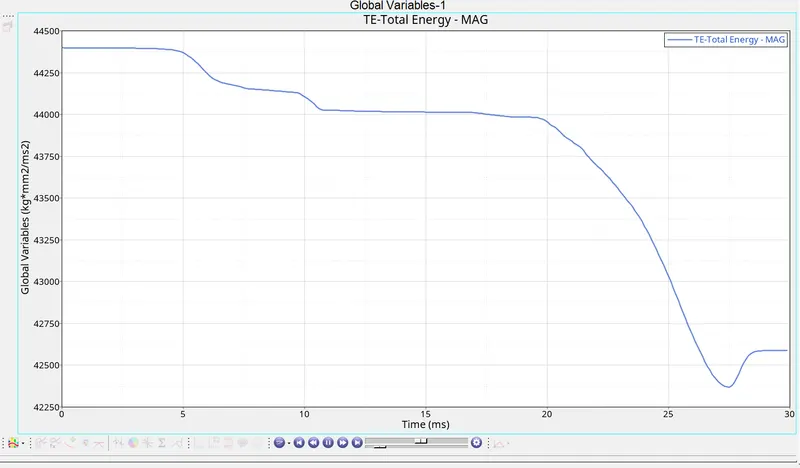
- The Total Energy decreases gradually with increase in time, it goes to as low from 44400 J and then drops down slowly between time 10 to 20 ms and after 20ms there is a sudden drop to 42350J at 27ms and have a rise and then remain constant upto 30ms i.e 42550J.
- Results and Views on Cases.
| Sr No | Case No | Case Definition | Contact Type | No. Of cycles | Elapsed Time | Energy Error% | Mass Error% | Von Misses (GPA) | Contact Forces (N) |
| 1 | Case 1 | Running simulation as it is on default parameter | Type 7 | 83469 | 40.65 | -3.8 | 0 | 0.6953 | 93.82 |
| 2 | Case 2 | Running simulation by changing inacti value-6 | Type 7 | 83469 | 44.13 | -3.8 | 0 | 0.6953 | 93.82 |
| 3 | Case 3 | Running simulation by changing contact type Type 11 (Edge to Edge) | Type 11 | 87928 | 56.52 | -2.7 | 0 | 0.678 | 64.59 |
- As we can observe from the table i.e there is no difference from case 1 and case 2 only a small Elapsed Time difference and also adding inacti value there was no such change observed or effect obeserved in the energy or contact forces. In Case 3 there was considerable change in contact force as compare to Case 1 and Case2 and also change in Energy error and No. of Cycle this was due to change of type from 7 to type 11.
| Sr No | Case No | Case Definition | No. Of cycles | Elapsed Time | Energy Error% | Mass Error% | Von Misses (GPA) | Contact Forces (N) |
| 1 | Case 4 | Removal of Notches and BC | 76650 | 38.84 | -3 | 0 | 0.6532 | 60.52 |
| 2 | Case 5 | Adding a Notch in between and running the model | 96952 | 49.03 | -3.3 | 0 | 0.667 | 1750 |
| 3 | Case 6 | Adding Notch only on opposite side only. | 94473 | 47.74 | -3.5 | 0 | 0.6429 | 11.22 |
- As we can clearly observe that there is reduction in contact forces due to addition of notches as the notch is the first point of contact in deformation and having high stress concentration we can control the graph of energy, contact energy by proper positioning of notches.
- Other than this we did not found any difference in curve path in internal energy but minor changes in values of internal energy which we define during the case itself.
- It is mainly observed from different cases that deformation occurs first from the notches and Von Misses Value lies between 0.6 to 0.7 GPA.
Conclusion-
We have simulated different cases and compare the results for understanding the effect of addition of various parameters and Notches for different Cases.