Assignment 5-RADIOSS Interfaces & Study of Effect of Notches Challenge
Aim: To create mesh for the bumper model and simulation of the crash box with notches and without is carried out and compared with other cases.
Objective: Create the mesh for the bumper model with 6mm element size. The crash box is simulated as given, changes are made inacti=6, created new type 11 contact, notches and boundary condition, new notch is created at middle, new notches only from opposing faces are created these each case are run separately and the results of each case are compared.
Procedure:
The model of the bumper is downloaded and opened in the hypermesh software.
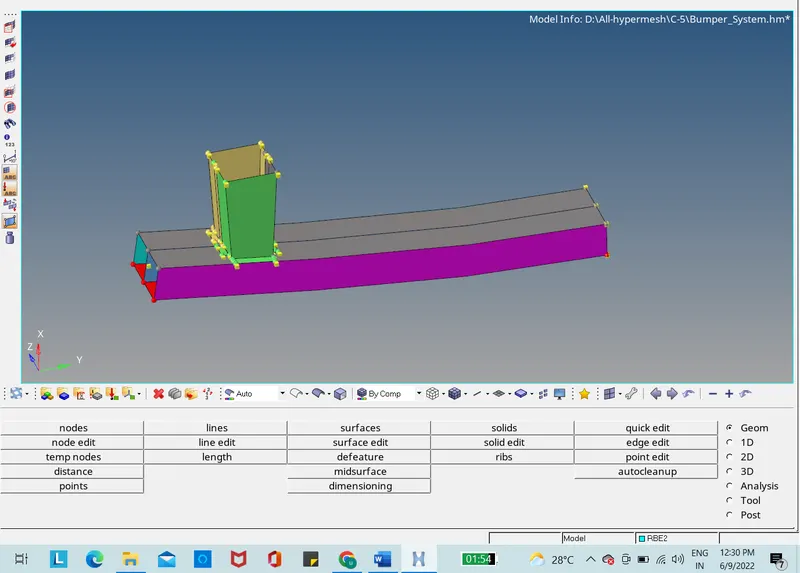
Figure 1: Bumper Model
The model is cleaned up and mesh of 6 mm is created.
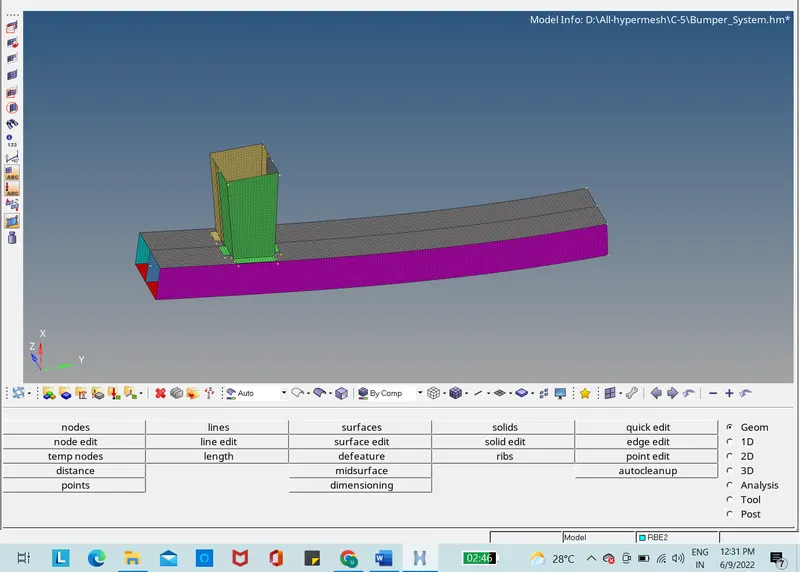
Figure 2: Meshed Model
The model is now connected using the RBE2 elements.
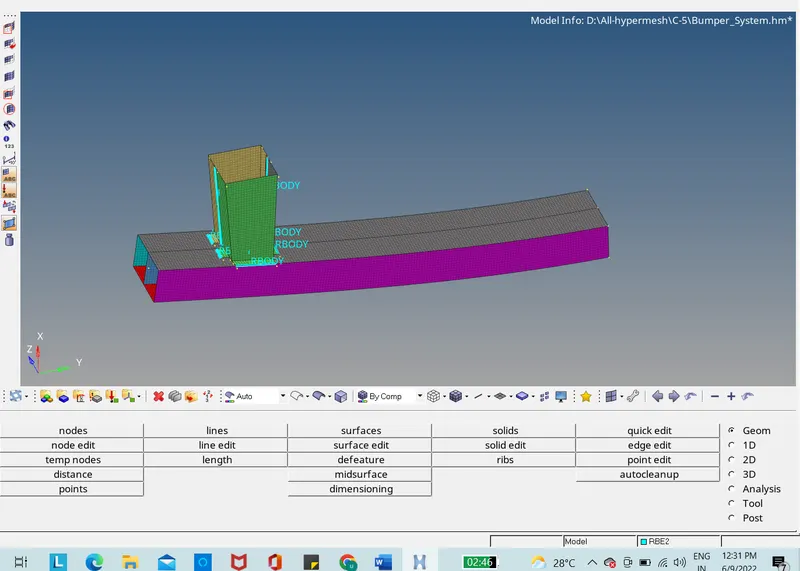
Figure 3: Meshed with RBE2 elements
The crash box with the main file and engine file is downloaded. The main file with .rad extension is imported to hypermesh software.
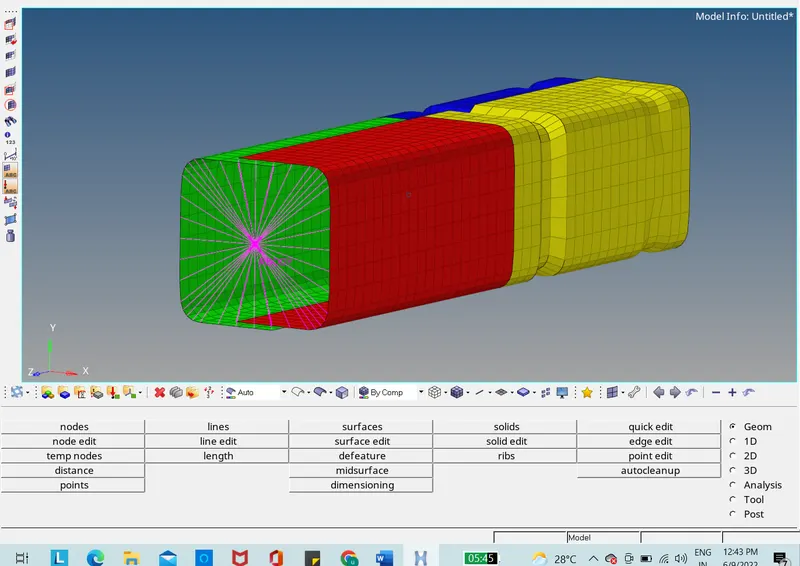
Figure 4: Crash box
In order to create the TH/PART, need to open solver module, create TH/PART and select all the components.
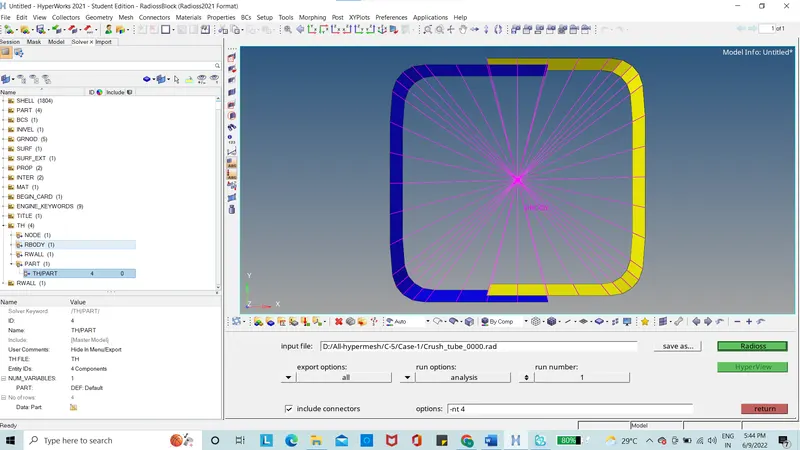
Figure 5: TH/PART
Crash box is now run using the radioss solver in the analysis option.
The output file is opened to find the mass error and energy error.
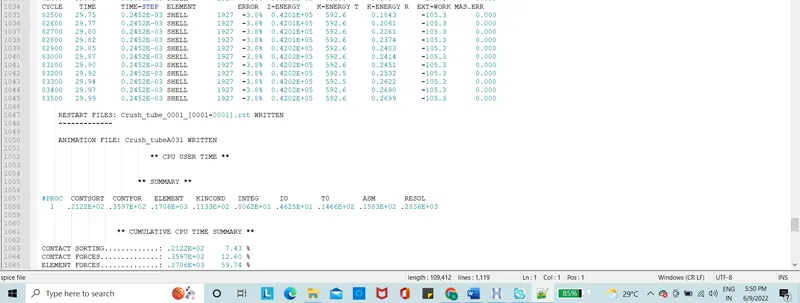
Figure 6: Output File
The energy plots, rigid wall forces, contact forces and internal energy plots are plotted for the case-1.
The results of the energy error and mass error are below 10% which is acceptable. The graphs are plotted using the hypergraph.
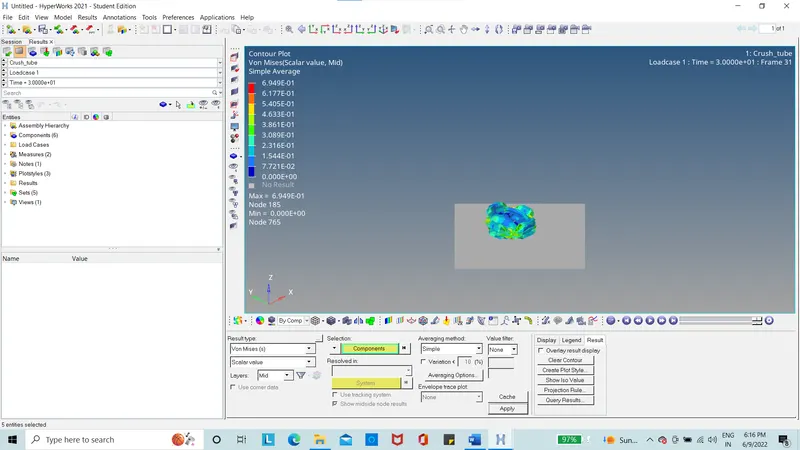
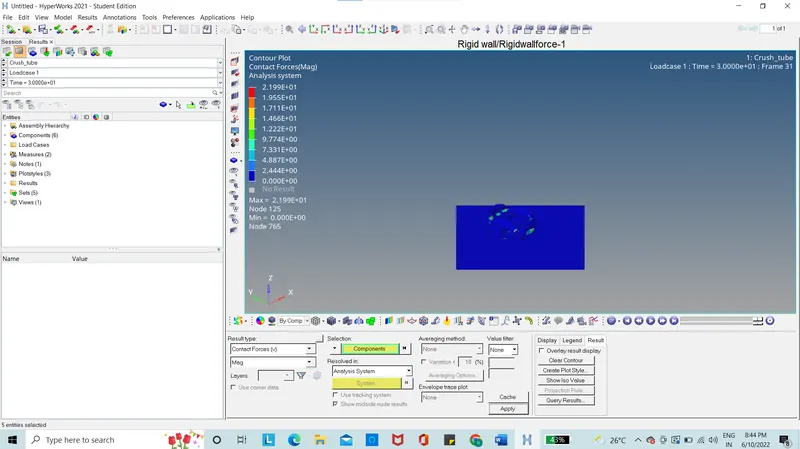
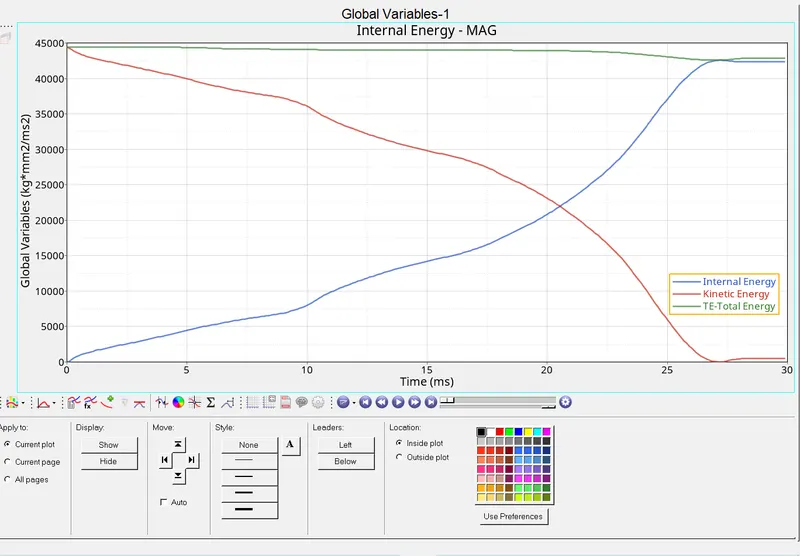
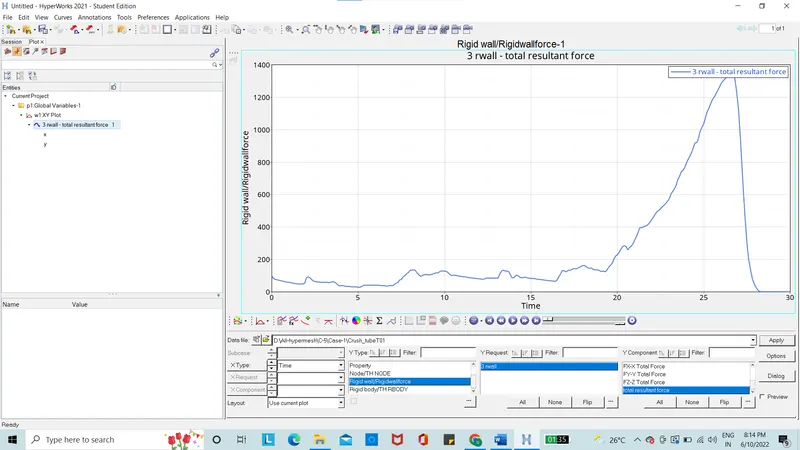
For this simulation, the max stress in von mises stress is 0.69 Mpa with max contact force is taken as 219N. The Time history for all the components is created in order to study the deformation and energy variation in each component with respect to time.
The internal energy is rising which is shown in the graph with the rise in the beginning and with notch area as there will be less area at the position there will be smooth curve produced at that point.
Kinetic energy is getting decrease as there will be contact with the rigid wall from the component and will decrease consistently as shown in the graph.
The contact energy will be less at the beginning and there will be a peak on the energy in the graph as there will be accumulation of energy at one point.
The changes are made to the crash box for case 2 by making change in Inacti=6 and model is run using the radioss solver.
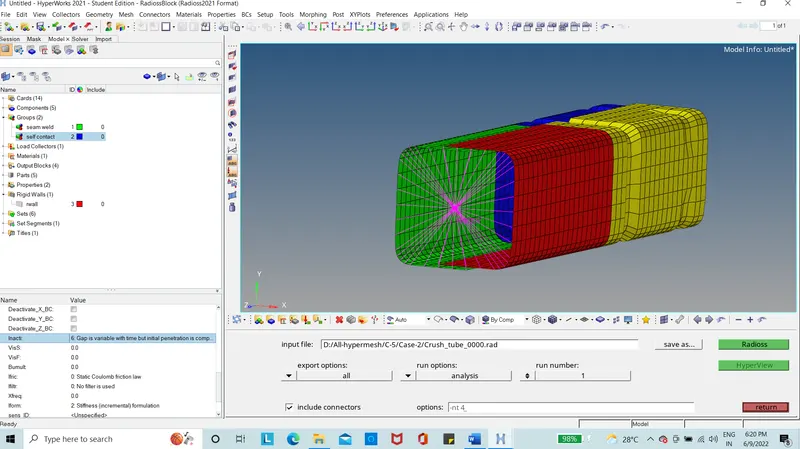
Figure 7: Type 7 Contact
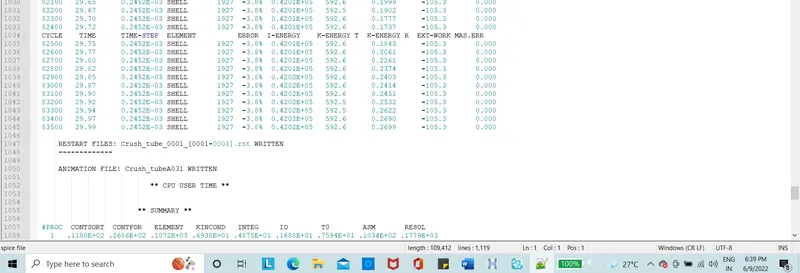
Figure 8: Output file
The results of the energy error and mass error are below 10% which is acceptable. The graphs are plotted using the hypergraph.
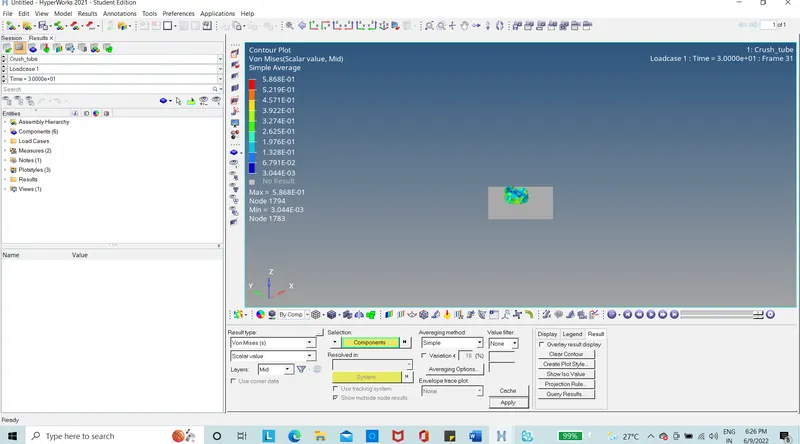
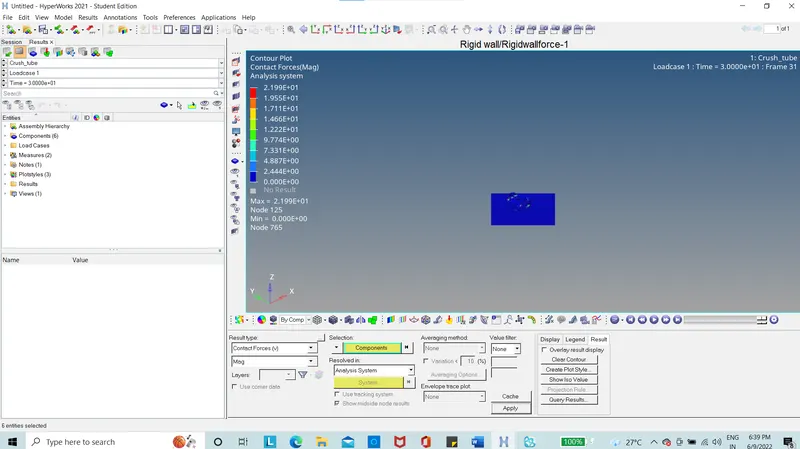
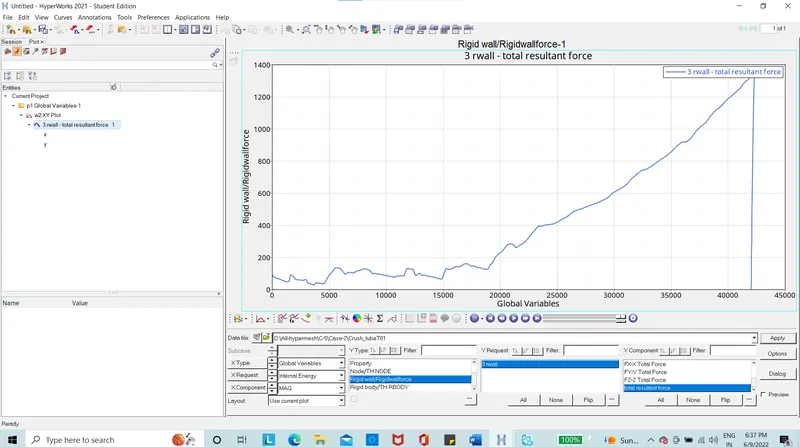
For this simulation, the max stress in von mises stress is 0.58Mpa with max contact force is taken as 219N. The Time history for all the components is created in order to study the deformation and energy variation in each component with respect to time.
The internal energy is rising which is shown in the graph with the rise in the beginning and with notch area as there will be less area at the position there will be smooth curve produced at that point.
Kinetic energy is getting decrease as there will be contact with the rigid wall from the component and will decrease consistently as shown in the graph.
The contact energy will be less at the beginning and there will be a peak on the energy in the graph as there will be accumulation of energy at one point.
The changes are made to the crash box for case 3 by creating Type 11 contact and model is run using the radioss solver.
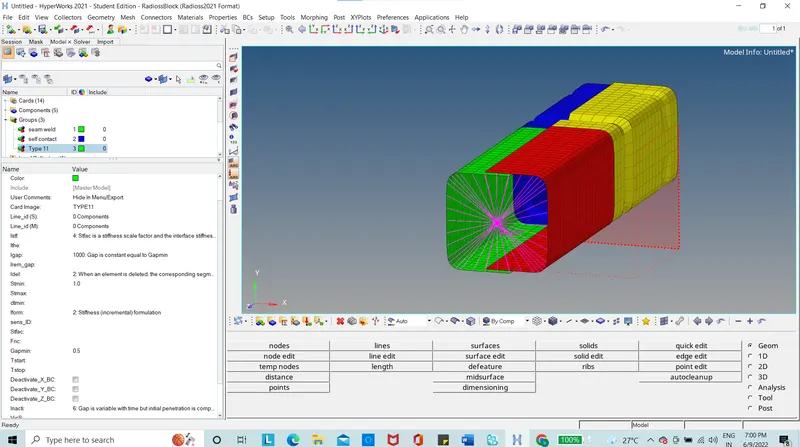
Figure 9: Type 11 contact
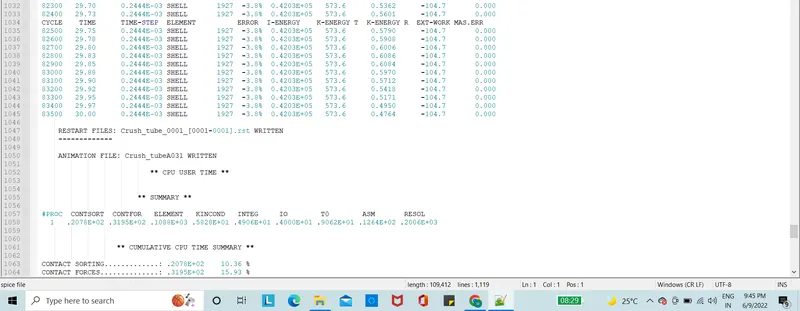
Figure 10: Output file
The results of the energy error and mass error are below 10% which is acceptable. The graphs are plotted using the hypergraph.
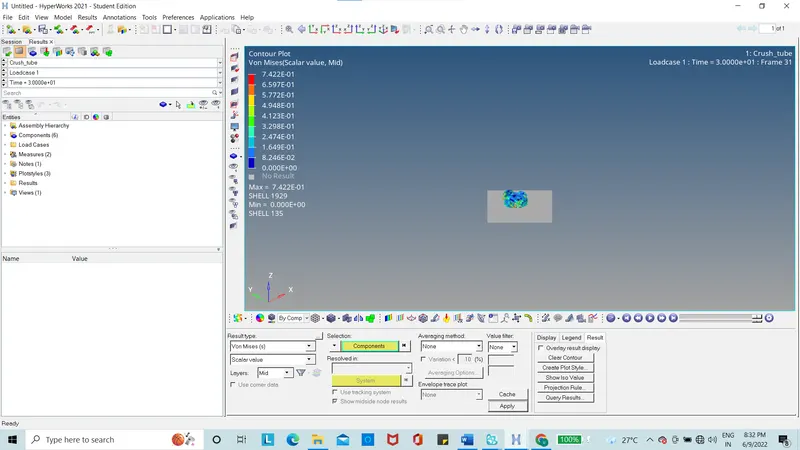
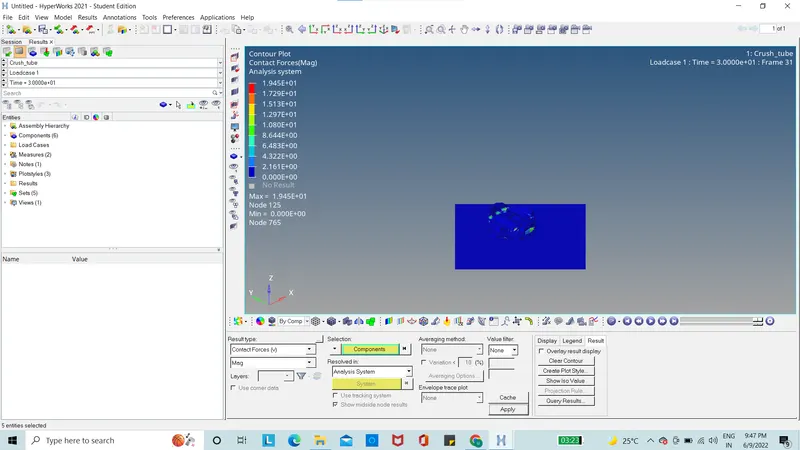
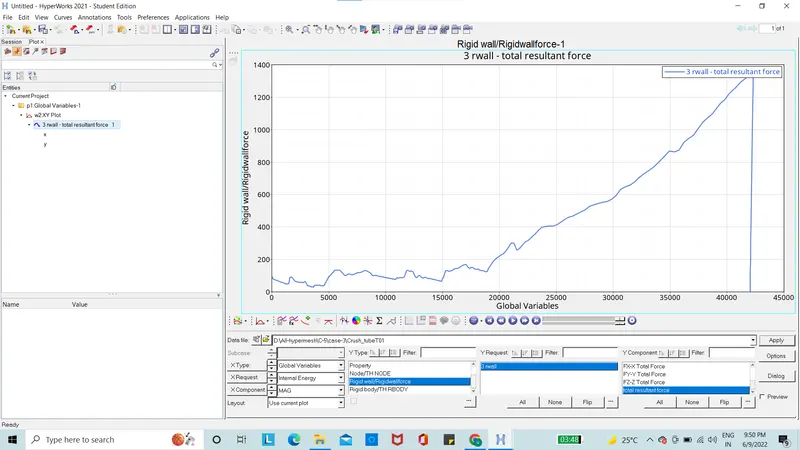
For this simulation, the max stress in von mises stress is 0.742Mpa with max contact force is taken as 194N. The Time history for all the components is created in order to study the deformation and energy variation in each component with respect to time.
The internal energy is rising which is shown in the graph with the rise in the beginning and with notch area as there will be less area at the position there will be smooth curve produced at that point.
Kinetic energy is getting decrease as there will be contact with the rigid wall from the component and will decrease consistently as shown in the graph.
The contact energy will be less at the beginning and there will be a peak on the energy in the graph as there will be accumulation of energy at one point.
The changes are made to the crash box for case 4 by removing the notches model is run using the radioss solver.
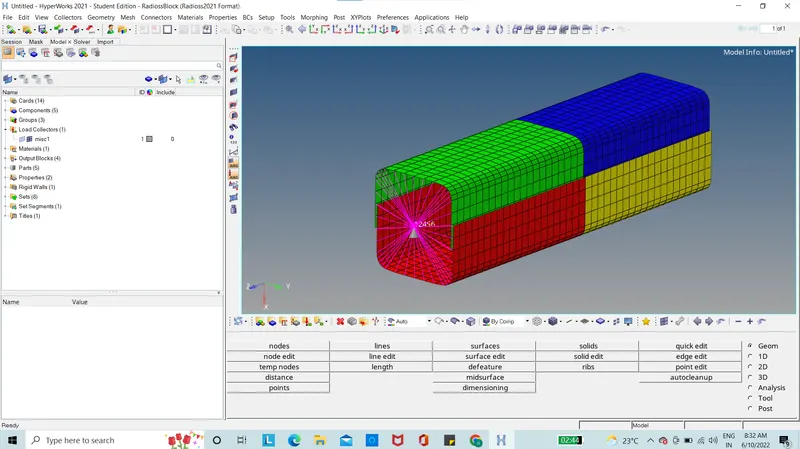
Figure 11: Crash box without notches
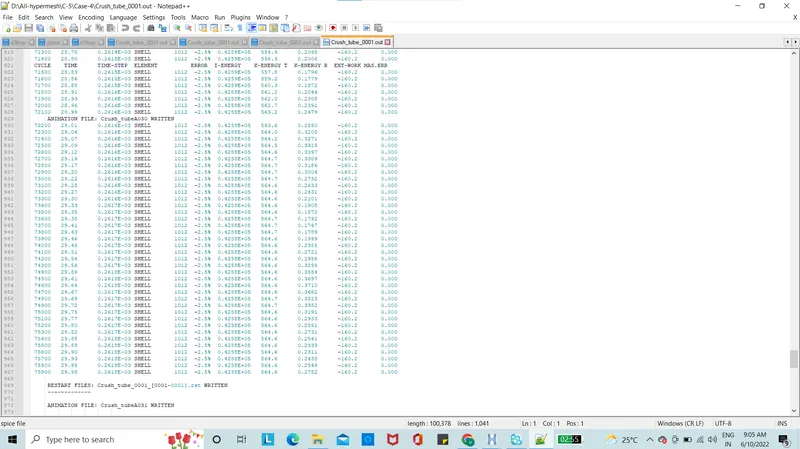
Figure 12: Output file
The results of the energy error and mass error are below 10% which is acceptable. The graphs are plotted using the hypergraph.
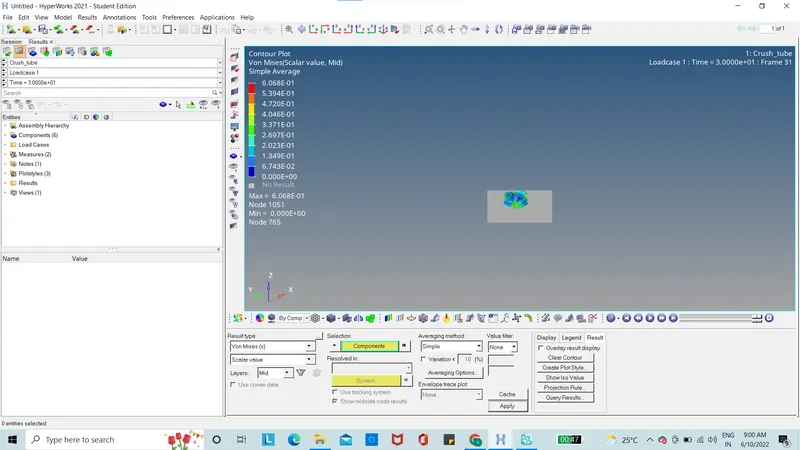
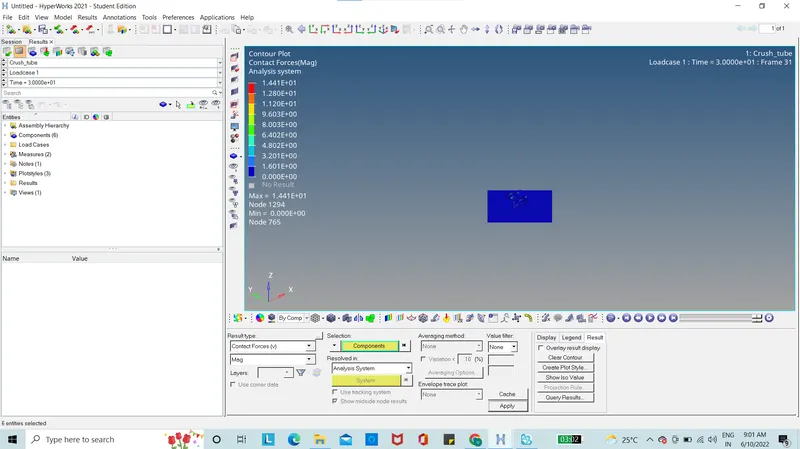
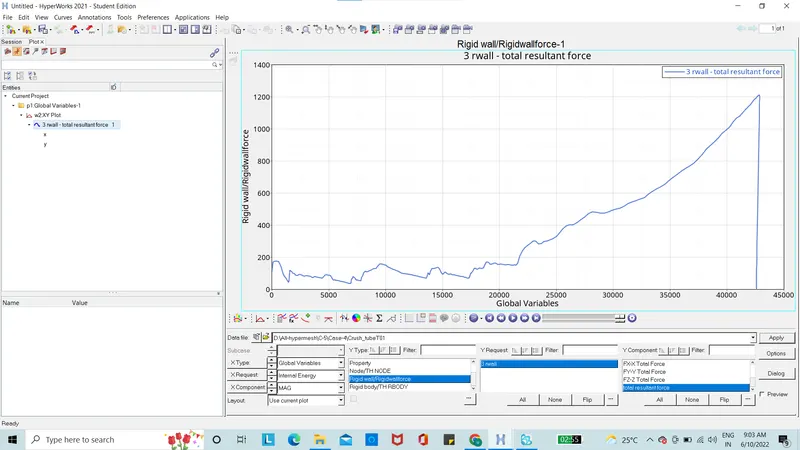
For this simulation, the max stress in von mises stress is 0.606Mpa with max contact force is taken as 144N. There is less forces produced due to no notches present in this case. The Time history for all the components is created in order to study the deformation and energy variation in each component with respect to time.
The internal energy is rising which is shown in the graph with the rise in the beginning and with notch area as there will be less area at the position there will be smooth curve produced at that point.
Kinetic energy is getting decrease as there will be contact with the rigid wall from the component and will decrease consistently as shown in the graph.
The contact energy will be less at the beginning and there will be a peak on the energy in the graph as there will be accumulation of energy at one point. The peak is less than model with notches.
The changes are made to the crash box for case 5 by applying the notches at the middle of model is run using the radioss solver.
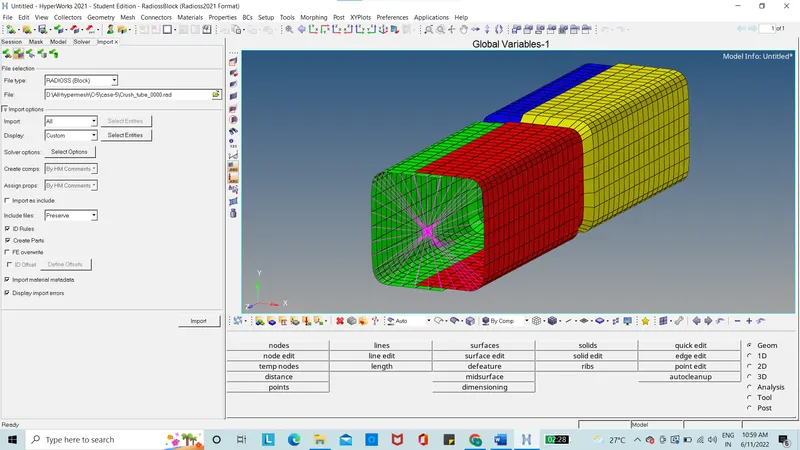
Figure 13: Crash box with notches at middle
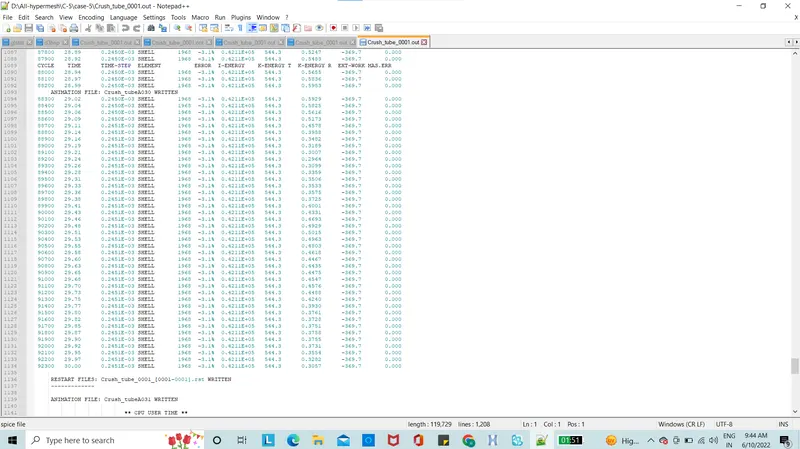
Figure 14: Output file
The results of the energy error and mass error are below 10% which is acceptable. The graphs are plotted using the hypergraph.
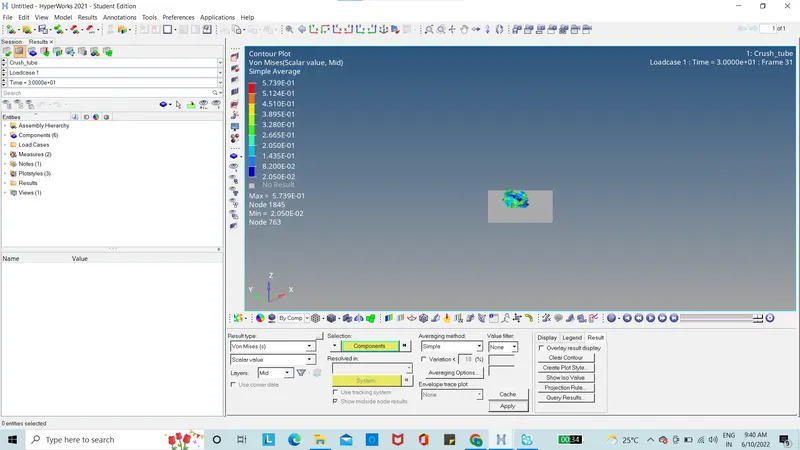
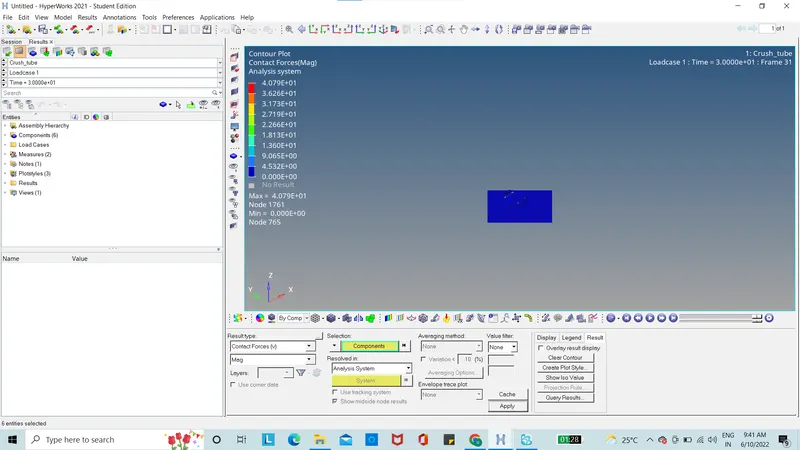
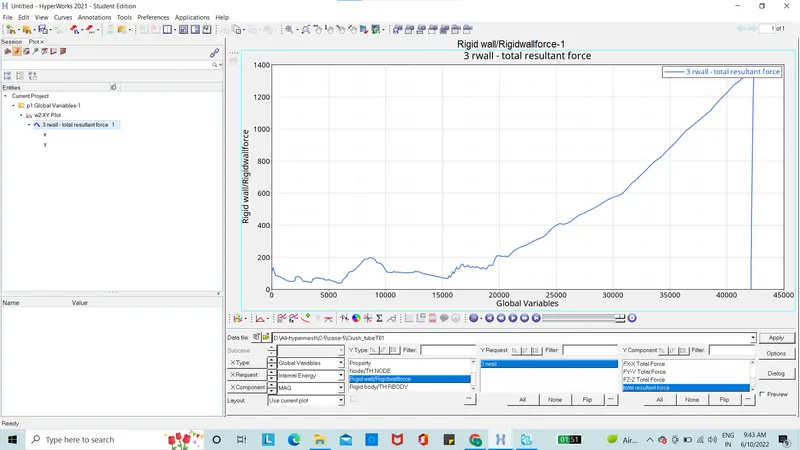
For this simulation, the max stress in von mises stress is 0.573Mpa with max contact force is taken as 407N. The Time history for all the components is created in order to study the deformation and energy variation in each component with respect to time.
The internal energy is rising which is shown in the graph with the rise in the beginning and with notch area as there will be less area at the position there will be smooth curve produced at that point.
Kinetic energy is getting decrease as there will be contact with the rigid wall from the component and will decrease consistently as shown in the graph.
The contact energy will be less at the beginning and there will be a peak on the energy in the graph as there will be accumulation of energy at one point.
The changes are made to the crash box for case 6 by applying the notches at the opposite side of model is run using the radioss solver.
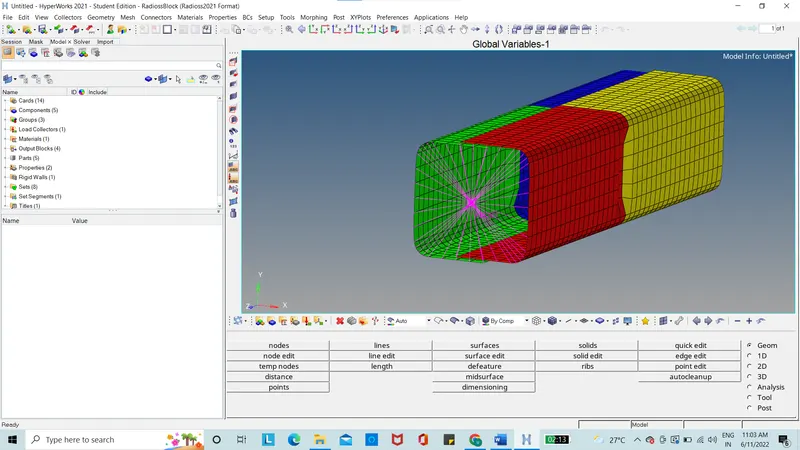
Figure 15: Crash box with notches at opposite side
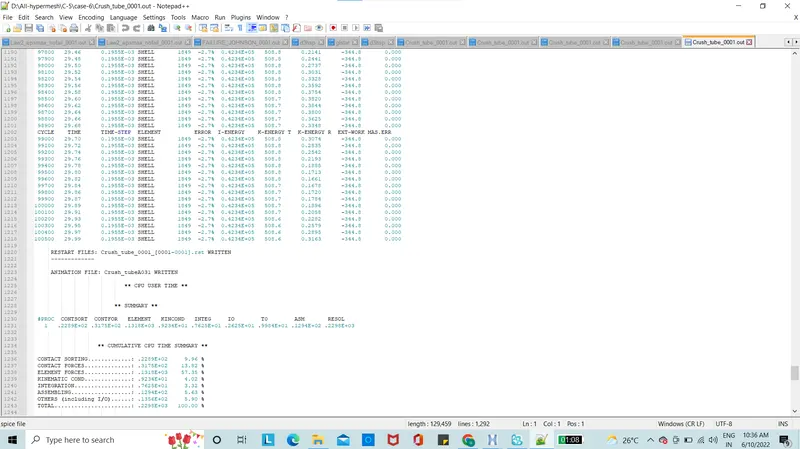
Figure 16: Output file
The results of the energy error and mass error are below 10% which is acceptable. The graphs are plotted using the hypergraph.
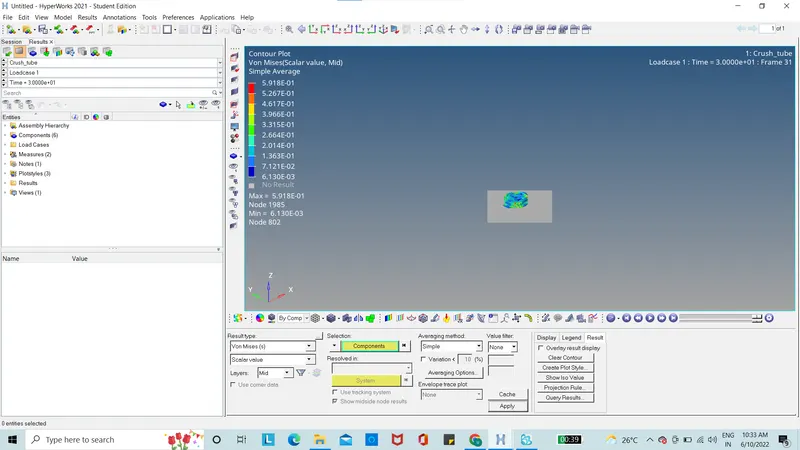
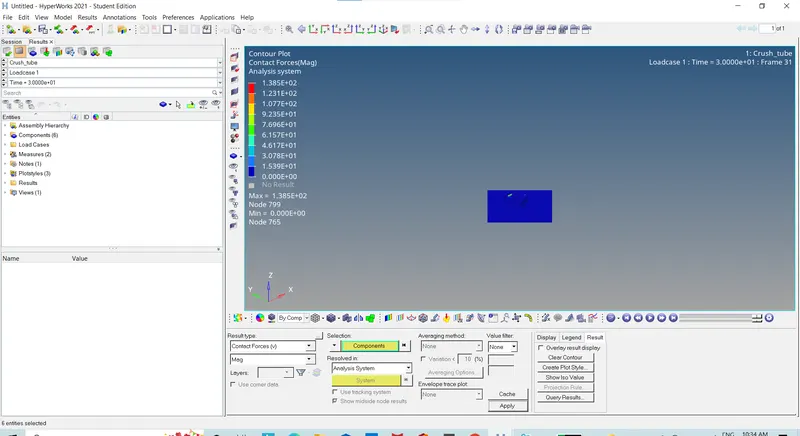
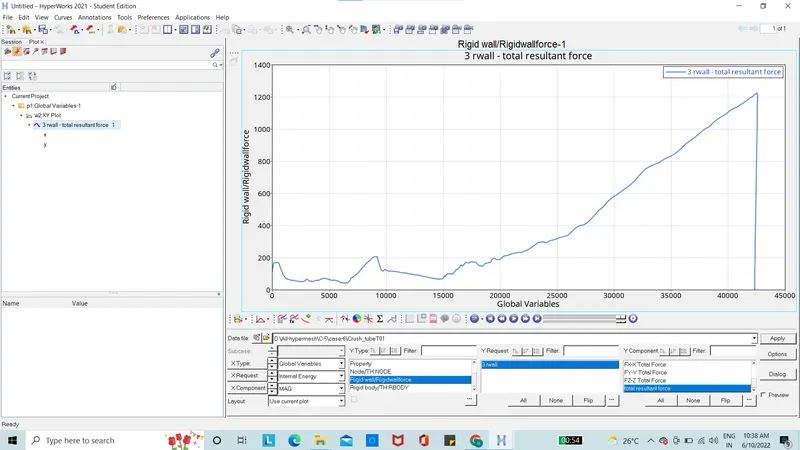
For this simulation, the max stress in von mises stress is 0.591Mpa with max contact force is taken as 1385N. The Time history for all the components is created in order to study the deformation and energy variation in each component with respect to time.
The internal energy is rising which is shown in the graph with the rise in the beginning and with notch area as there will be less area at the position there will be smooth curve produced at that point.
Kinetic energy is getting decrease as there will be contact with the rigid wall from the component and will decrease consistently as shown in the graph.
The contact energy will be less at the beginning and there will be a peak on the energy in the graph as there will be accumulation of energy at one point.
|
Case number |
particulars |
Energy error (%) |
Mass error (%) |
Von mises (Mpa) |
Contact forces (N) |
Reason |
|
1 |
Run as it is |
-3.8 |
0 |
0.69 |
219 |
Contact force is stable |
|
2 |
Change Inacti=6 |
-3.8 |
0 |
0.58 |
219 |
Contact force is stable |
|
3 |
Type 11 contact added |
-3.8 |
0 |
0.742 |
194 |
Type 11 edge to edge decreased energy absorption |
|
4 |
Removing the notches and BC |
-2.5 |
0 |
0.606 |
144 |
Notches removal has decreased energy absorption |
|
5 |
Create notches at middle |
-3.1 |
0 |
0.573 |
407 |
Notches at middle has increased energy absorption |
|
6 |
Create notches at opposite side |
-2.7 |
0 |
0.591 |
1385 |
Notches at middle has increased energy absorption |
Conclusion: The study of Notches explains energy absorption will more with the presence of notches and the position these notches will also impact the results.