Assignment 5
Skill-lync assignment 5
Aim: The objective of this assignment is to experiment with the various contact and boundary condition settings for the given components after ensuring their meshing & qualities, and observe the resultant change in the computed energies and forces.
Case setup: The first component is a car bumper assembly that is imported in an unmeshed state, as shown below.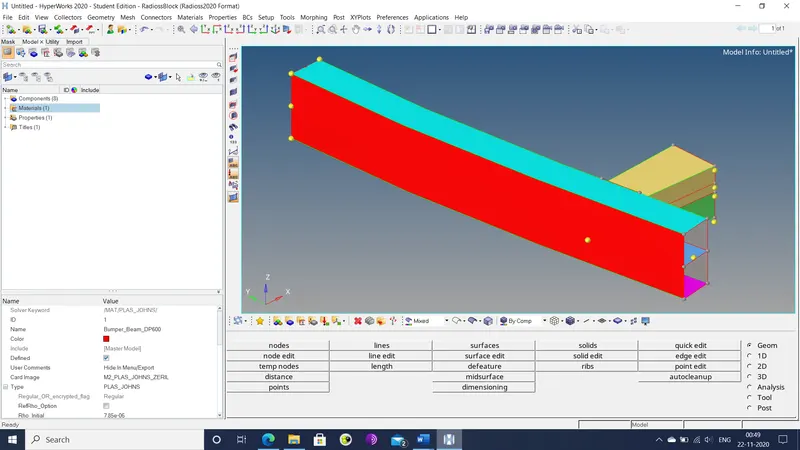
Figure 1: First component
The second component is a crush tube that is downloaded as a set of starter and engine files. The component is shown below.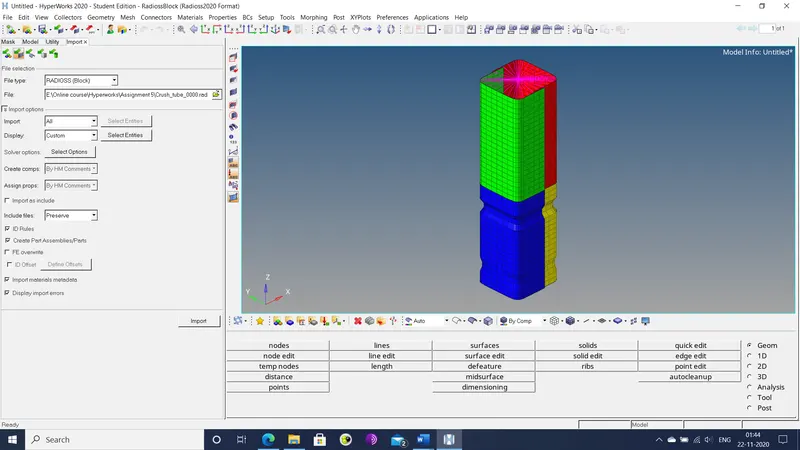
Figure 2: Second component
Procedure: The two components are worked on in the hyper-mesh and hyper-crash workspace.
- The bumper assembly is imported into the hyper-mesh workspace.
- Some sections of the geometry are incomplete, as shown in the image below.
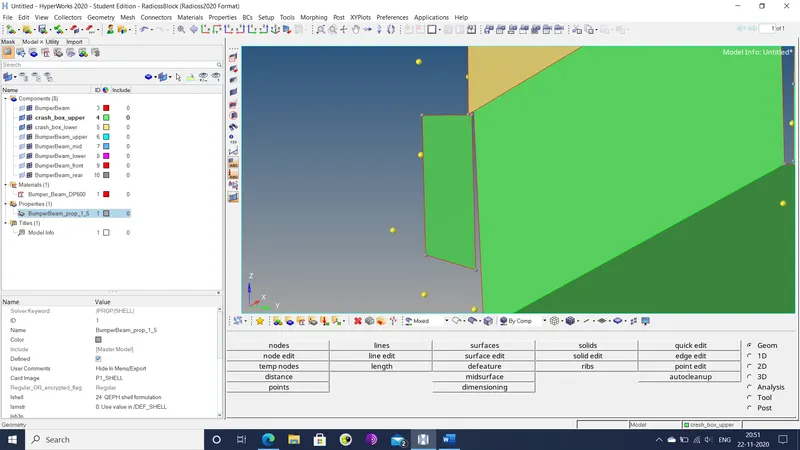
Figure 3: Geometry before fix
These sections are manually repaired by projecting points by the geometry>quick edit>project points, followed by geometry>surface and geometry>quick edit>toggle edge options. The final repaired geometry is shown below.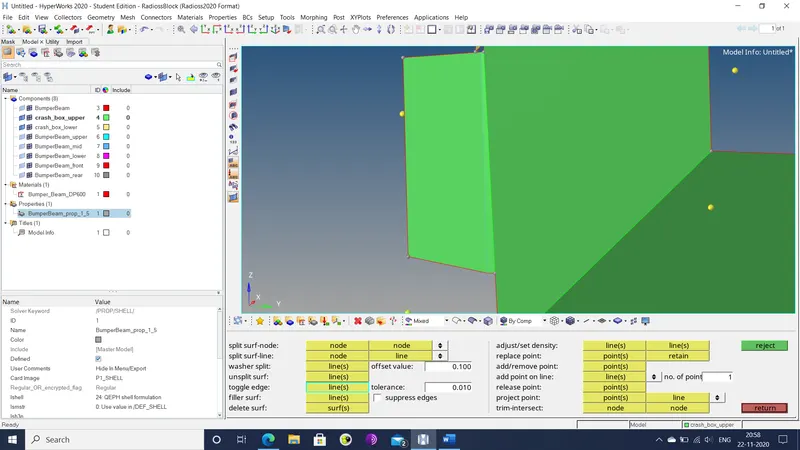
Figure 4: Geometry after fix
- The component is then meshed using the 2D>auto-mesh option with element size of 6mm. The final mesh is shown below.
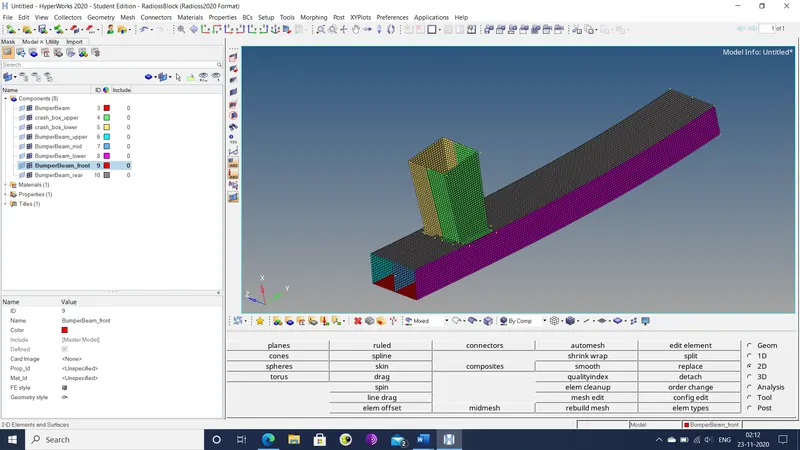
Figure 5: Final meshed geometry
- The starter file for the second component is imported into the hyper-mesh workspace and the simulation is run by the analysis>RADIOSS option. The simulation runs for 275.12 sec and 83469 cycles. The resultant output files are exported to a separate folder.
- The window is divided into 2 separate ones. In one window, hyper-view is used to animate the Von Mises stress in the component. In the other, hyper-mesh 2D is used to plot the internal energy history in the component. A screenshot is shown below.
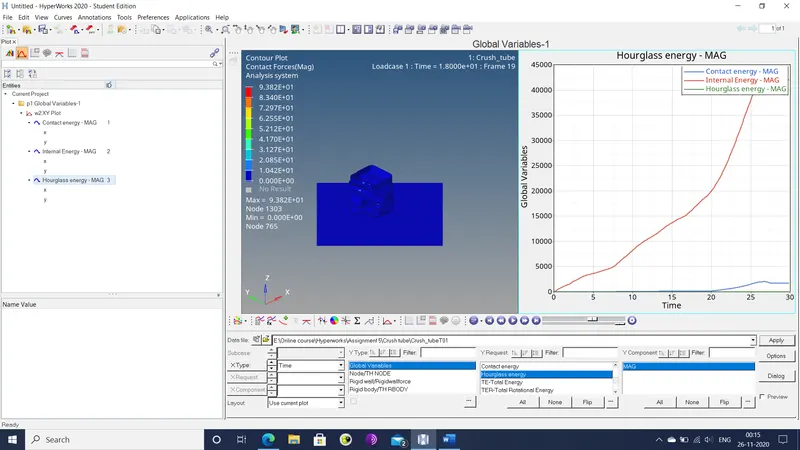
Figure 6: Plot of internal and contact energy
- In a new plot at the hyper-mesh 2D window, the wall forces are plotted, while in the hyper-view window, the contact forces are animated. The resultant plot is shown below.
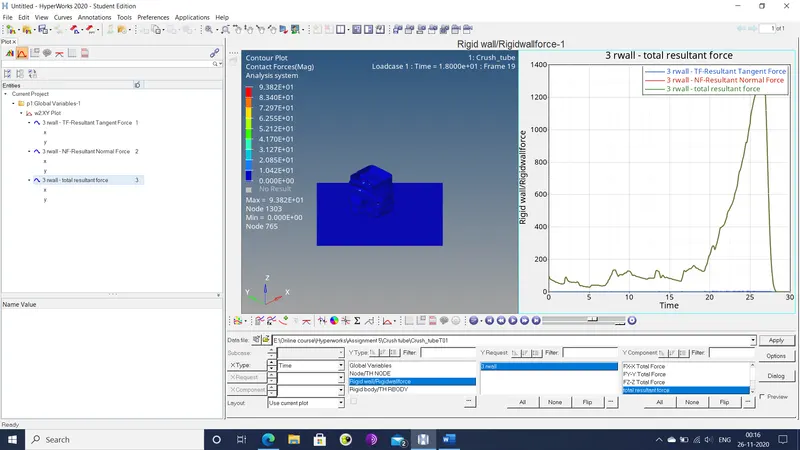
Figure 7: Plot of wall forces
- The hyper-crash application is launched via the applications>hyper-crash menu selection.
- The starter file for the second component is imported into the hyper-crash workspace by dragging it from the file explorer into the workspace.
- In the browser tree, the contact interface referring to type 7 contact (self-contact) is edited so that the value of inacti (stiffness deactivation) is set to 6. This signifies that gap between 2 sections varies with time.
- The model is checked for node penetrations by the quality>check all solver contact interfaces menu selection. Also, the quality>model checker>run menu selection is used to check the overall model for any remaining errors and any error found are rectified by the auto-correct feature.
- The final files are then exported to a separate directory under the name Crush_tube_type7.
- Steps 4-6 are repeated for the exported starter file.
- In the same hyper-crash workspace, a new contact of type 11 (edge-to-edge) for the component is created by the create new object option under the Load case>contact interface menu selection.
- The following parameters are modified for optimal results.
- Stiffness definition (Istf): 4 (K=Stfac*min(Km,Ks))
- Gap/element option (Igap): 3 (Variable gap + mesh size)
- Node and segment deletion (Idel): 2 (When one element is deleted, the corresponding is removed from the interface. Non-connected nodes are removed from the interface)
- Minimum stiffness (Stmin): 1
- Type of friction penalty formulation (Iform): 2 (Stiffness)
- Stiffness scale factor for interface (Stfac): 0.8
- Coulomb friction (Fric): 0.2
- Minimum gap for impact activation (Gap): 0.45
The master edges are set for the entire component with the condition of self contact, as shown below.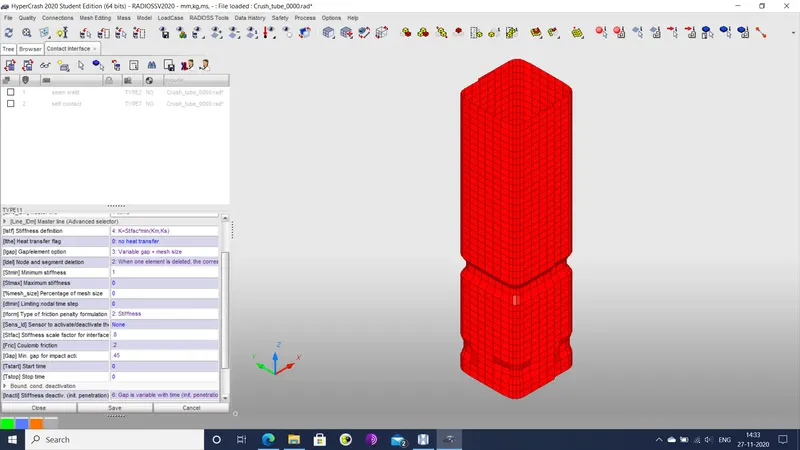
Figure 8: Selection of master/slave edges with self-impact
- Steps 10 and 4-6 are repeated for the component. The output files are named Crush_tube_type11.
- In the hyper-crash workspace, the notches in the component are removed by means of aligning the nodes in the notches with the rest of them in the main body. This is done by the mesh editing>move>align between nodes menu selection. The alignment process is illustrated below.
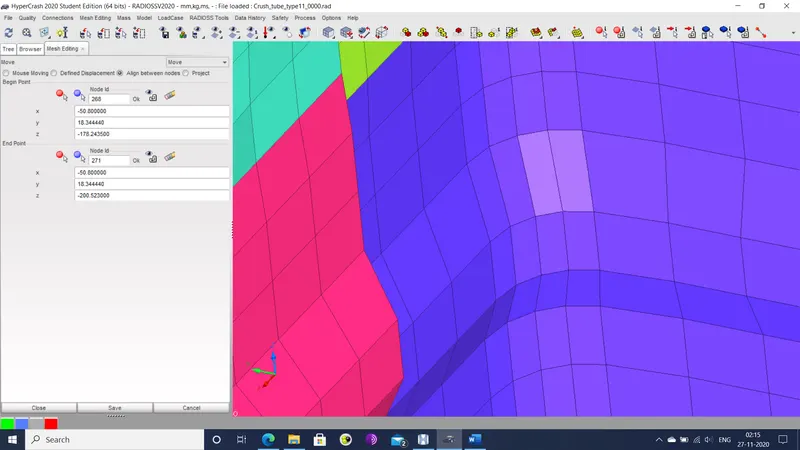
Figure 9: Notch before node alignment
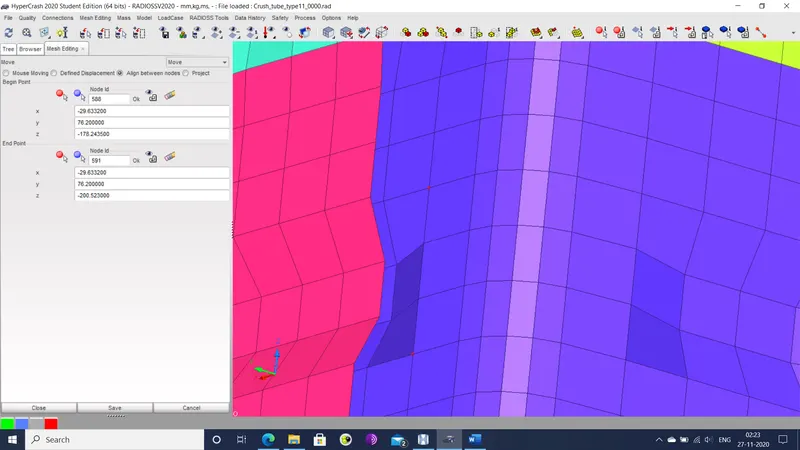
Figure 10: Notch after node alignment
- The boundary condition for the component is then deleted from the browser tree.
- Steps 10 and 4-6 are repeated and the files are exported under the name of Crush_tube_no_notch.
- A new notch is made in the component in the region between the two original notches along the entire circumference by moving the nodes in that region. This is achieved by mesh editing>move>defined displacement menu selection. This is illustrated below.
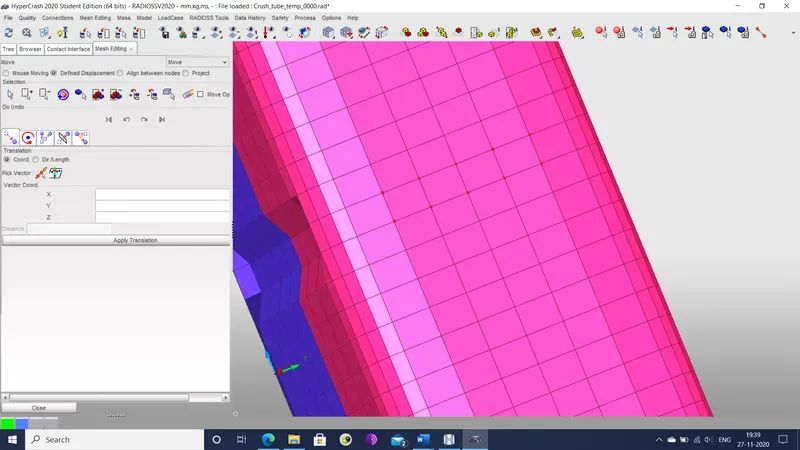
Figure 11: Component surface before node movement
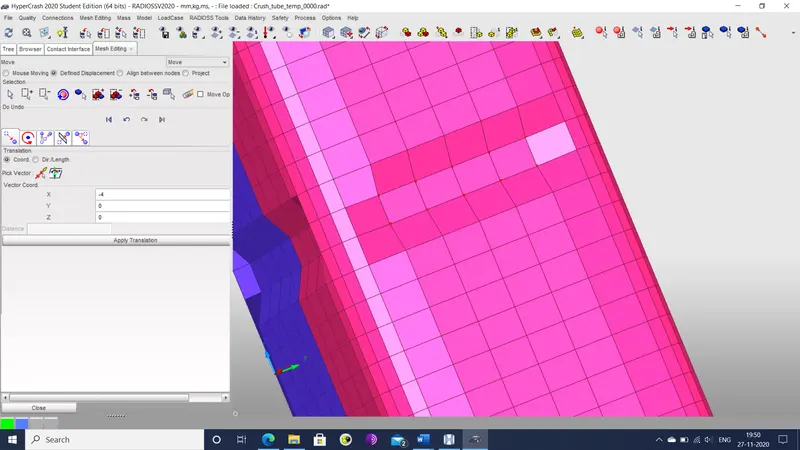
Figure 12: Final notch generated
- Steps 10 and 4-6 are repeated and the output files are saved under the name Crush_tube_notch.
- In the hyper-crash workspace, the notch generated earlier is replaced with one that is only present on two opposite faces, as shown below.
- Steps 10 and 4-6 are repeated and the output files are saved under the name Crush_tube_part_notch.
Results: The computational time and number of cycles are listed in the following table.
Table 1: Run time catalogue
|
Case |
run time |
number of cycles |
|
Crush_tube |
4 min 35.12 sec |
83469 |
|
Crush_tube_type7 |
1 min 49.74 sec |
83705 |
|
Crush_tube_type11 |
2 min 22.36 sec |
82500 |
|
Crush_tube_no_notch |
5 min 4.25 sec |
88813 |
|
Crush_tube_notch |
3 min 7.50 sec |
116543 |
|
Crush_tube_part_notch |
2 min 11.06 sec |
79649 |
The various plots generated in each iteration are listed below.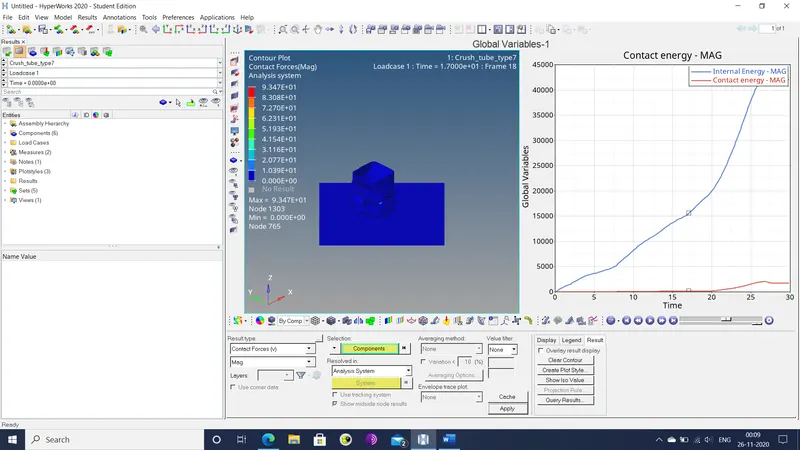
Figure 13: Crush_tube_type 7 energy plot
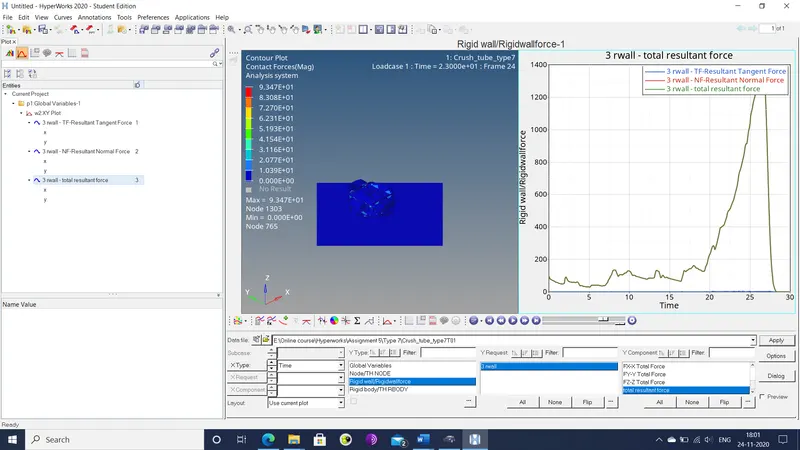
Figure 14: Crush_tube_type7 force plot
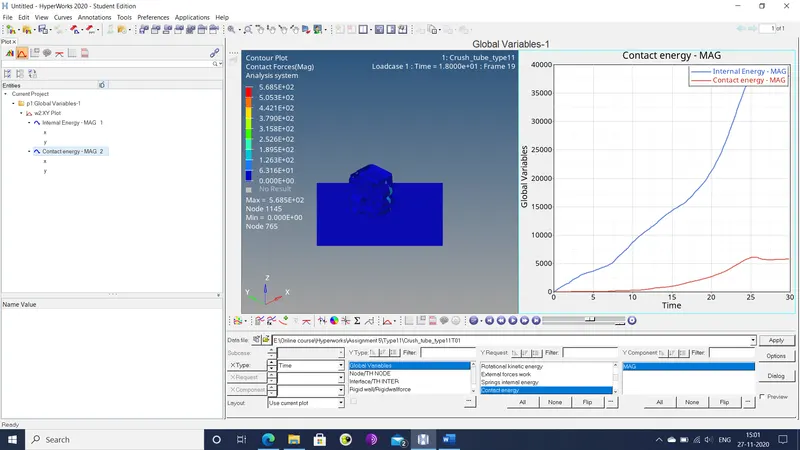
Figure 15: Crush_tube_type11 energy plot
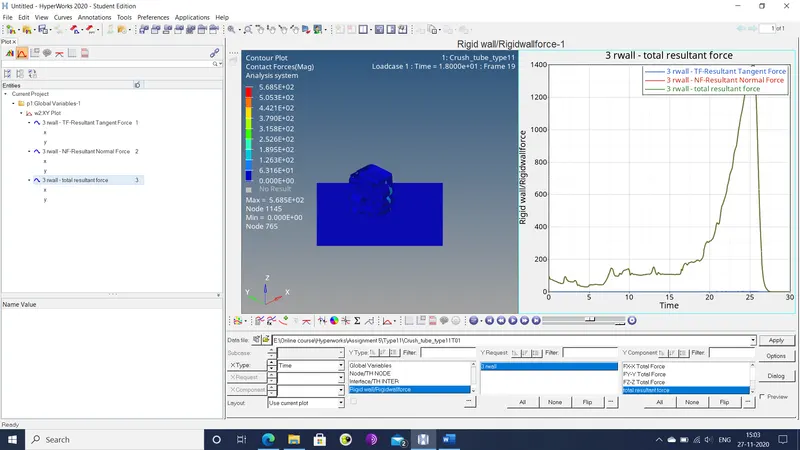
Figure 16: Crush_tube_type11 force plot
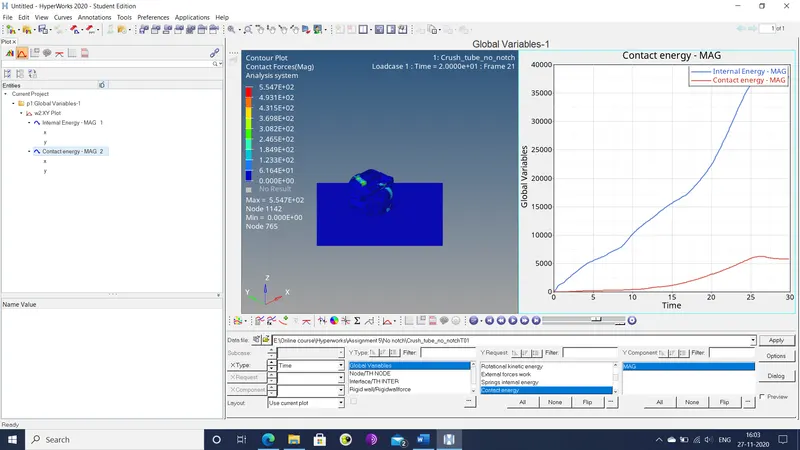
Figure 17: Crush_tube_no_notch energy plot
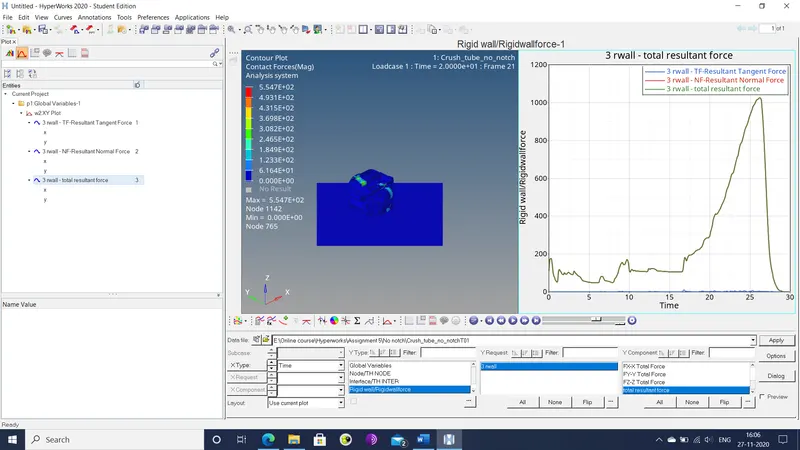
Figure 18: Crush_tube_no_notch force plot
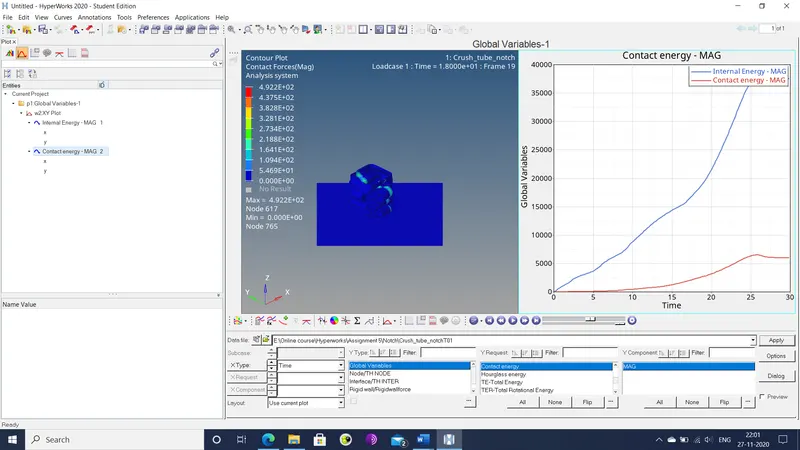
Figure 19: Crush_tube_notch energy plot
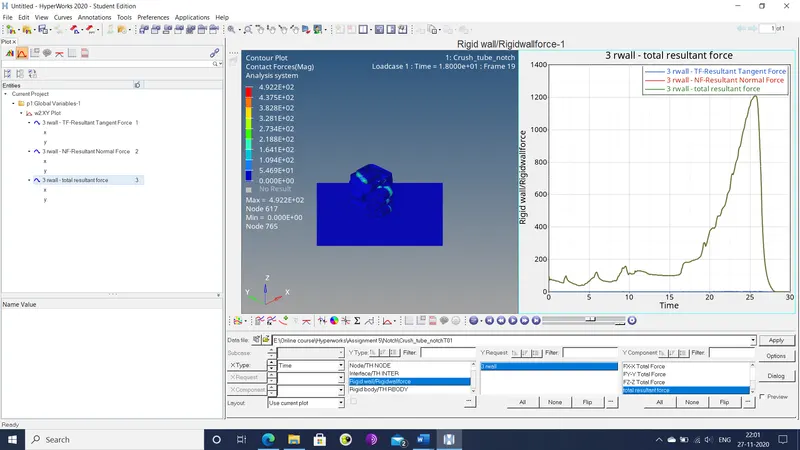
Figure 20: Crsuh_tube_notch force plot
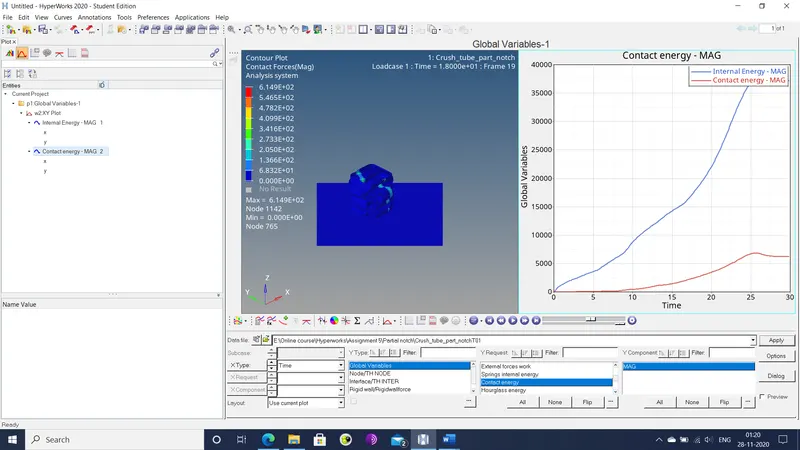
Figure 21: Crush_tube_part_notch energy plot
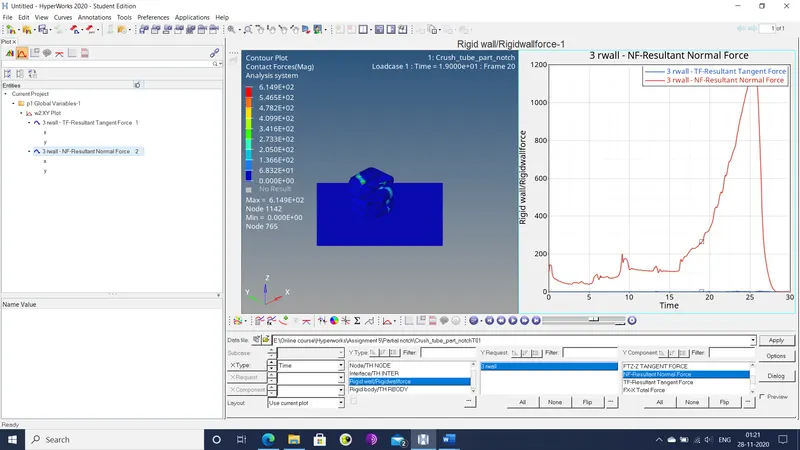
Figure 22: Crush_tube_part_notch force plot
Based on these plots and the observed animations, the following inferences can be made.
- The shortest run time for simulation was observed for Crush_tube_type7, the file with the modified type 7 contact properties. In this iteration, the type 7 contact in question has its element stiffness deactivated so that nodal gap was variable. This removal of contact stiffness has seemingly caused a great reduction in run time. The inclusion of the type 11 contact increases run time due to the need of element edge data for the FE computation. The greatest run time was for Crush_tube_no_notch, the iteration that has the notches removed from the component. Apparently, the absence of the notch introduced more degrees of freedom for elements in that area, which increased the unpredictability of the component failure. The notches assured the collapse of the component at that zone in a particular manner, as explained in the next paragraph.
- On reviewing the various animations of the different iterations, it is apparent that the presence of the notches in the component causes it to buckle inwards in these areas. Also, the component collapses first at these notches and the rest of the component follows from rigid wall to free end. The iteration with the notches removed has the component begin its collapse from the rigid wall end and the collapse propagates to the free end.
- The contact forces illustrated in the animations show that the inclusion of the type 11 contact has the most profound effect on it. It reduces the maximum contact force and causes it to be concentrated on the seam welds.
- Judging by the energy plots that show internal and contact energy histories compiled below, the inclusion of the type 11 clearly has caused the only notable influence on the same.
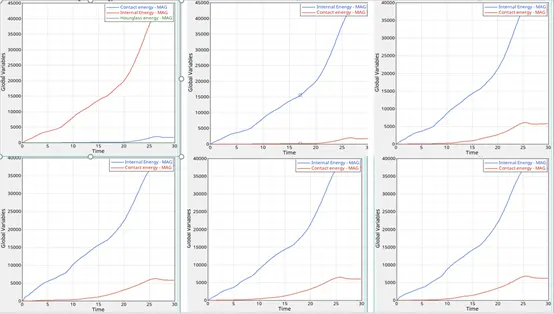
Figure 23: Energy history comparison
The internal energy is reduced, while the contact energy is raised. This might be caused by the additional contact stiffness introduced by the type 11 contact. This contact stiffness absorbs more contact energy and bleeds the internal energy from the component.
- Comparison of the resultant rigid wall forces, as shown below, show that notches in the component increased the peak wall force.
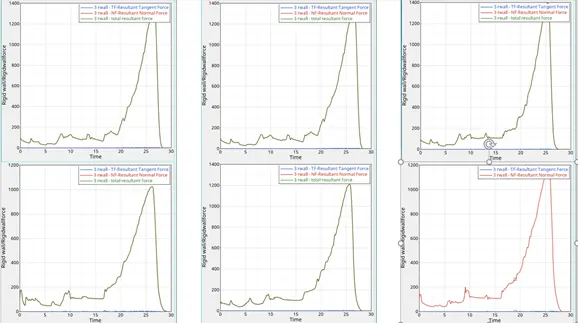
Figure 24: Force plot comparison
The greatest peak force is seen in the original component, while the smallest peak force is seen in the component without notches, i.e. Crush_tube_no_notch. This can be explained by the weakening of the component by the presence of the notches. This means that the component does not absorb as much kinetic energy (also hinted at by the reduced internal energy), which results in the excess kinetic energy being converted ultimately to a higher resultant force on the rigid wall.
Conclusion: The first of the given components has been meshed as per the specified parameters. The second component has been simulated with various contact types and geometric modifications to show their influence on the computed results.