Assignment 5
Analyzing the crushed pattern of the tube by creating depression over the different regions on the surface and tweaking the interface (contact) parameter.
Introduction:
Deforming pattern of any object depends upon the shape and size of the structure. Through intuition, one can predict how any object is going to deform under a certain load. But when complexity arises like a car crash, complex structure working in a dynamic environment is difficult to predict the deformation pattern through intuition with accuracy. So, in this paper, we will be exploring how the tube will behave under different types of depression created at different places under different types of interface.
The discussion will start from model preparation then analysis result and discussion.
Model Preparation:
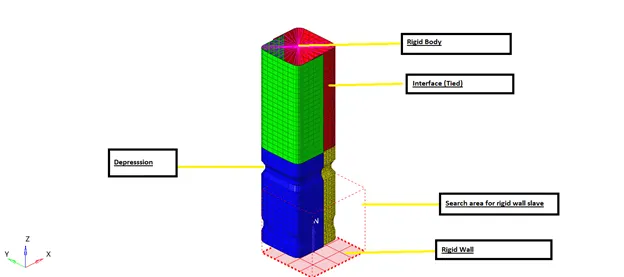
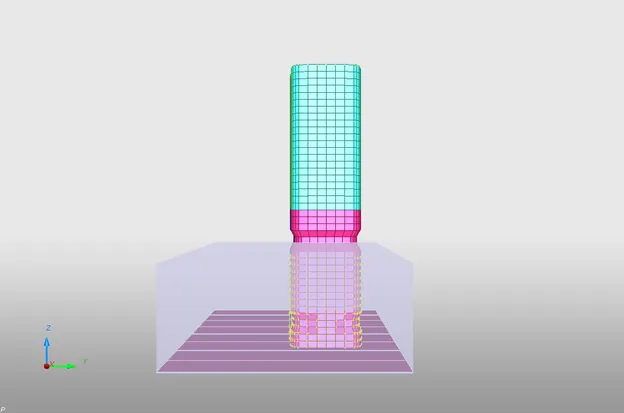
From the very first picture, we can see almost everything required for the definition of the model. A rigid wall is created at the bottom of the tube which will impede the motion beyond that. The rigid wall is featured with the "Search Area" which help in making the node and element, slave of the rigid wall. So, anything that comes inside that search region will be a slave of the rigid wall. The rigid body is created at the very beginning of the tube (Multiple rigid bodies with the master node at the center). Rigid body master node is subjected with initial velocity (Boundary condition>> INIVEL). Thus, every node linked with the master node will experience the same velocity as the master node do.
The interface is crucial and guides the software to give the actual result. It does not allow the body to penetrate or detach based on its function. So, in this case, we have used the "Type 7" interface and "Type 2 (Tied)" interface. Type 7 interface is applied over the whole body as tube as a whole is going to crush thus self-impact will occur. Type 7 interface can consider the same body as a master surface and slave node when required. Type 7 interface does not catch up with the edge to edge contact and penetration is most probable to happen. Thus, to overcome this limitation "Type 11" interface is created to extend our analysis for accurate results. Type 2 interface is used to create an infinitesimally strong connection between the parts. It does not allow the part to separate and hold two-component together.
Material and Physical Properties:
The material used in this case is steel. The definition of the material is given as follow:
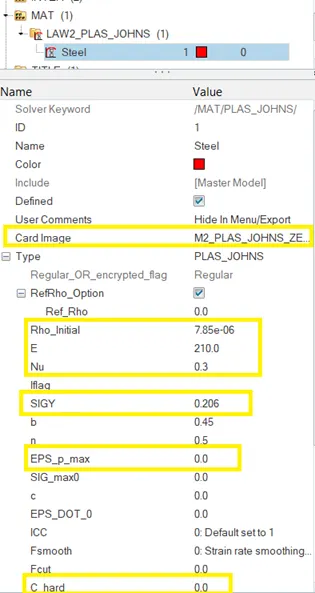
From the above card, we can say that material is isotropic elastoplastic material with no failure criteria as EPS_P_Max is 0 and no failure model is used.
The property will dictate how the value will be calculated for the analysis and how the component will behave under stress.
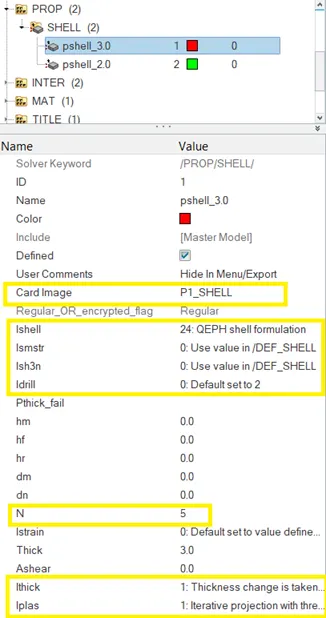
So, from the property card, we can see that shell is of type QEPH which is a reduced integrated shell (chance of occurrence of the hourglass). The strain formulation used is a small strain formulation which is comparatively less accurate than a large strain formulation as non-linearity is not taken into effect. The number of integration points along the thickness is 5 and thickness change is accounted for in case of deformation.
Analysis:
This discussion will be divide into six different cases with a detailed explanation of each component-time history analysis, energy, and rigid wall force. From here we will get an insight into how the body force is distributed for different cases.
- Case 1:
In this case, we will be discussing the Type 7 interface when Inactive is set to 0 (Default). When Inactive is set to default "no action" will be taken towards penetration hence initial penetration will be left as it is without removing penetrations partially or fully.
i) Displacements:
a) part 1:
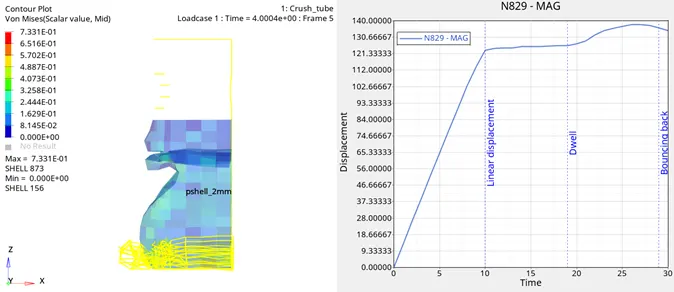
From the above-depicted plot and animation, we can imply that this component was under the linear displacement up to 10 seconds. Between 10 and 19th seconds, the body is dwelling and no displacement has happened. This is due to the deformation of the upper part which absorbs all the energy during a crash at this time. Finally, this component again undergoes the deformation followed by bouncing back at the end.
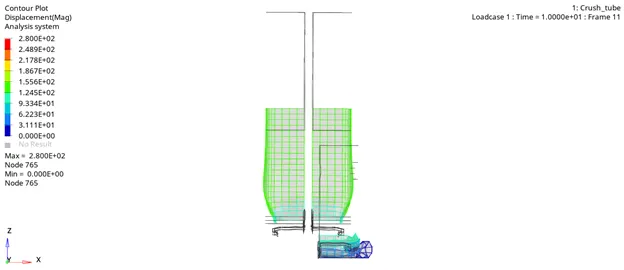
The displacement pattern of the tube is given below to show that the topmost part displaces without any deformation. For remaining information take reference to part 1 displacement plot.
ii) Internal Energy:
a)For Part 2:
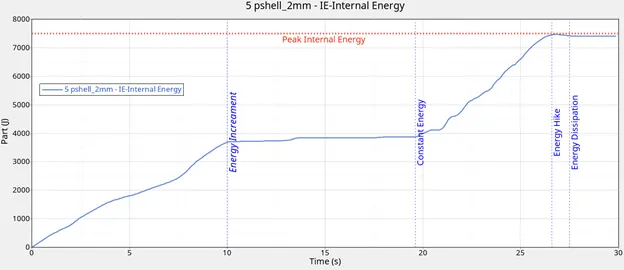
The above plot has much more correlation with the displacement plot. As you compare the energy up to 10th-second increases as deformation continues similarly energy remained constant till 19th second due to dwelling. Then, there is the hike in increase due to rapid deformation after the upper part is crushed. Finally, a tad amount of energy is dissipated due to the bouncing of the tube.
The correlation of deformation with deformation of the part is shown below while the plot is drawn for elements experiencing maximum plastic strain.
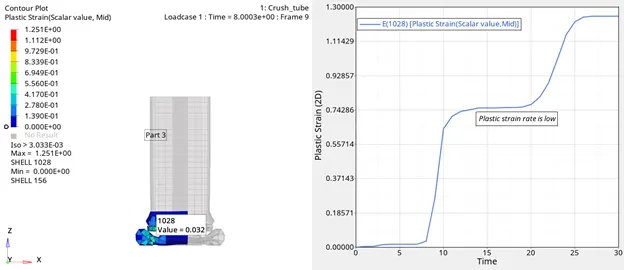
If you follow the internal energy curve and plastic strain curve for each time you will find out that when the strain rate increases, internal energy increase too. After the 10th second and before the 20th second the plastic strain rate is low and so is the internal energy. Hence, if hourglass energy present in large amounts then the result will vary and will make no sense while correlating. In this case, hourglass energy is 0 due to QEPH 24 SHELL type.
b)For the Remaining part:
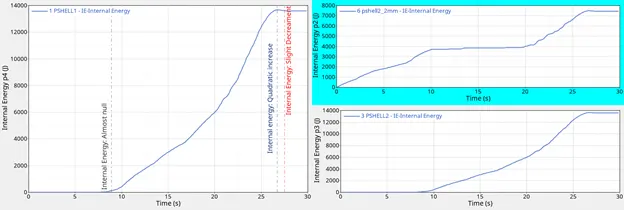
In part 3 and part 4 (Topmost part), the internal energy is varying unlike the bottommost part of the tube. First, the internal energy is almost zero up to 8th seconds because the top part of the tube is under no deformation as shown below:
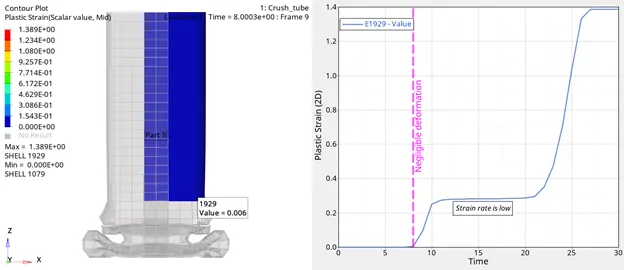
Thus, we can say that internal energy will be stored in the body only when the corresponding body will go under deformation. If we see the internal energy between the 10th and 27th second, then we will observe that there is a quadratic increase in energy. Meanwhile, plastic deformation of the body is also increased.
iii) Contact forces:
a) For part 2 (Bottom part of the tube):
Contact force is useful for analyzing force-induced due to contact occurring between two parts or self-contact. Contact force data is shown below nodes where maximum contact force is induced due to the contact between the tube part and rigid wall, and self-contact.
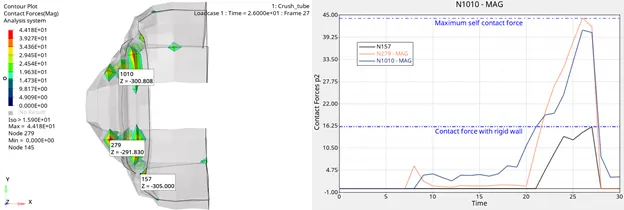
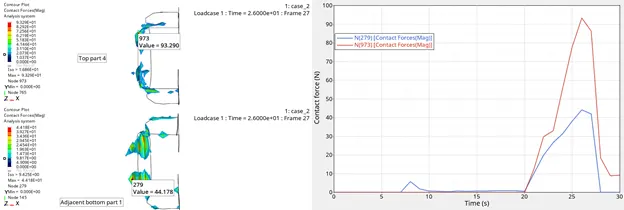
The above animation is showing the maximum contact force that occurred in this particular part (part 2) only. The maximum self-contact force occurring is 44.18 N on node 279 at 26th seconds. Then it vanishes suddenly because of the bouncing effect that occurred at last (Check the displacement plot and internal energy plot). From observation, we can imply that contact energy increases rapidly when the tube is crushed totally which is between 20th to 27th seconds (This time corresponds to the hike in internal energy and displacements).
b) For the Remaining part:
Let's see the contact force occurring on the remaining part:
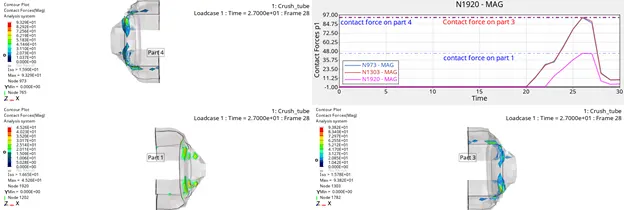
Contact force occurring on part 1 is almost the same as part 2 where both parts are the bottommost part of the tube. And, the contact force occurring on part 3 and part 4 (topmost part) is around 94 N which is the highest value. The pattern of contact force is the same for all the parts of the tube while the magnitude is only different.
Note: From the above discussion we have seen that result for both top parts is almost the same with little difference due to symmetricity and the same is true for the bottom part. So, from here onward we will be a discussion about only the symmetric part only.
Case 2:
In this case, the Inactive parameter is set to 6 which means initial penetration will be removed partially whenever detected. So, from here we expect some changes in internal energy. For check purposes, we are going to explore plastic strain, internal energy, contact force, and then rigid wall force.
- Plastic strain:
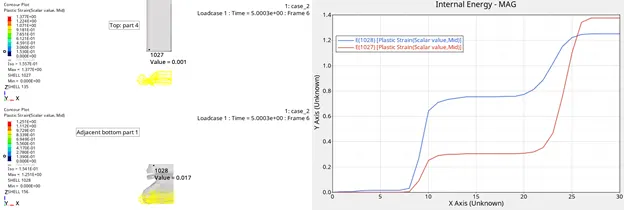
The plastic strain is varying in the same way as it was varying in case 1. Moreover, the maximum value for the plastic strain is also the same and occurring at the same location. Therefore, there is no significant change in the result of plastic strain due to Inactive.
- Internal Energy:
The variation of internal energy is also the same as case 1. The maximum value obtained for each part for internal energy is also the same which means Inactive does not have a substantial effect on internal energy.
- Contact forces:
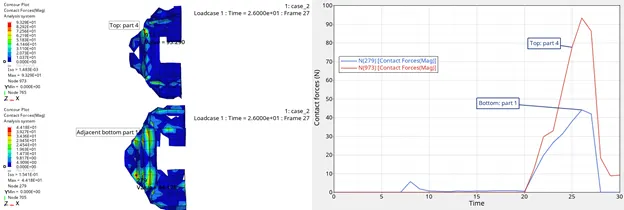
The variation in the contact forces is almost negligible and resemble case 1 in all manner. So, Inactive does not affect contact forces too.
- Case 3:
As we have activated the Inactive in case 2 for the type 7 interface and noticed no or negligible difference in the result. Now, in this case, we will add one more interface called Type 11 for edge to edge contact. This will improve some deformation patterns of the body from the previous case if edge to edge penetration had happened previously.
Let's start our discussion:
- Plastic Strain:
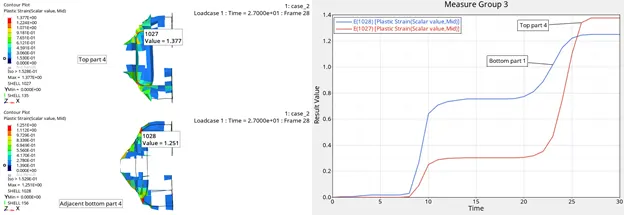
Here, the element id 1027 strain most in part 4 with the maximum value of plastic strain 1.377 mm and the element id 1028 strain most in part 1 with the maximum value of plastic strain 1.251 mm. Now, if we compare this case with the previous case the result will no difference which means type 11 does not have a significant contribution in simulation output.
- Internal Energy:
As we have seen that plastic strain does not affect due to type 11 so we will be expecting no difference in internal energy too.
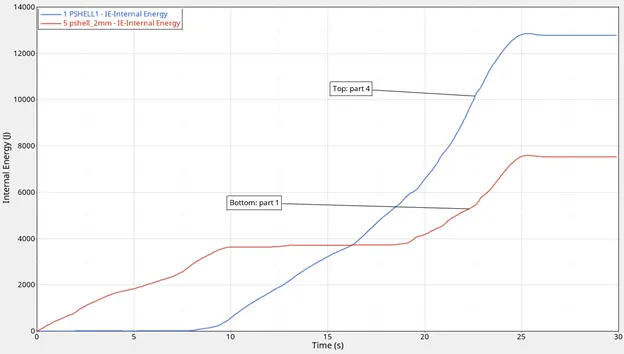
The pattern of increase of internal energy in both parts are the same as previous case and even the maximum value is the same.
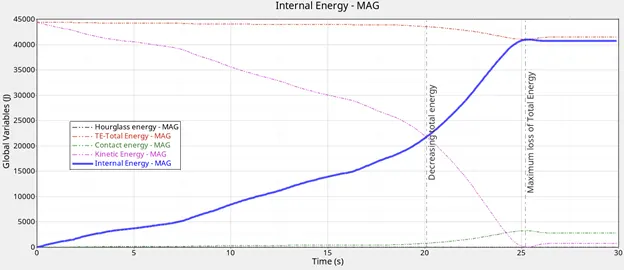
From the figure given below, the energy error that occurred is quite significant which is due to contact energy. This error is substantial in all cases. So, let's know about it a bit.
Initially, the contact energy is constant and increases rapidly around 25th seconds. Below, the total energy of the system is decreased due to an increase in contact energy and shows a significant drop in total energy.
The energy of the whole part
- Contact forces:
The contact force occurring, in this case, is also the same as the previous case. The location of occurrence of maximum contact forces is also the same.
In the upcoming three cases, we will discuss the effect of the notch (depression) over the body at various positions. This will have a significant effect on the result in plastic strain, deformation, and energy. The model used for upcoming cases is the model used in case 3.
- Case 4:
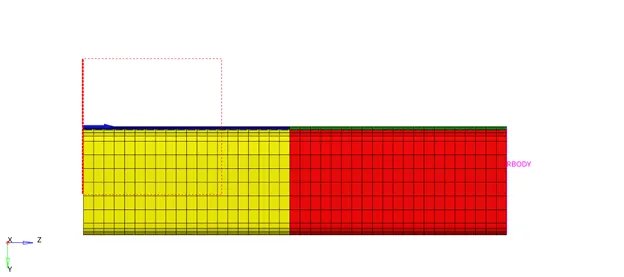
The notch on the surface is removed and made a plain tube for this case. With experimental setup same as case 3.
- Plastic strain:
As the depression from the tube is removed. The deformation pattern will be different. We will see that by exploring the plastic strain plot of the element undergoing maximum strain.
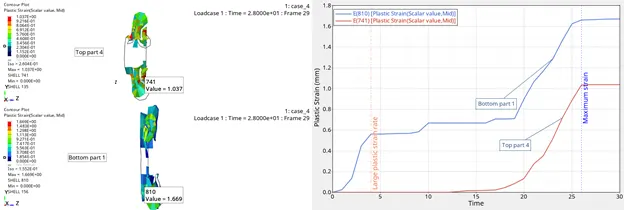
From the above plot, we see that bottom part 1 is going under large plastic deformation than top part 4. The maximum plastic strain that occurred at bottom part 1 is 1.669 mm which is greater than case 3. Previously the maximum strain was occurring at top part 4 which is quite opposite in this case.
Between 0-5th seconds the plastic deformation has occurred very rapidly for bottom part 1 which is not true in case 3. The plastic deformation in top part 4 has occurred lately compare to case 3.
- Internal Energy:
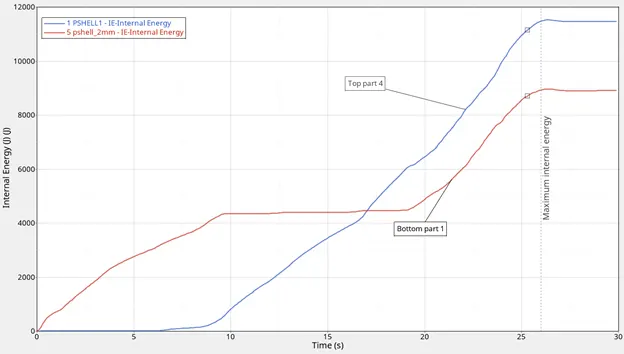
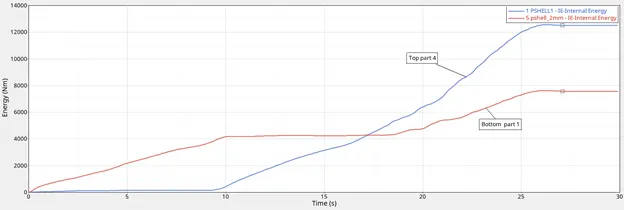
The internal energy of the top part 4 is still high than the bottom part 1 which is the same as case 3. But the quantity of internal energy for top part 4 is less and bottom part 1 is high compared to case 3. The respite that the pattern of increase in internal energy is the same.
- Contact forces:
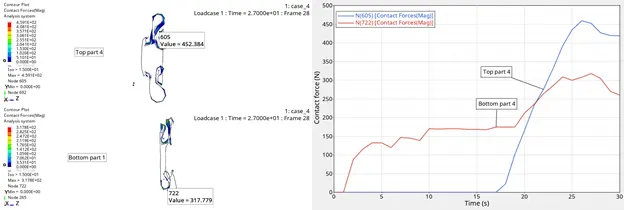
Contact force, in this case, is quite high compared to case 3 for both parts. The part experiencing high contact force is at the corner of the tube (in all cases). The steep increases in contact force occurred around 25th seconds same as in other cases.
- Case 5:
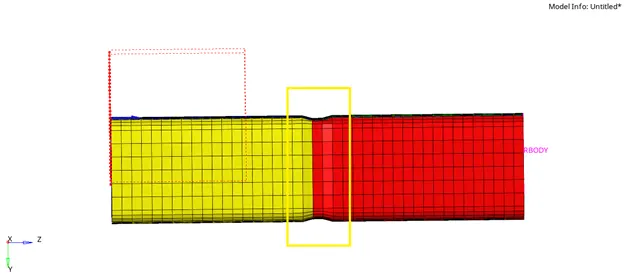
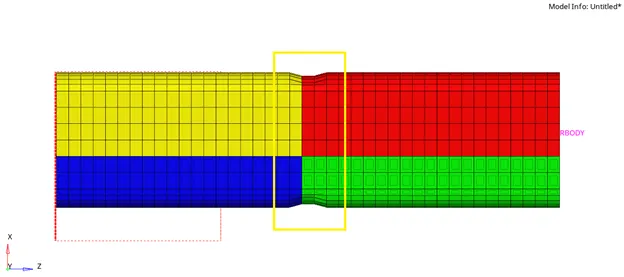
In case 5, the depression is created at the middle of the tube as shown below:
- Plastic strain:
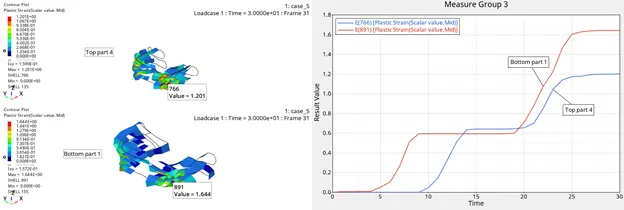
From the picture below, the maximum plastic strain is greater for the bottom part and lowest for the top part. The element experiencing the maximum strain started faced plastic strain from the time 5th for the bottom and 10th for the top part.
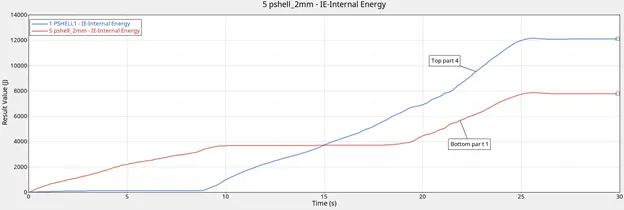
- Internal Energy:
As the depression is created in the tube at the middle part. The internal energy is increased in top part 4 at the cost of a decrease in bottom part 1.
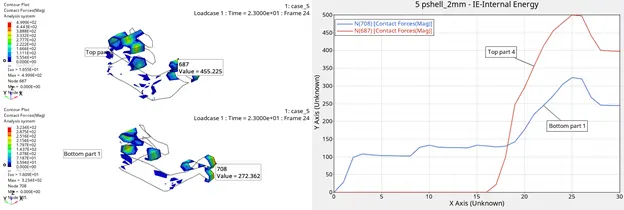
- Contact forces:
The contact force is higher for the top part 1, in this case, compare to case 4. The maximum contact forcer is occurring at the edge of the part.
- Case 6:
The depression created over the tube is at the opposite side only. The remaining two sides is kept plain straight. Now, let's what differences does it create in the results.
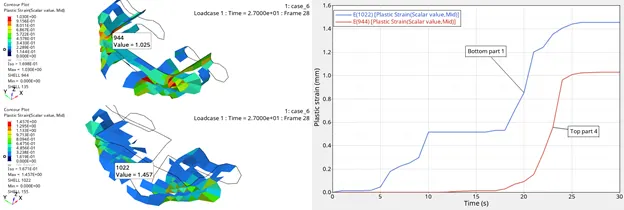
- Plastic strain:
The maximum plastic strain, in this case, is less than the plastic strain occurring in this case. The bottom is under a large plastic strain than the top part.
- Internal Energy:
The internal energy of the top part of the tube is higher than the bottom part of the tube despite the maximum value of plastic strain is occurring in the bottom part.
- Contact force:
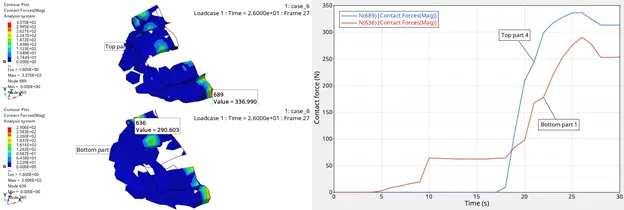
The contact force occurring in this is less for both parts compare to other cases as shown below. But one can notice that the higher value of contact is spread over more elements than other cases (Check ISO value for comparison and animation).
Rigid Wall Force for all cases:
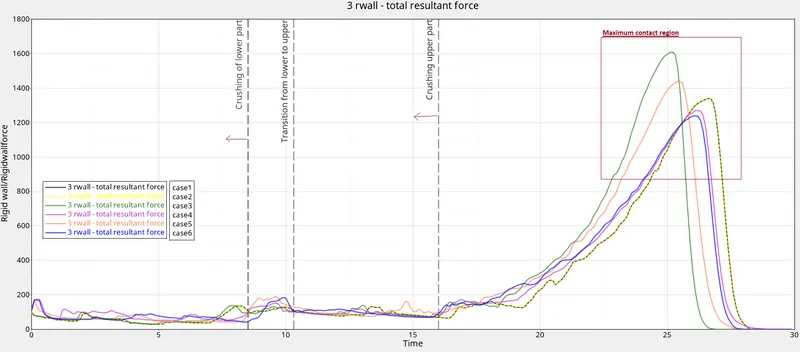
From the above plot, we observe that the force acting on the rigid wall is less between 0-5th seconds which is due to the crushing of the lower part of the tube. Thus, crushing absorbs the energy and prevents the force to pass through the rigid wall.
From 8th to 10th seconds, the rigid wall force has increased and that is due to the transition of the deformation. At this time lower part has deformed and the upper part is about to deform.
Then, the upper part starts to deform which again absorbs all the energy thus reduce the rigid wall force again (10-15th seconds). Eventually, the upper and lower part will be crushed more but at this time self-contact is maximum thus more amount will pass through the crush tube to the rigid wall. During the last seconds, rigid wall force was reduced to 0 due to the bouncing effect.
Results and Discussion:
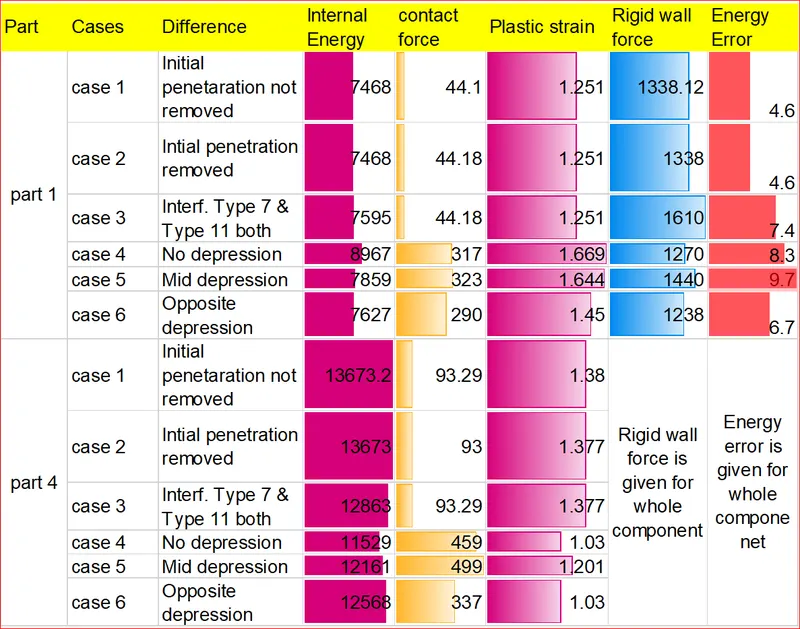
From the above table, it is observed that the overall internal energy for the bottom part is less than the top part of the tube. It is also observed that notch/ depression affect the internal energy of the upper and lower part (case 4-6).
The rigid wall force is higher when type 11 contact interface is applied in case 3. But the rigid wall force is lowest even when type 11 interface is applied in case 6 and this is due to the opposite notches made on the tube. Energy error is maximum for mid notches. Energy error increases when the type 11 interface is applied.
Learning outcomes:
- The relations of the internal energy with contact energy, total energy, kinetic energy, and deformation
- The effect of notches over the rigid wall force, internal energy, and energy error
- Importance of crush and energy absorption in a crash
Conclusion:
From the above discussion, the outcome is that the force acting on the rigid wall depends on the crushability of the tube. The force on the rigid wall is also dependent on the type of interface used.