Assignment 4-RADIOSS Material Laws Challenge
Objective:
The objective of this exercise is to run a same model using different material card(above 7 cards mentioned in question) so that we can understand the effect of applying each type of material properties by comparing the same model on the basis of total number of cycles, Energy error, mass error and simulation time and should be able to draw conclusions on to which model is best suitable for a given condition on the basis of failure shown in animations.
1. Law2_epsmax_failure
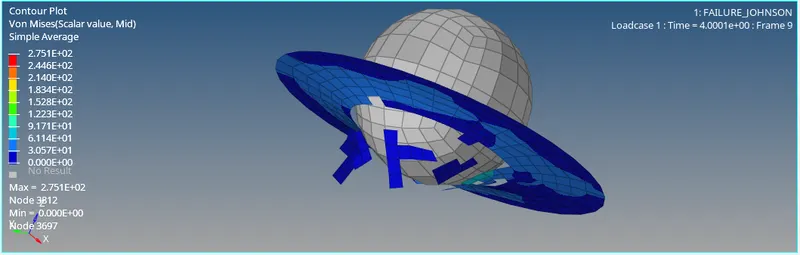
In the first simulation (Law2_epsmax_failure) as we have mentioned eps_max whenever stress values reaches on integrations points reaches max allowed stress value the element got deleted,which results in a very non practical simultion results as shown in thee image below.
Graps Plotted
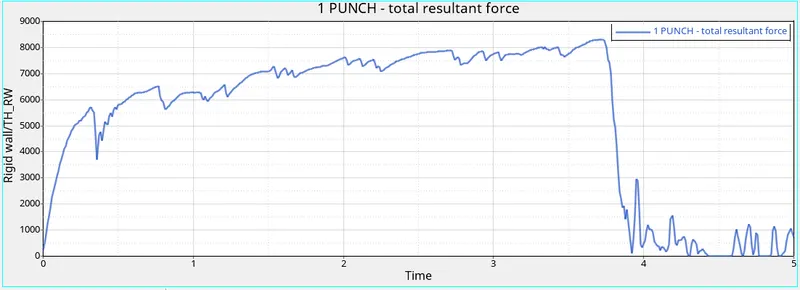
Total resistance forces suddenly decreases as soon sa eps_max reaches and elemtns start getting deleted.
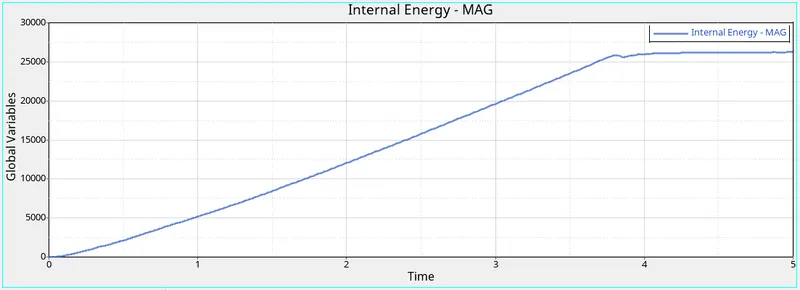
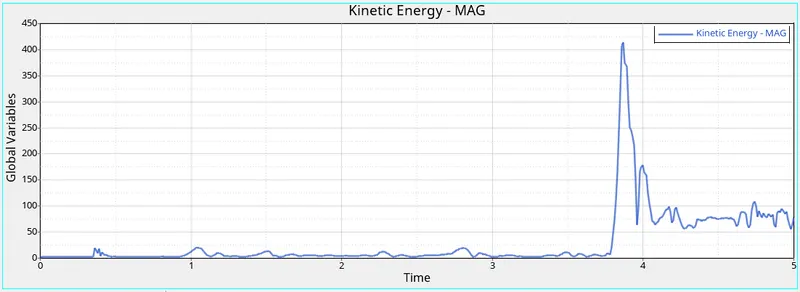
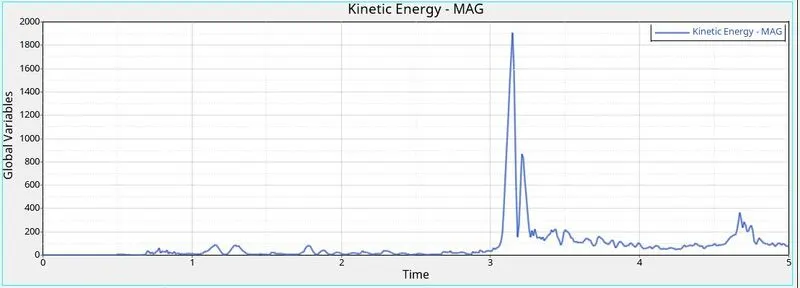
Internal energy increases till elements reaches max stress values and then as soon as eps_max reaches elements no more able to absorb energy and breaks.
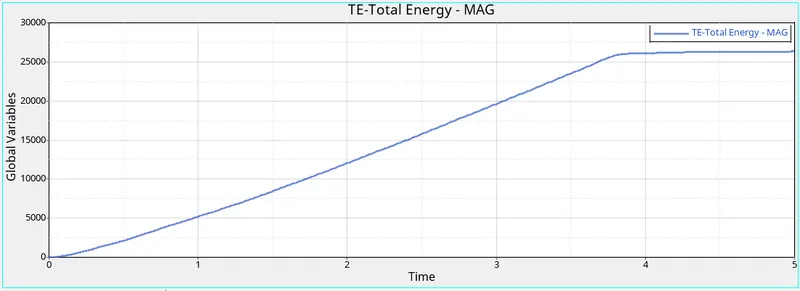
Same is the case with total energy.
In case of QEPH elements type, hourglass energy is expected to be very less.
2. Law2_epsmax_crack
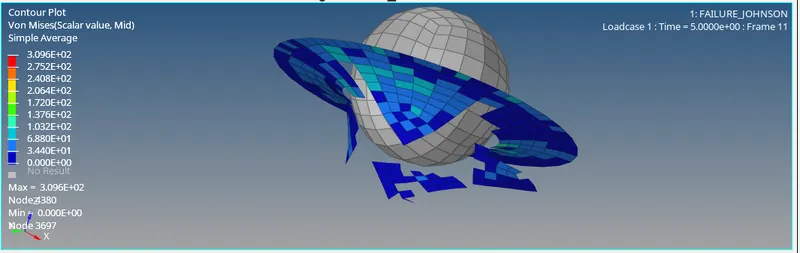
In second case (Law2_epsmax_crack) we have defined a failure model so in this case elements ruptures or crack instead of gettng deleted and produces a more acceptable or pratical failure results.
Graphs Plotted
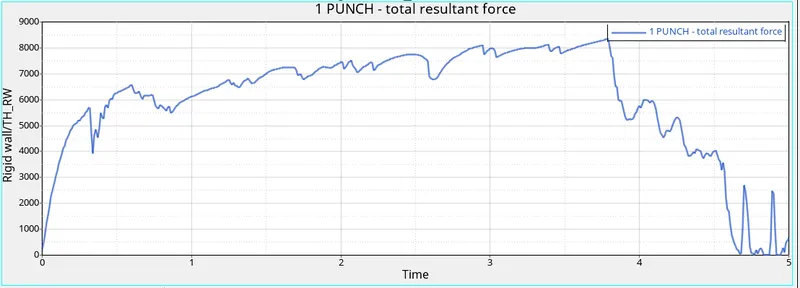
Resistance forces increases gradually as more and more elemts come in contact with the ball and as the elemts start reaching eps_max this time elements are gradually cracking so even the resultant forces are also getting decreased gradually.
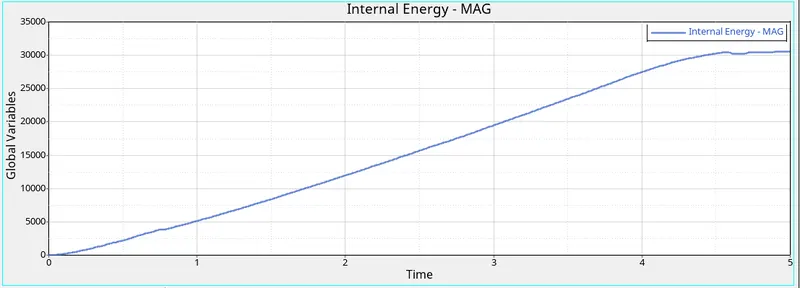
In this case internal energy increase rather gradually as compared to previous case as the elements are not getting deleted and are absorbing energy even while cracking.
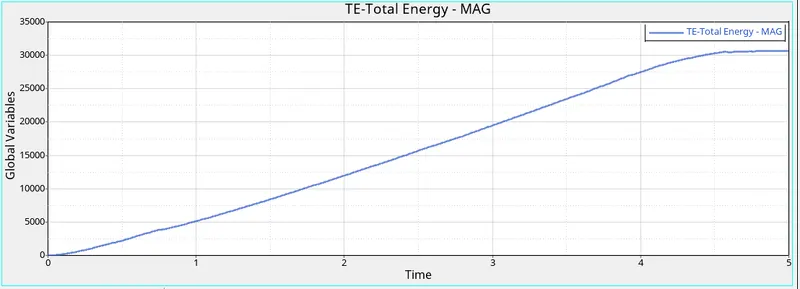
Same is the case with total energy.
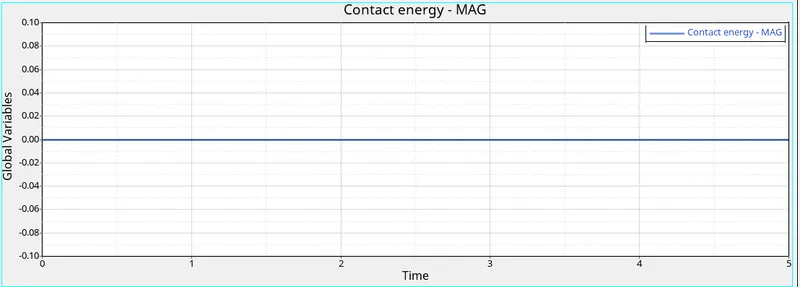
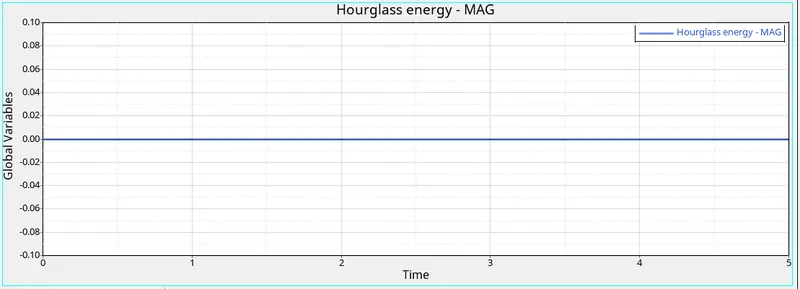
In case of QEPH elements type, hourglass energy is expected to be very less.
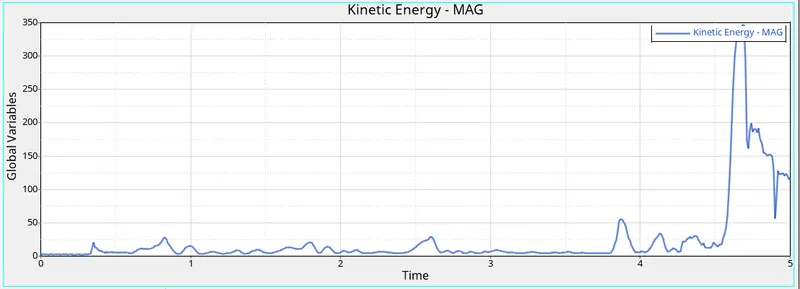
3. Law2_epsmax_nofail
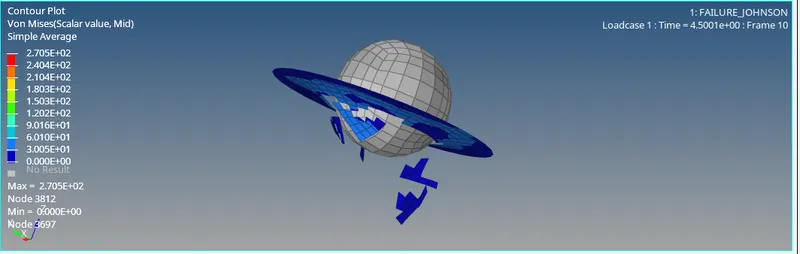
Graphs Plotted
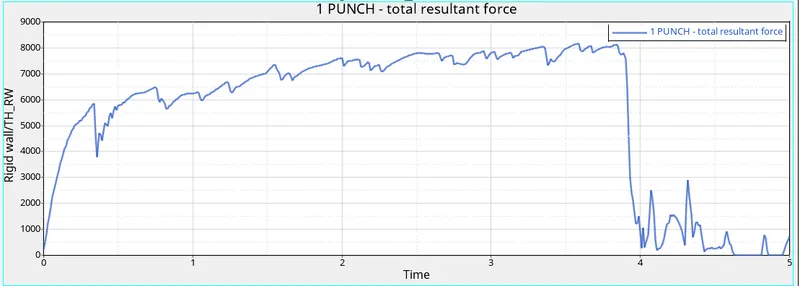
Total resistance forces suddenly decreases as soon sa eps_max reaches and elemtns start getting deleted.
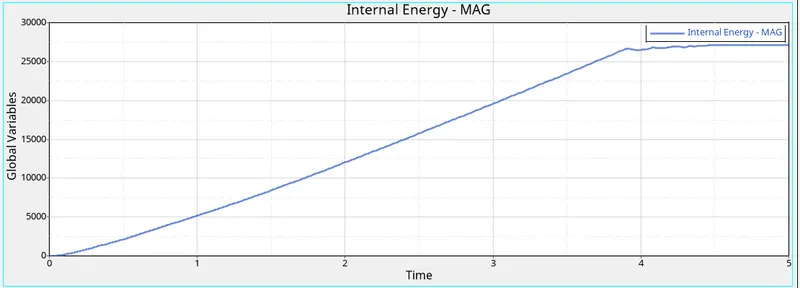
Internal energy increases till elements reaches max stress values and then as soon as eps_max reaches elements no more able to absorb energy and breaks.
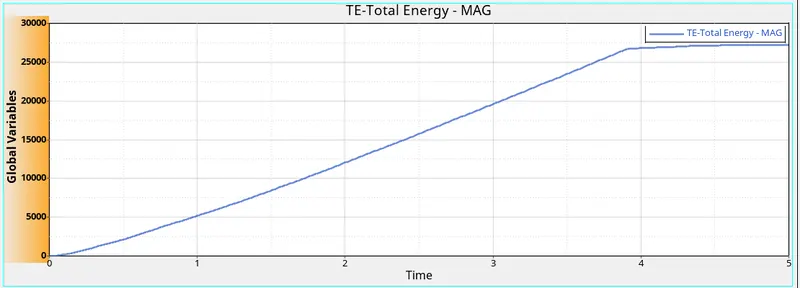
Same is the case with total energy.
In case of QEPH elements type, hourglass energy is expected to be very less.
4. Law2
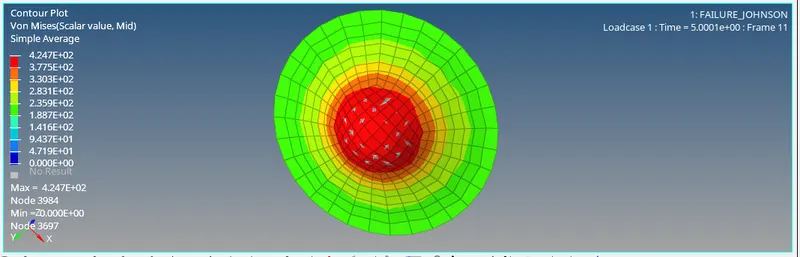
As we have deleted the value of EPS_p_max the elements will never fail they are neither getting deleted not cracked, this can also be seen in animation which is not practical in actual scenario.
Graphs Plotted
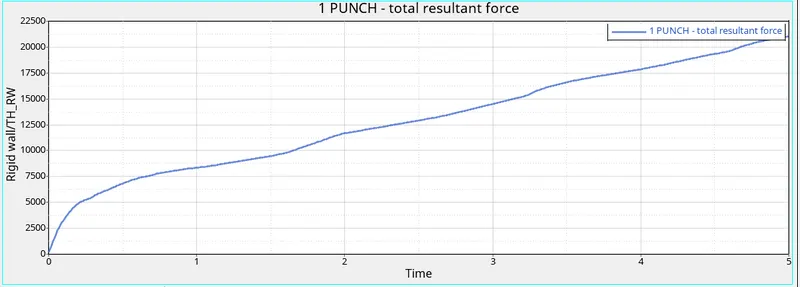
As the elements are not failing at any stress value, the resistance force will keep on increasing.
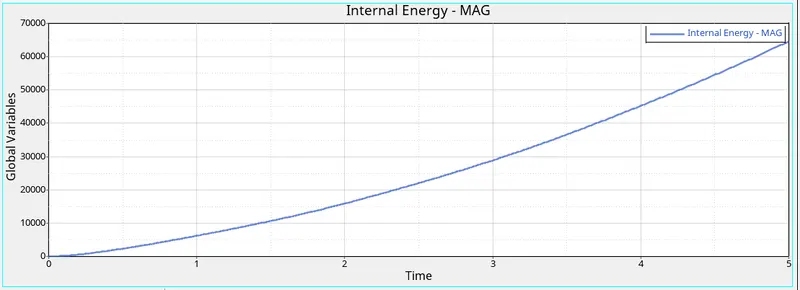
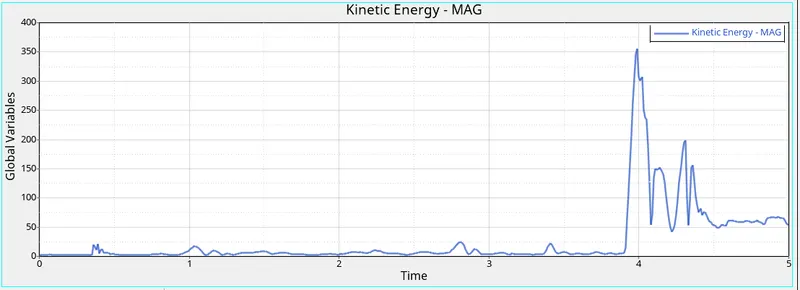
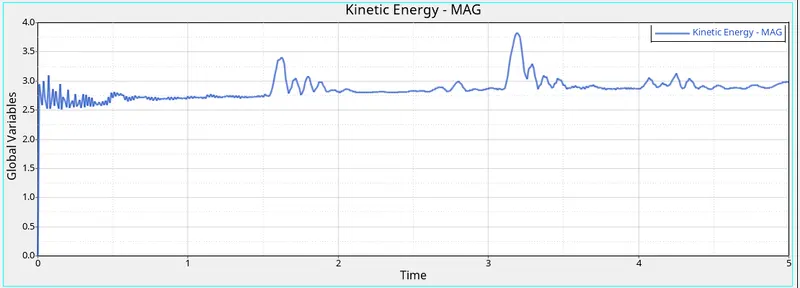
As elements are not failing at any time it keeps on absorbing energy.
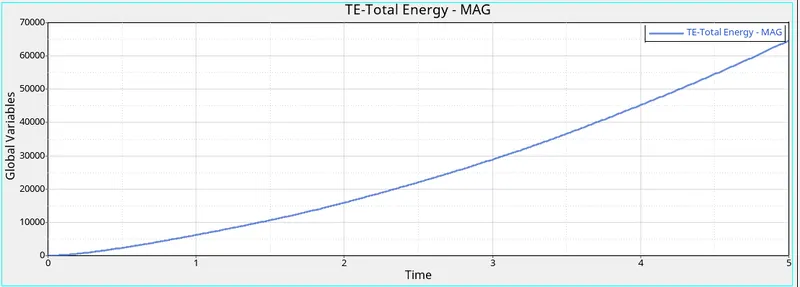
Same is the case with total energy.
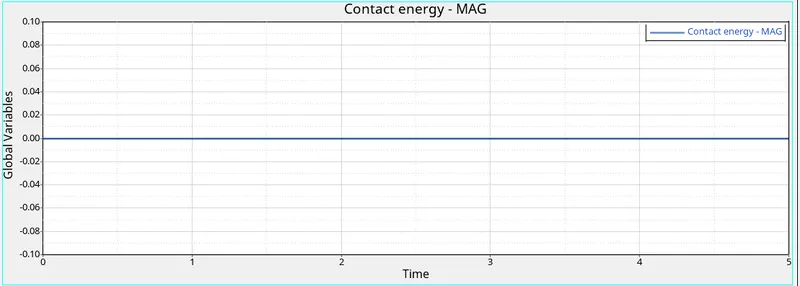
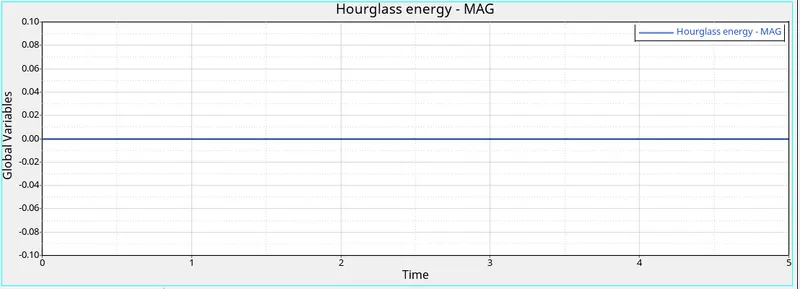
In case of QEPH elements type, hourglass energy is expected to be very less.
5. Law1_elastic
In this case as we have changed the material model to elastic, elements are getting elongated and so the stress generated are also spread over a wide area unlike(4.Law2 ) where the stress concentraton is more at the central part as the elements were not failing.
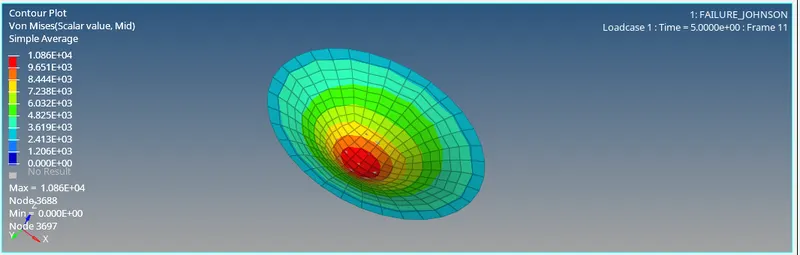
Graps Plotted
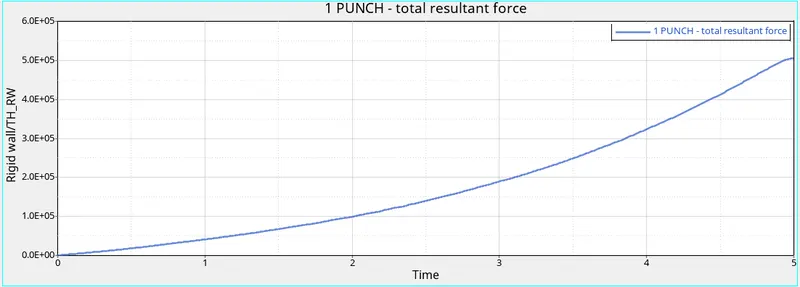
Due to eleastic nature of elements the resisitance force generated is some what gradual.
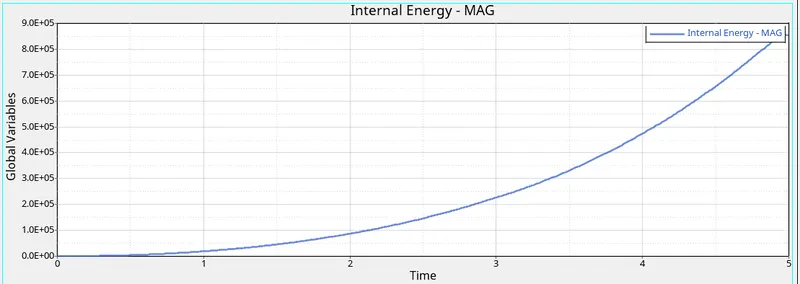
Also due to elastic nature of the elements the increase in internal energy is also gradual.
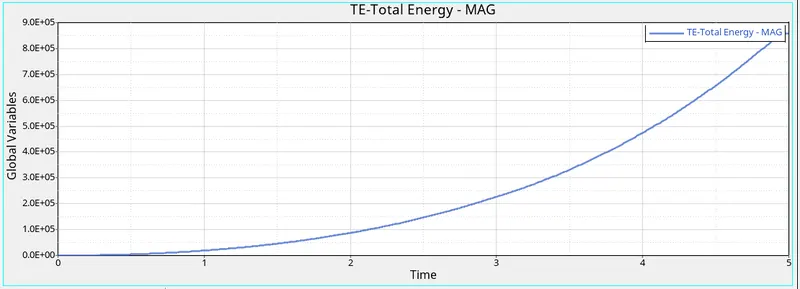
Same is the case with total energy.
6. LAW27
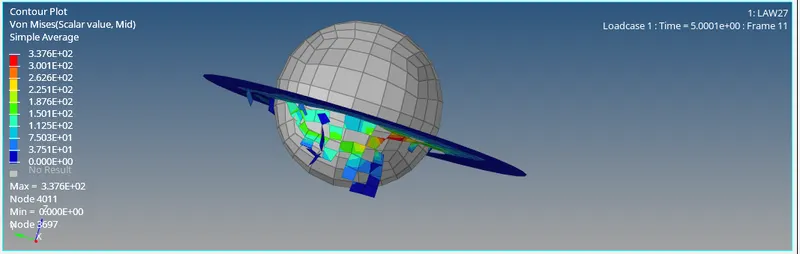
Due to brittle nature of elements, elements does not yield and as soon as max stress value reaches elements starts failing
Graphs Plotted
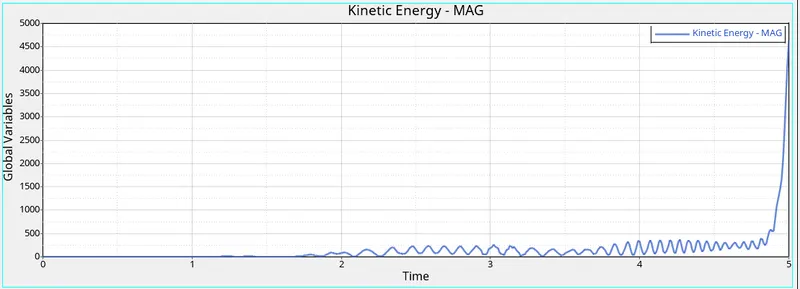
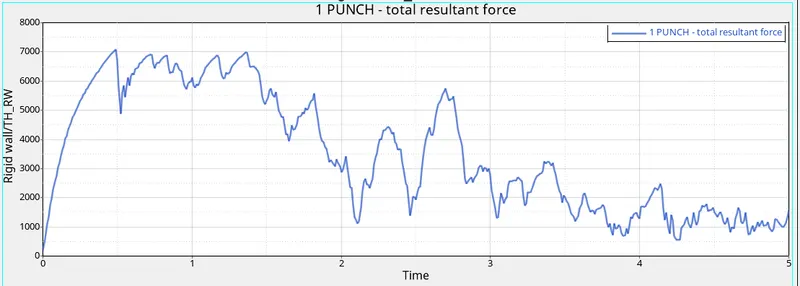
Due to brittle nature, elemts does not yield and resistance force increases very rapidly but as soon as elements breaks the resistance force value decreases again remaining elements accounts for the resistance forces and the cycle continues and as more and more elemts fail the total resistance value go on decreasing.
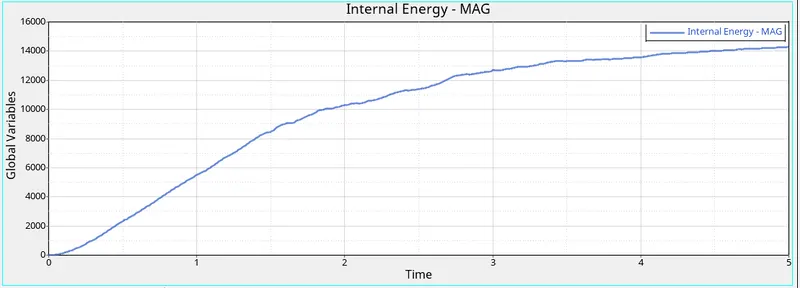
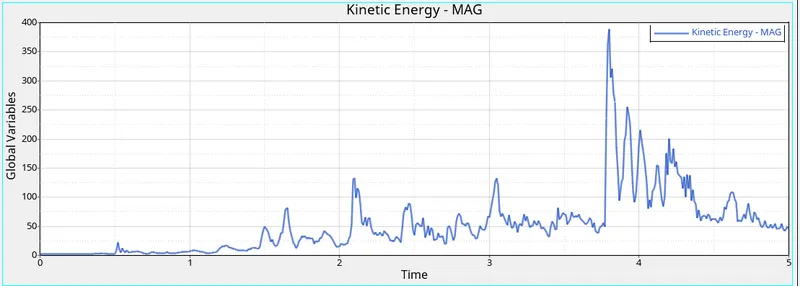
Due to brittle nature and no yielding in the elements, the internal energy increase quite rapidly.
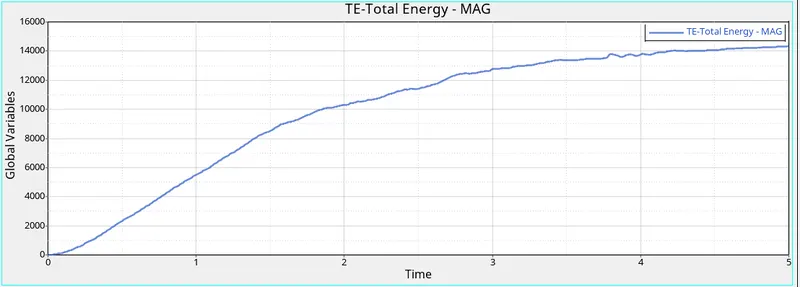
Same is the case with total energy.
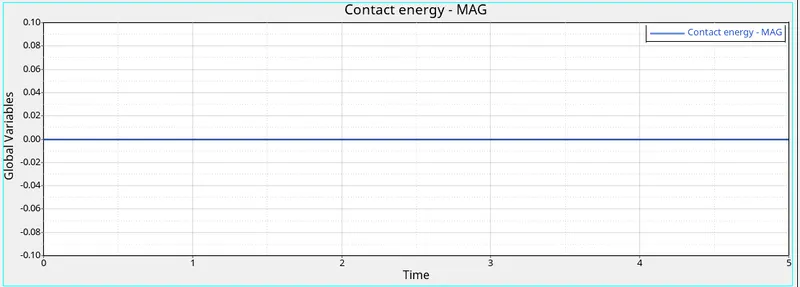
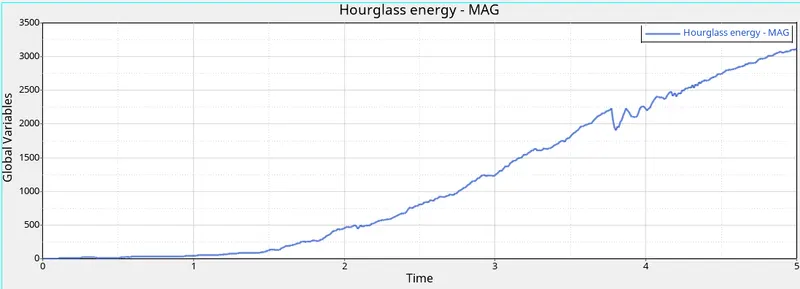
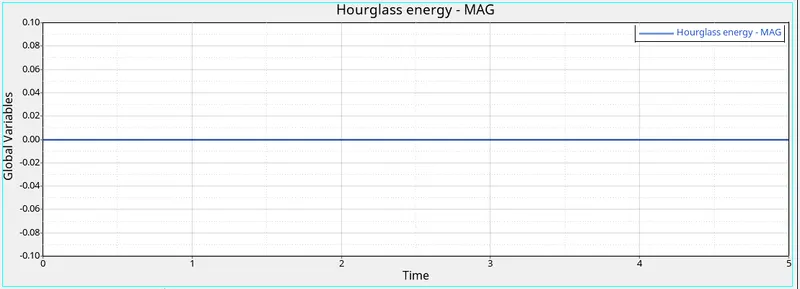
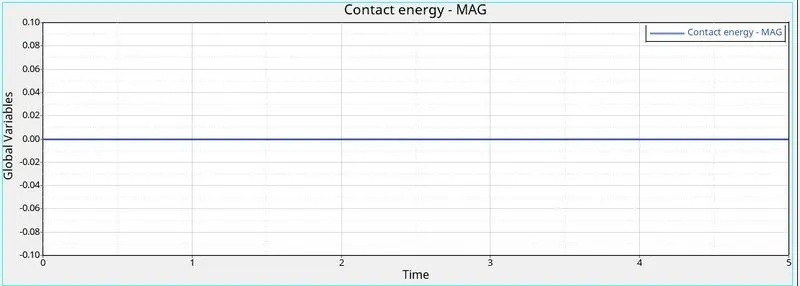
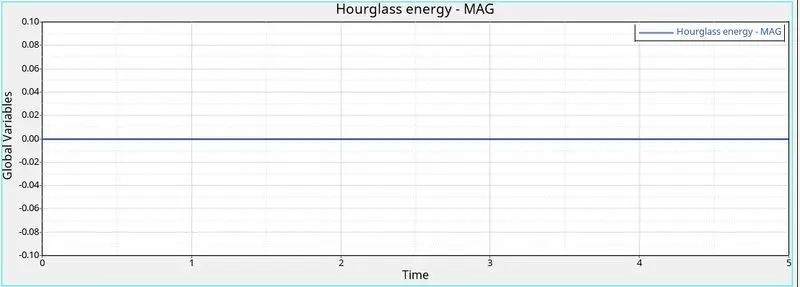
Hourglass energy comes out to be maximum in this material model.
7. Law36_Plast_TAB
As this model considers strain hardening of the material, elements does not start cracking right from the starting of the impact but breaks after work hardening portion of the stress strain curve.
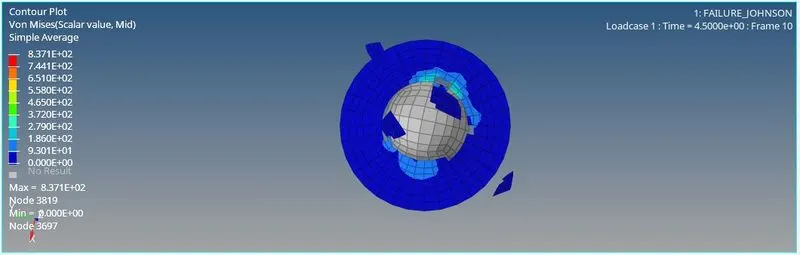
Graphs Plotted
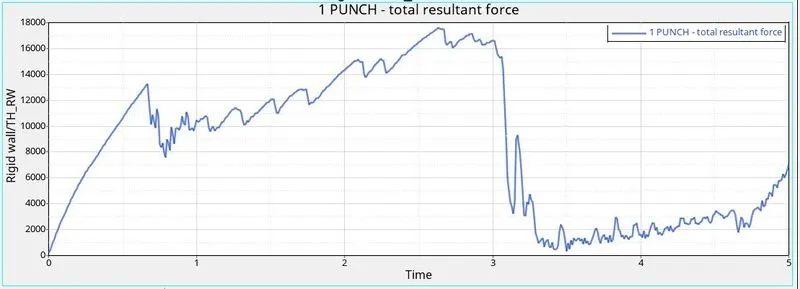
Resistance force increases as the work hardening of the elemtns are considered, as soon as past that stage and elemts break, resisitance forces decreases.
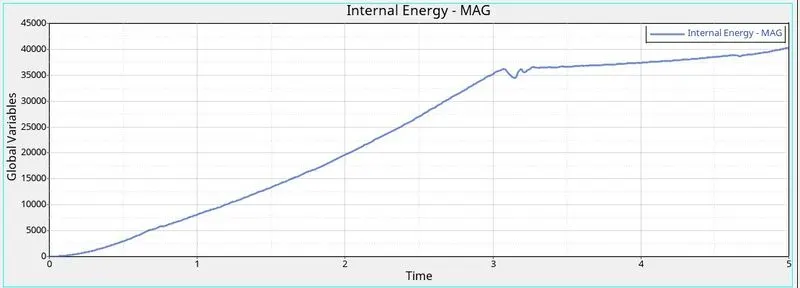
Elements becomes hard and does not yeild, this results in rapid increase in internal enegy.
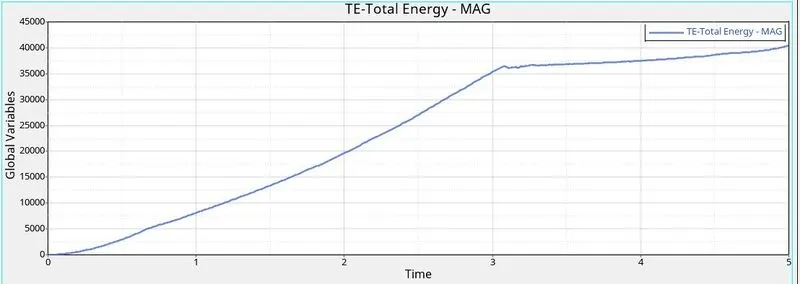
Same is the case with total energy.
Comparision Table:
|
Model |
Total number of cycles |
Energy error (%) |
Mass error (%) |
Simulation time (sec) |
|
Law2_epsmax_failure |
49384 |
1.2 |
0 |
251.29 |
|
Law2_epsmax_crack |
49407 |
5.9 |
0 |
247.26 |
|
Law2_epsmax_nofail |
49405 |
1.2 |
0 |
259.23 |
|
Law2 |
48737 |
3.0 |
0 |
253.57 |
|
Law1_elastic |
47969 |
4.0 |
0 |
248.92 |
|
Law27 |
43176 |
-11.9 |
0 |
221.61 |
|
Law36_PLAST_TAB |
49036 |
-1.4 |
0 |
256.38 |
Most practical:
Considering Aluminium as the material the most practical representation in the field is the Law36_Plat_tab material model because it represents the most practical scenario in which material will get hardened before failing.