Assignment 4-RADIOSS Material Laws Challenge
Objective
Compare 7 cases as discussed on the basis of
1. Total number of cycles, Energy error, mass error and simulation time.
2. Notice the animation of all 5 and describe the animations in brief on the
basis of whether the elements are being deleted or cracked.
3. Plot energies and notice any difference.
4. Based on all the results, which case would represent the on-field
scenario.
5. Prepare a ppt/docx and list down case by case result and your conclusion
as to why the failure happened.
Procedure
CASE 1
1. Import the given model into Hypermesh(RADIOSS).
2. For Case 1 keep the material properties as it is.
3. Run the simualtion (ANALYSIS>>RADIOSS), save the files into a new folder.
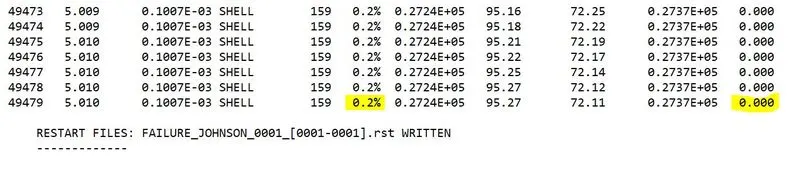
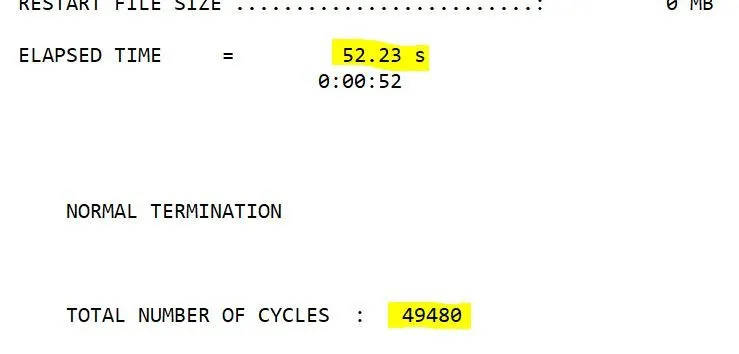
4. Open the 0001.out File and obtain the Mass Error, Energy Error, Number of Cycles and Simulation Time.
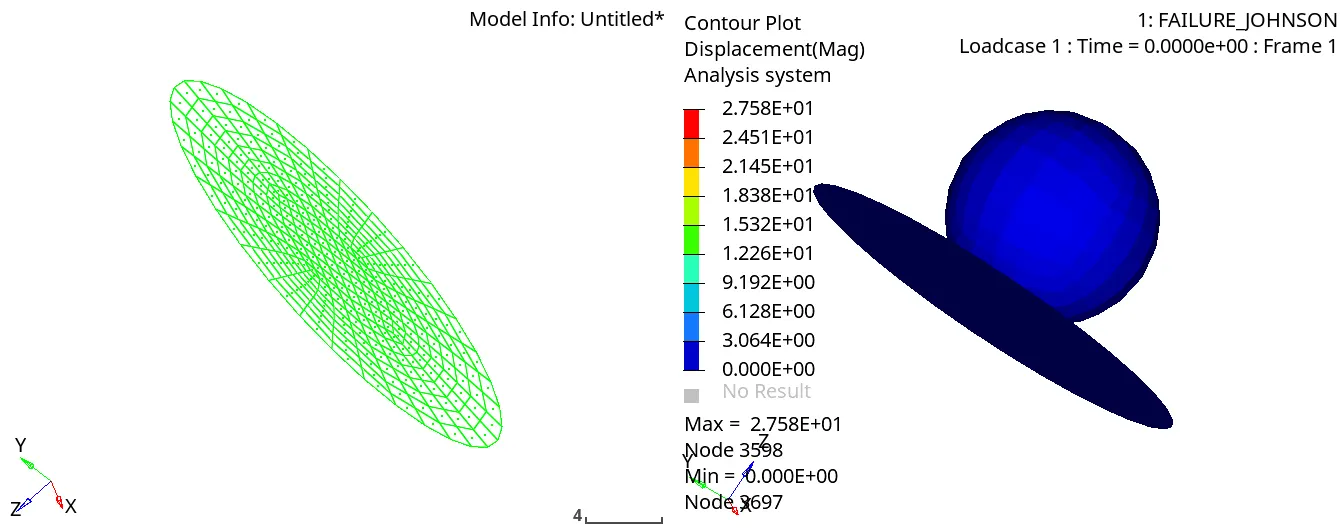
5. Open Hyperview and import .h3d file to get the animation and contour plots for displacement and von mises stress.
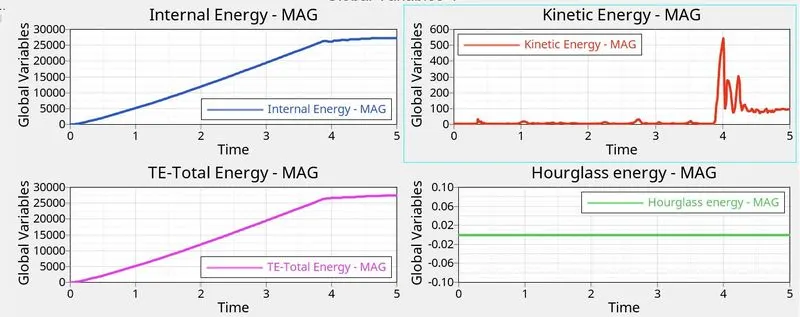
6. Open hypergraph 2d, import the T01 file and plot the graph for Internal Enegry, Kinetic Energy, Total Energy and Hourglass Energy
CASE 2
1. In the failure Johnson model go to the failure card and change
Ifail_sh to 1
Dadv to 1
and
Ixfem to 1
2. Repeat the other steps as in case 1
Energy and Mass error
Energy Error:4.0%
Mass Error: 0.00
Simulation times and cycles.
Simulation time: 59.25
Number of cycles:49397
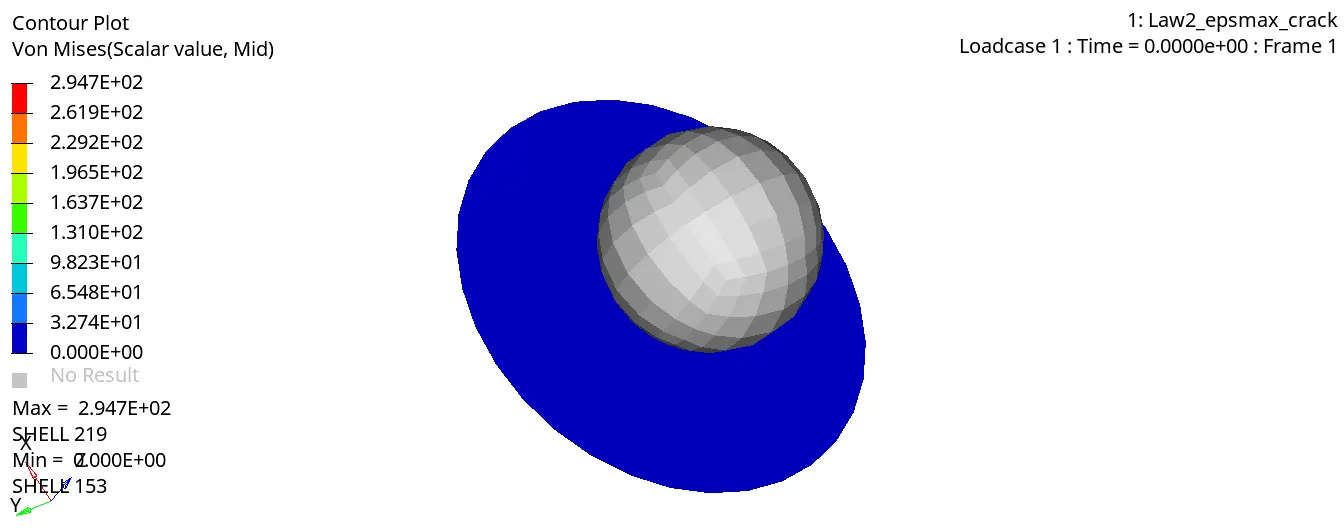
Simulation Animation.
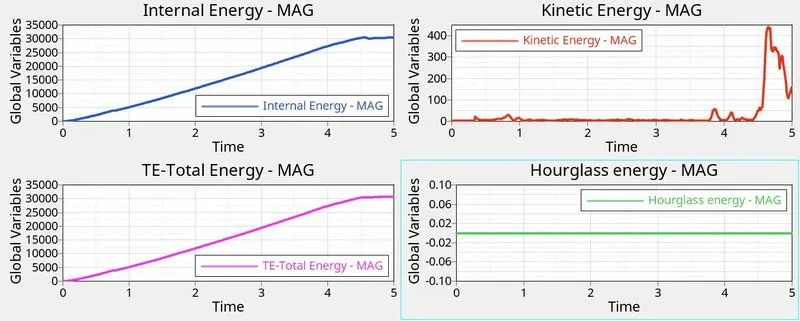
Energy Plots
Case 3
1. Import the same model and delete the failure card from the model tree.
2. Repeat the step as given in case 1 to obtain the errors, animationa and Energy plots.
Energy and Mass error
Energy Error:0.8%%
Mass Error: 0.00
Simulation times and cycles.
Simulation time: 52.80
Number of cycles:49405
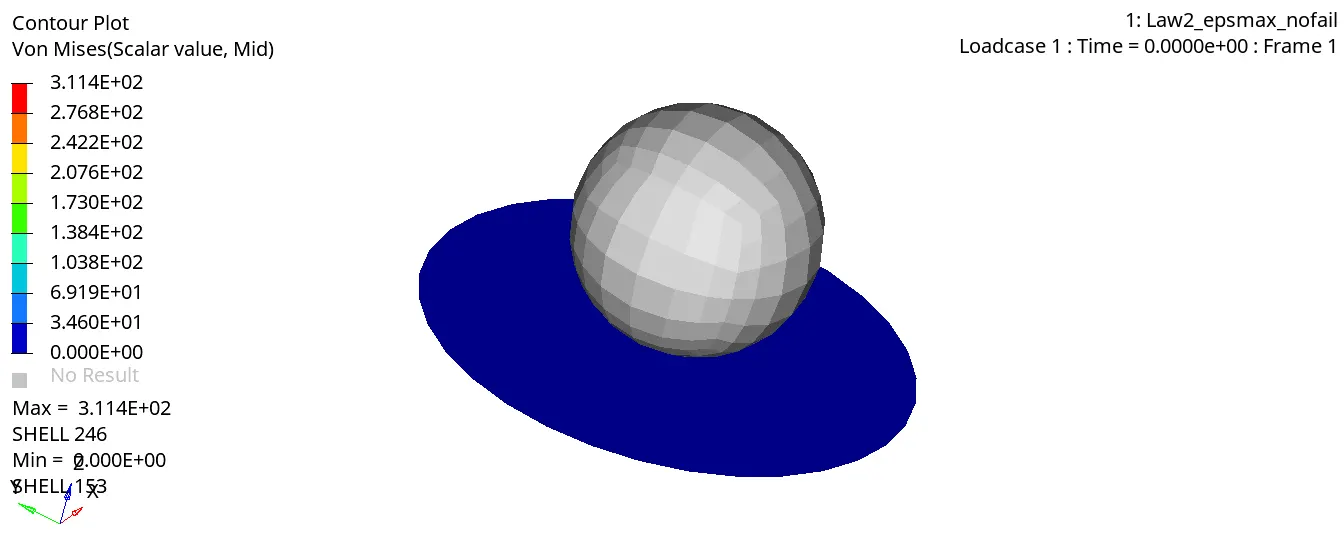
Simulation Animation.
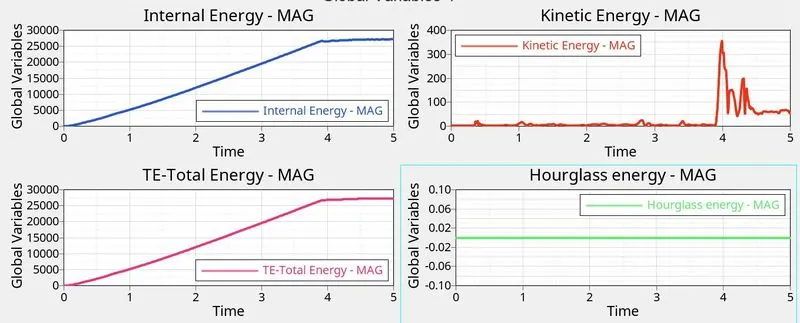
Energy Plots
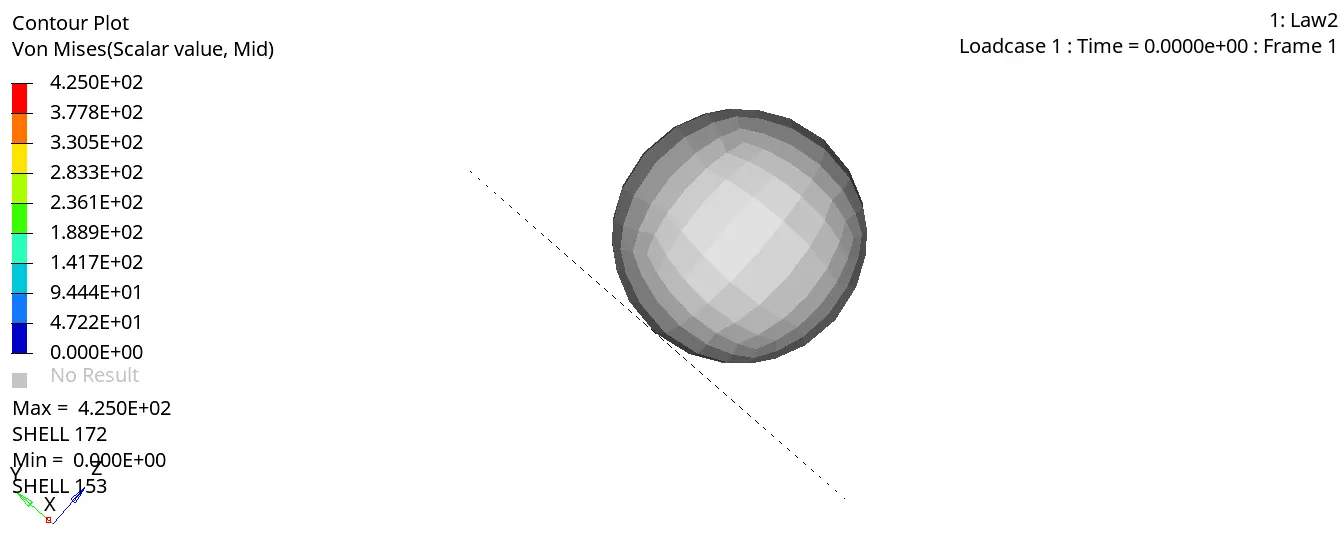
Case 4
1. Import the same model and delete the model of eps_p_max inside the material card.
2. Repeat the step as given in case 1 to obtain the errors, animationa and Energy plots.
Energy and Mass error
Energy Error:3.0%
Mass Error: 0.00
Simulation times and cycles.
Simulation time: 53.08
Number of cycles:48737
Simulation Animation.
Energy Plots
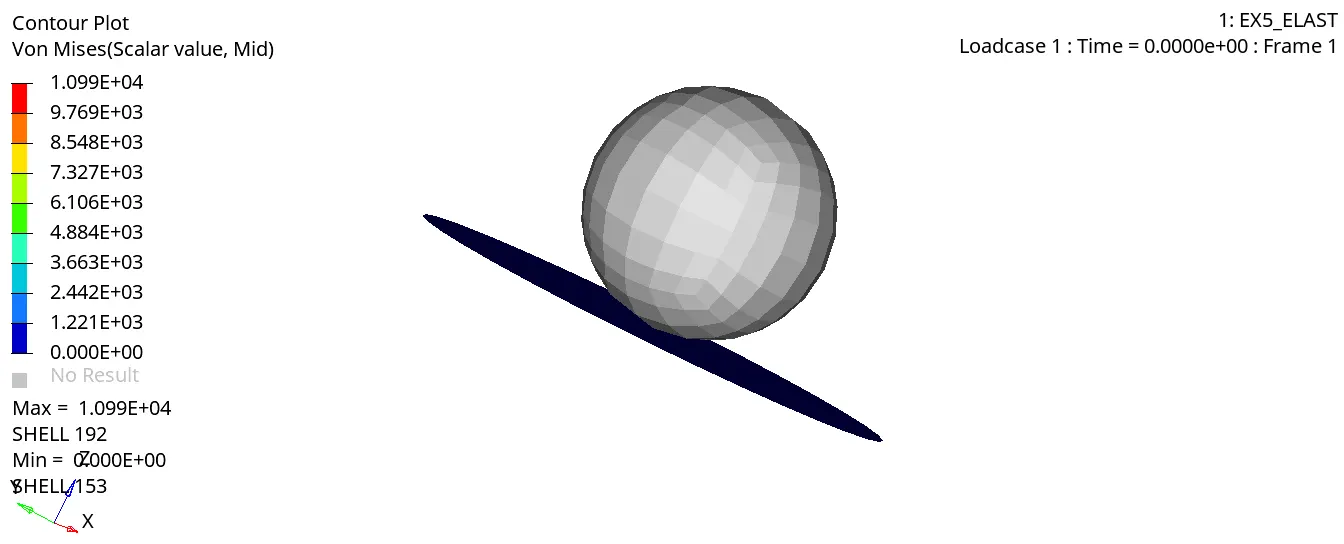
Case 5
1. Import the same model and change the material card to M1_ELAST keeping the value of density, E and nu as sthe same.
2. Repeat the step as given in case 1 to obtain the errors, animationa and Energy plots.
Energy and Mass error
Energy Error:0.3%
Mass Error: 0.00
Simulation times and cycles.
Simulation time: 50.12
Number of cycles:47969
Simulation Animation.
Energy Plots
Case 6
1. Import the model LAW27_000.rad and run the simulation as is it is.
2. Repeat the step as given in case 1 to obtain the errors, animationa and Energy plots.
Energy and Mass error
Energy Error:-4.4%
Mass Error: 0.00
Simulation times and cycles.
Simulation time: 43.73
Number of cycles:41855
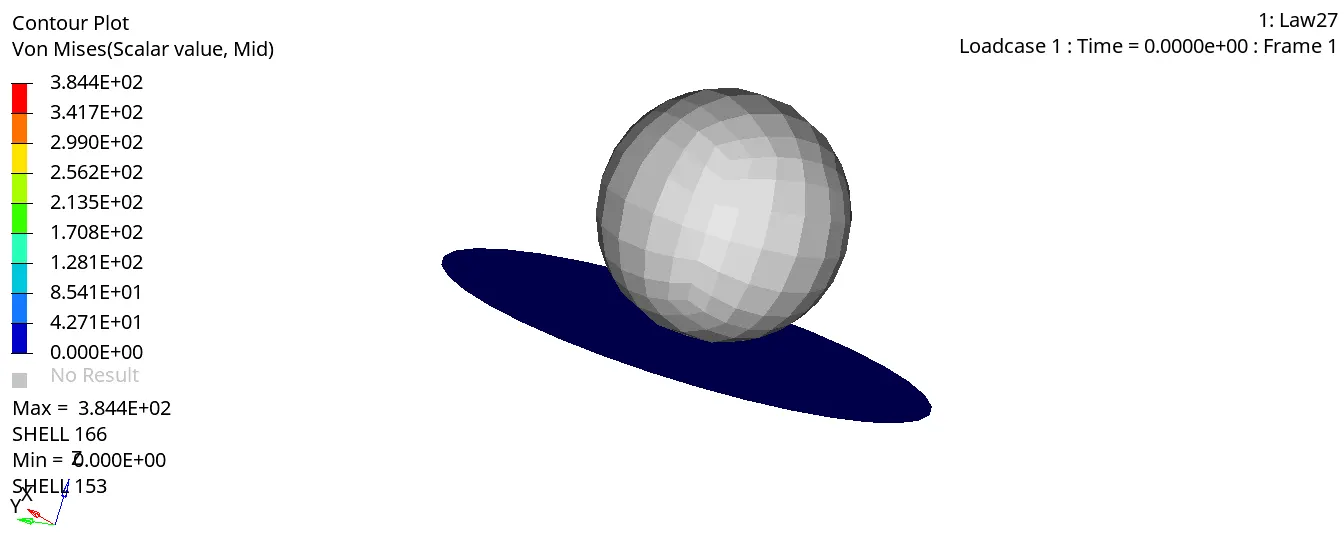
Simulation Animation.
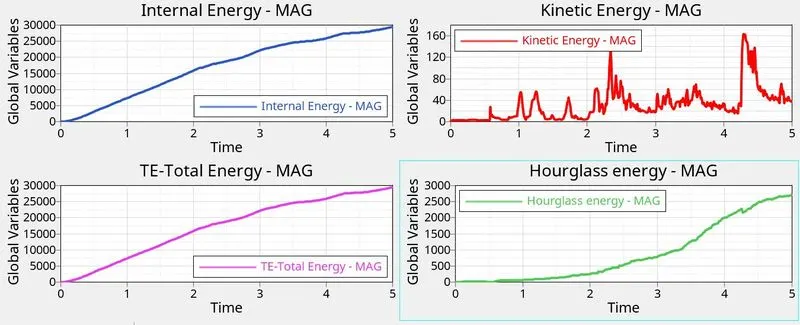
Energy Plots
Case 7
1. Import the Failure_johnsonn model
2. Change the Material card image to PLAST_TAB
3. Create a new curve for user defined function
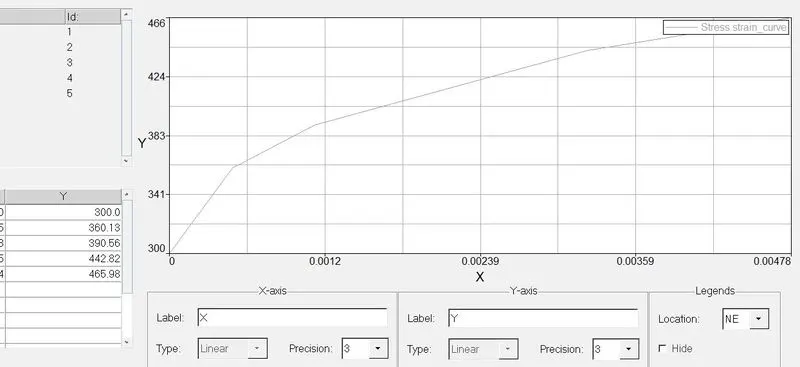
4. Assign the curve to the material card.
5. Repeat the step as given in case 1 to obtain the errors, animationa and Energy plots.
Energy and Mass error
Energy Error:4.0%
Mass Error: 0.00
Simulation times and cycles.
Simulation time: 57.08
Number of cycles:53181
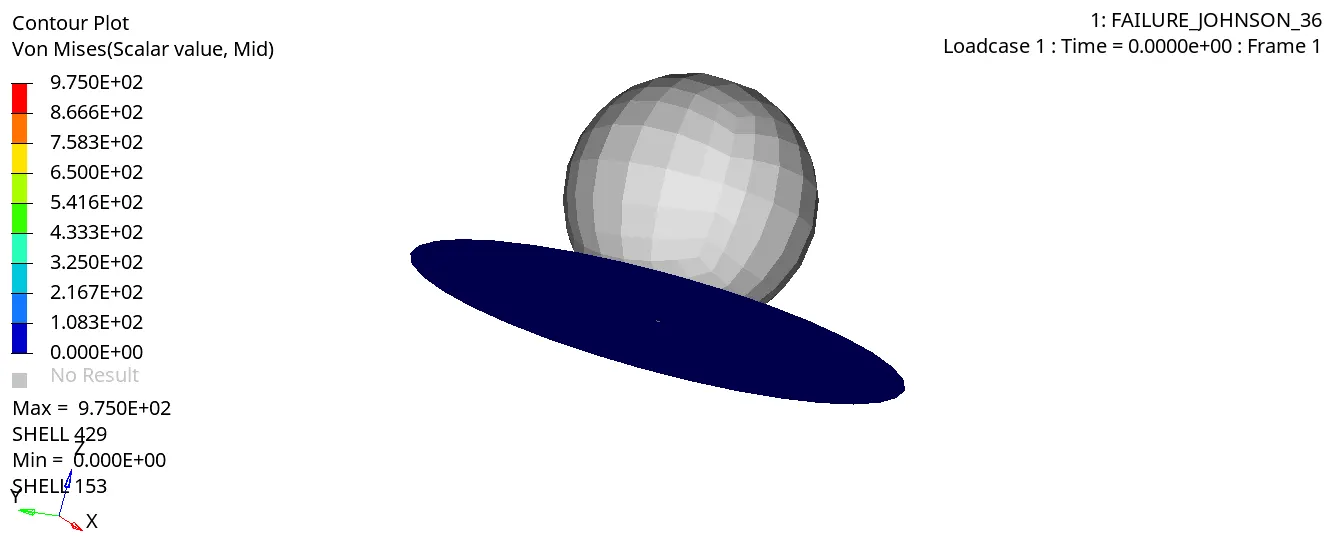
Simulation Animation.
Energy Plots
Results
Total number of cycles, Energy error, mass error and simulation time.
| Case 1 | Case 2 | Case 3 | Case 4 | Case 5 | Case 6 | Case 7 | |
| Energy Error | 0.2% | 4.0% | 0.8% | 3.0% | 0.3% | -4.4% | -1.2% |
| Mass Error | 0 | 0 | 0 | 0 | 0 | 0 | 0 |
| Simulation Time | 52.23 | 59.25 | 52.80 | 53.08 | 50.12 | 43.73 | 57.08 |
| No. of Cycles | 49480 | 49397 | 49405 | 48737 | 47969 | 41855 | 53181 |
| Crack/Delete | Delete | Crack Then Deleted | Deleted | Neither | Neither | Crack Then Deleted | Crack Then Deleted |
Energy plots
Case 1
The Internal, Total and Kinetic energy reaches peak value arpond 3.9 ms just before the elments start getting deleted.
Case 2
The Internal, Total and Kinetic energy reaches peak value arpond 4.6 ms which is slightly later as element deletion starts after crack propogation.
Case 3
The plot is very similar to plot in case 1
Case 4
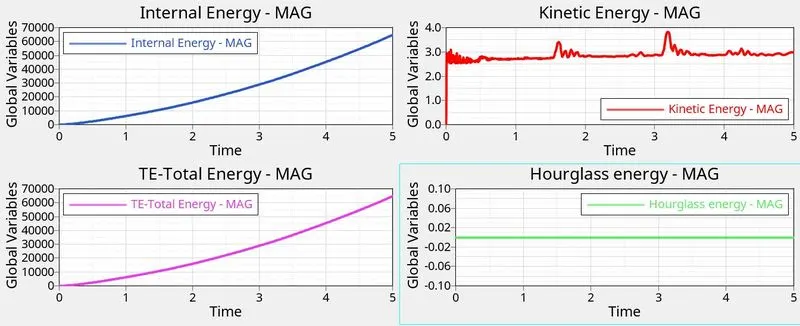
The Eps-max value is deleted that means thr failure plastic strain is infinite. therefore the stain keeps increasing and so does the internal and total energy.
Case 5
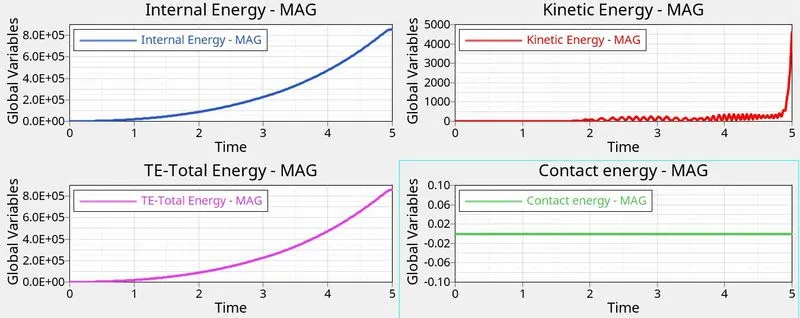
The Energy plots are similar to Case 4 except that kinetic energy varies more smoothly due to elastic material model.
Case 6
The variaton of internal and total energy is almost linear.
The houirglass energy is neither 0 nor constant, therefore energy error is maximum.
Case 7
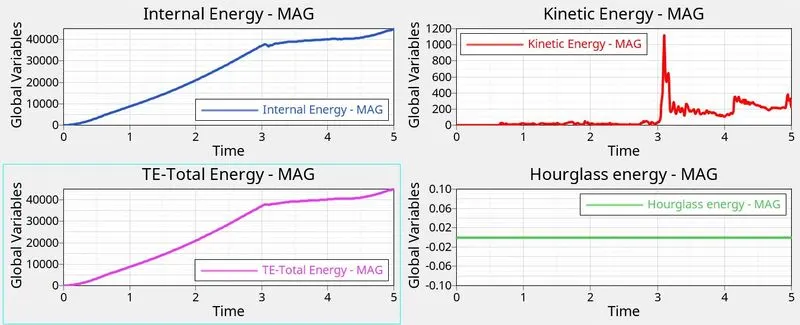
Energy dissipation is linear up to 3ms and than starts fluctuating as cracking and deletion of elements starts for the same reason the kinetic energy peaks at 3 ms.
Which case would represent the on-field scenario?
The 7th case (Law 36) seems the most appropriate for on field scenario when appropriate data is available as it incorporates elastoplastic law with strain hardening to give most accurate results.
Learning Outcome
Different material model were used for simulation and animations and energy plots were generated.
Differnt material moels were evaluated in terms of simulation time and result outcome.