Assignment 4-RADIOSS Material Laws Challenge
RADIOSS Material Laws Challenge
Aim:
Perform the simulation as per the cases given below.
Case 1
- Import the FAILURE_JOHNSON_0000.rad file and run the model as it is. Give the title name as Law2_epsmax_failure.
Case 2
- Import the case 1 rad file, named “Law2_epsmax_failure” and perform the simulation with failure plastic strain (EPS_p_max) and fail_Johson card enabled.
- Changes to be made in /FAIL/JOHNSON card:
- ifail_sh= 1
- Dadv= 1
- Ixfem= 1
- Use the recommended values for the property card.
- Give the title name as Law2_epsmax_crack.
Case 3
- Import the case 2 rad file, named “Law2_epsmax_crack” and perform the simulation by removing the fail_Johnson failure card. Give the title name as Law2_epsmax_nofail.
Case 4
- Import the case 3 rad file, named “Law2_epsmax_nofail” and perform the simulation by removing both the failure plastic strain (EPS_p_max) and the fail_Jhonson failure card.
Case 5
- Import the case 4 rad file and perform the simulation by changing the material card to Law 1. Keep the same value for rho, E, and nu values.
Case 6
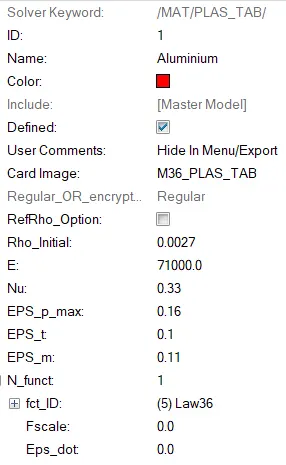
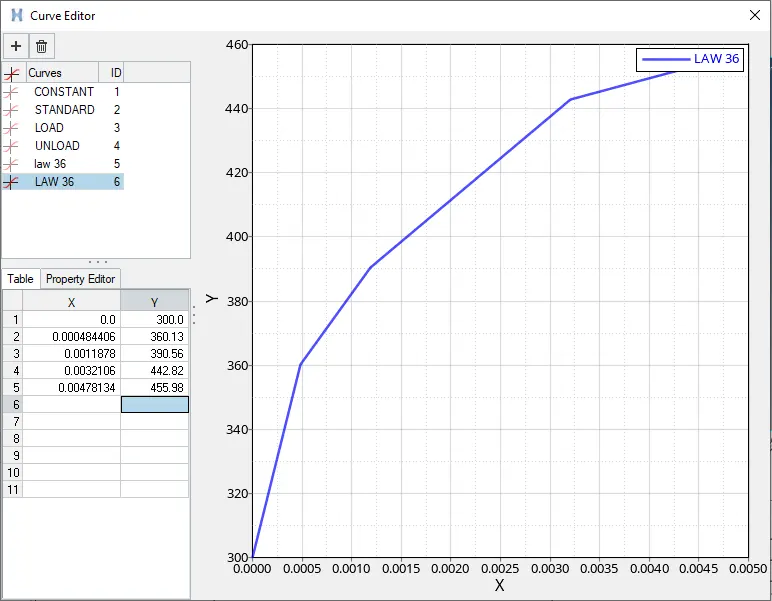
- Import the case 1 rad file, named “Law2_epsmax_failure” and perform the simulation with the law 36 material card. Refer to the video titled "Materials 7" for further information.
Case 7
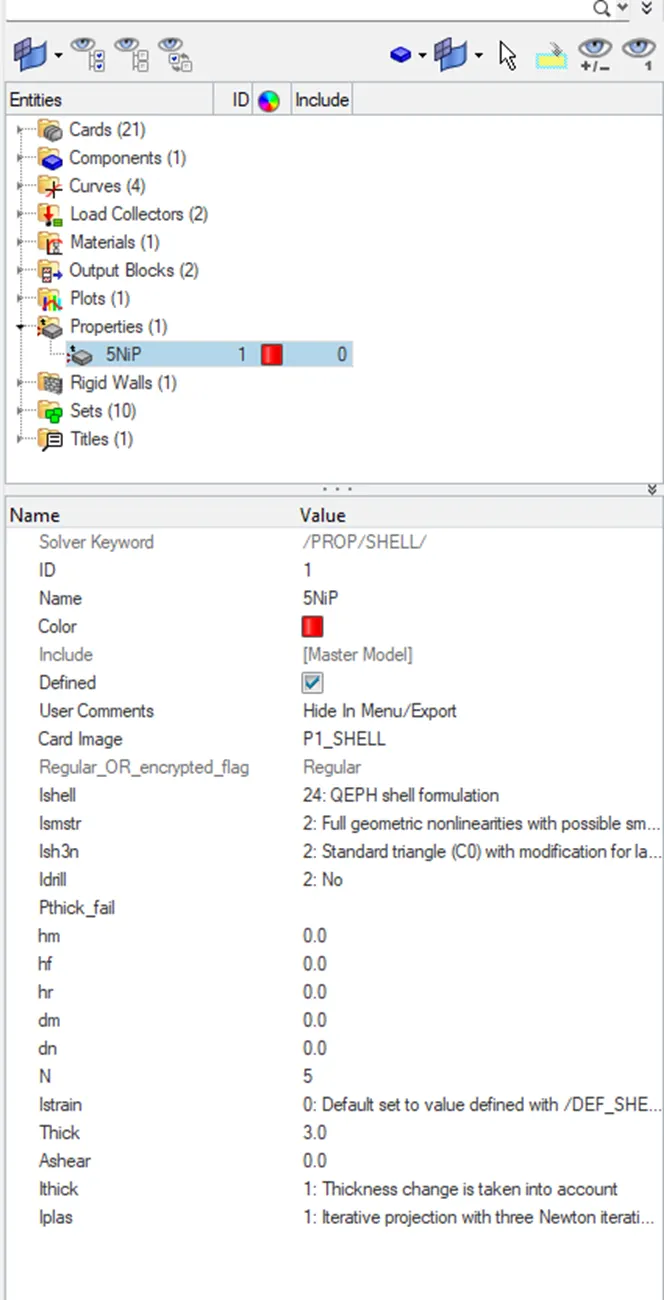
- Open the Law27_0000.rad file and perform the simulation with the law 27 material card. Use the recommended shell properties.
Compare 7 cases as discussed in the last 3 slides, in a tabulated format based on:
1. The Total number of cycles, Energy error, mass error, and simulation time.
2. Notice the animation of all 5 and describe the animations in brief based on whether the elements are being deleted or cracked.
3. Plot energies and notice any difference.
4. Based on all the results, which case would represent the on-field scenario.
5. Prepare a ppt/Docx and list down case by case results and your conclusion as to why the failure happened.
Solution :
Theory:
The material picked determines how accurate the simulation will be.When running a simulation, it is crucial to select the appropriate material and supply accurate material data.Concrete, foam, rubber, composites, and other materials, among others, are among the numerous material properties and libraries offered by RADIOSS.
some Material laws are given below
- Law 1: Elastic (Isotropic Elasticity)
- Law 2: Johnson-cook (Isotropic Elasto-plastic)
- Law 27: Elastic-plastic brittle
- Law 36: Elastic-plastic tabulated
- Law 42: Ogden (visco hyperelastic)
- Law 70: Foam
Isotropic Elasticity - Law 1
A substance will have the same physical characteristics in all three directions if it is isotropic. RADIOSS offers two varieties of elasticity under isotropic elasticity.Straight elastic: elastic LAW1,LAW69 is hyperelastic. Hyperelastic tabulated, LAW82 Ogden
The Hook's Law of Elasticity, which states that there is a linear relationship between stress and starch, is followed by the RADIOSS Elasticity Law.
It is offered for elements such as truss, beam, shell, and solid.It is only for elastic materials, as was before explained.Poisson's ratio and Young's modules of elasticity (E) determine the material stiffness (n).
The sheer modulus G is calculated by G=E/2(1+V)
Isotropic Elasto-Plastic-law 2
Different kinds of elasto-plastic material laws are offered by RADIOSS. It includes all of the material models based on von Mises hardening with and without ductile damage, as well as von Mises hardening with visco-plastic flow.Here, we'll examine Johnson-cook/JOHNS and piecewise linear tabulated/PLAS TAB.
(PLAS_JOHNS) Johnson-cook material- Law 2
The johnson-cook material model is used to represent an isotropic elasto-plastic material using this law.According to the model, material stress is a function of temperature, strain, and strain rate.We have an option in the material card called EPS max, which is simply plastic strain at failure. When one integration point reaches EPS max, the element fails.Now, if EPS max is the only criterion for success, there may be times when it produces erroneous results. The /FAIL/JOHN card gives the user additional control over the failure of the johnson-cook strain, allowing us to prevent this.
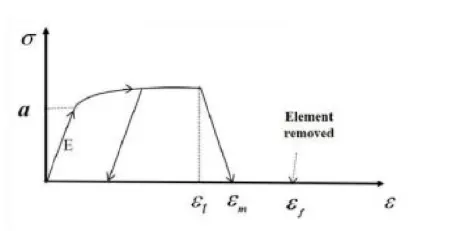
LAW36-PLAS_TAB Elastic plastic piecewise linear material
The work hardening section of the stress-strain curve for various strain rates can be modelled using user-defined functions according to the LAW36 material law for isotropic elasto-plastic materials.The stress-strain curve following the yield point is the only curve that is specified. It is zero to set the yield point.Both brick and shell elements are covered by this material legislation.If the user specifies the work hardening portion, the elastic portion is derived using the young's modulus and poisson's ratio inputs.There can be defined any number of stress-strain curves.The requirement that the strain rate curves not cross each other is crucial.
Procedure:
case1:Open Hyper mesh, go to >> import >> solver deck option >> browse File > Import. The “FAILURE_JOHNSON_0000.rad” file is selected and “import"
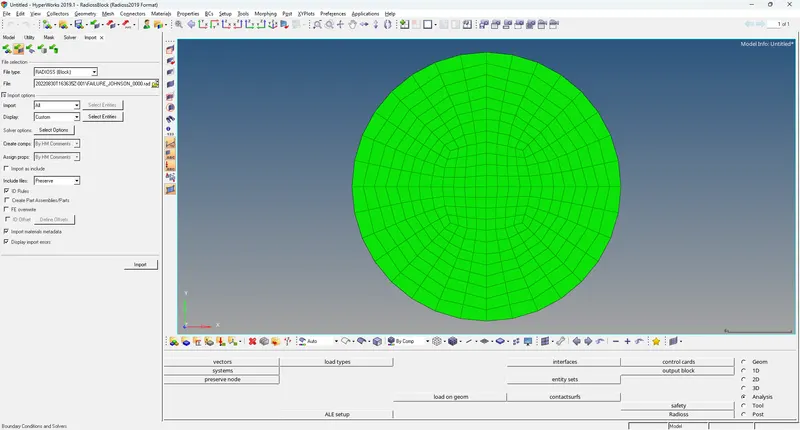
We can check units using the begin card. In this base simulation, we will run the simulation with the default values. Therefore don’t change any values.
To run the simulation, Go to Analysis >> Radioss. We need to save the output files in a new folder so that we can access them easily. The file is saved as "Law2_epsmax_failure_0000.rad". After saving, tick the 'include connectors' box and type in '-nt 4' in the options text box as shown below, before clicking 'Radioss'It is recommended to be written as "-nt 4" . This means assigning the task to 4 cores in the system, to perform the simulation faster. It depends upon the process of our computer (it has a quad-core processor, then it should be taken as 4. If the system has an octa-core processor, then it is taken as 4). And "nt" means "number of threads". Then click on "Radioss", in order to run the simulation i am taken number of threads as 8.Befor clickinh RADIOSS save the file in a separate folder eg:case1

Now that the simulation is finished, all that is left to do is visualise it. We must switch to the Hyperview tool for that.After logging in, we must enter the simulation file. Use the h3d file that RADIOSS produced after processing the starting file for this. It is produced in the files that are depicted in the image above. We can choose it and then click "apply."We are prompted to enter the simulation file after gaining access to Hyperview. We will use the Law2 epsmax failure.h3d file that was produced when RADIOSS processed the beginning file for this. It must to be produced in the identical folder. We can select that and then choose "apply." By doing so, the simulation animation is produced.
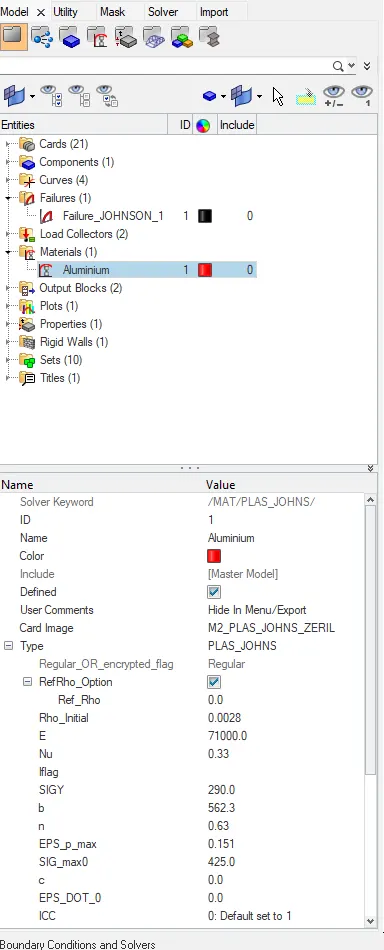
First I open M2_PLAS_JOHNS_ZERIL_0000.rad file into Notepad and check the material Properties.
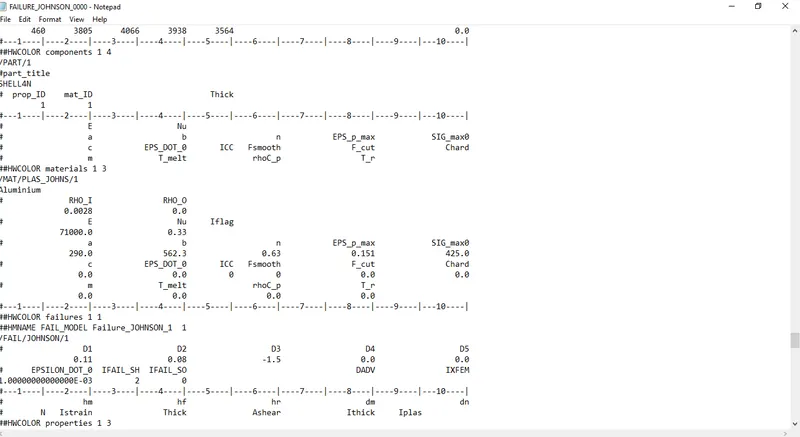
Open file in Notepad 'M2_PLAS_JOHNS_ZERIL_0001.out
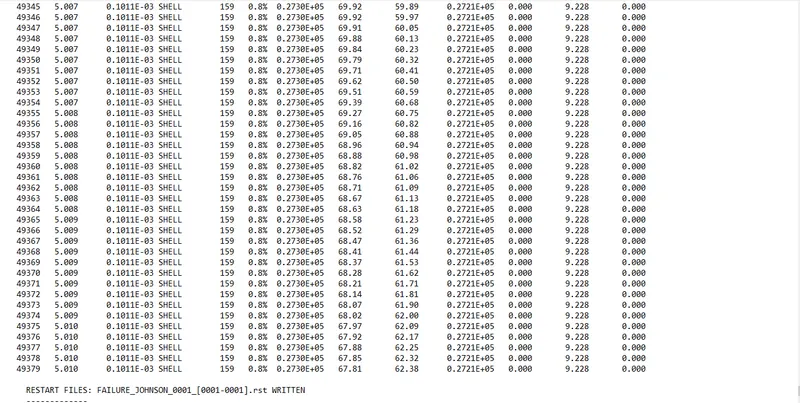
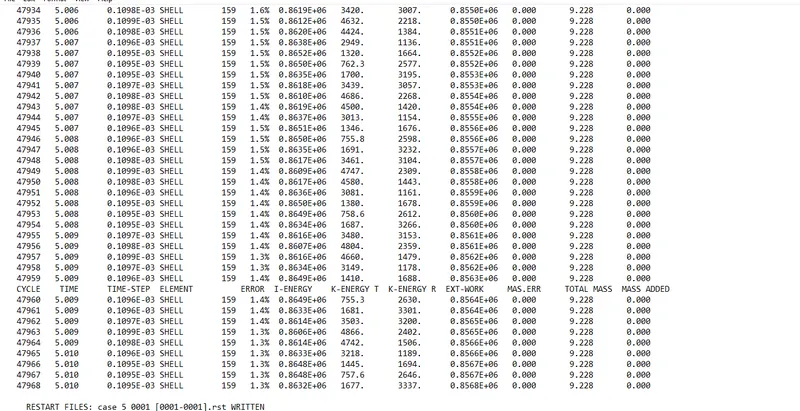
Maximum energy error in this base simulation case is 0.8% , Energy error is acceptable up to 15%
Maximum mass error is 0.000 so simulation is correct
Displacement point of view
In geometry, displacement is a vector whose length is the shortest separation between a moving point P's initial and final positions. It calculates the length and angle of the net motion, or total motion, in a straight line from the starting point to the destination of the point trajectory. The translation that links the starting point and the ending point can be used to spot a displacement.As the final position xf of a point relative to its beginning position xi, a displacement can alternatively be described as a relative position as a result of motion. The difference between the end and beginning positions can be used to define the equivalent displacement vector

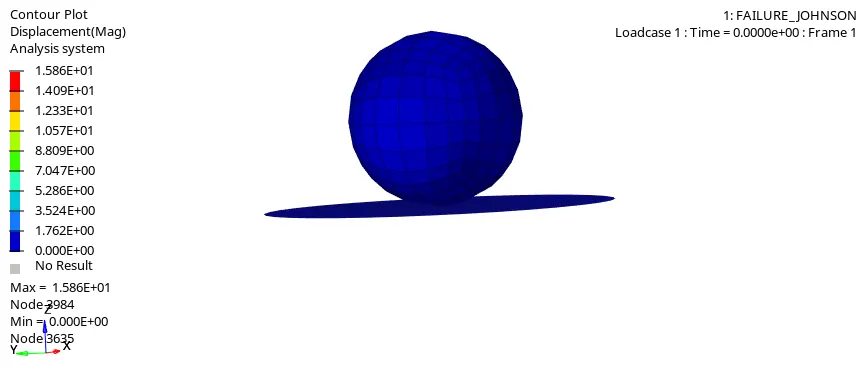
MAX Displacement:1.881e+01
MIN Displacement:0.000e+00
Von Mises yield Criterion point of view:
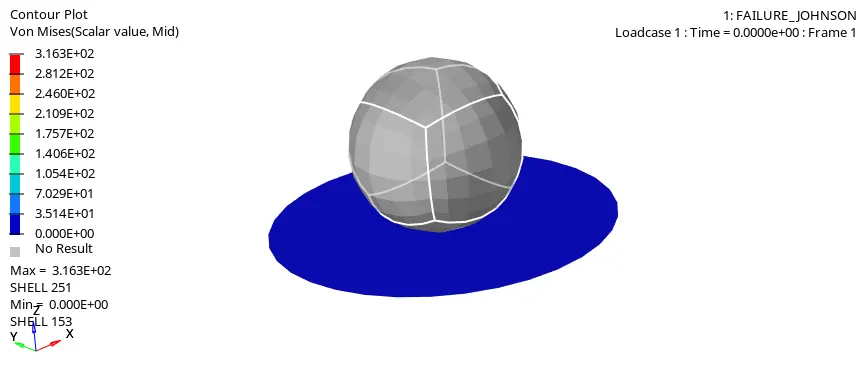
According to the von Mises yield criterion, which is often referred to as the maximum distortion energy criterion[1], ductile materials start to give when the second deviatoric stress invariant hits a critical level. [2] Plasticity theory includes this idea, and it works best with ductile materials like some metals. Prior to yield, it is reasonable to anticipate that the material will respond with either a linear elastic, viscoelastic, or nonlinear elastic behaviour
Velocity point of view:
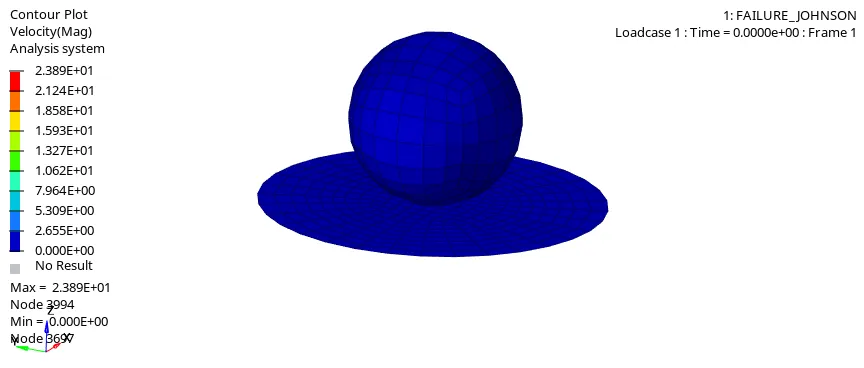
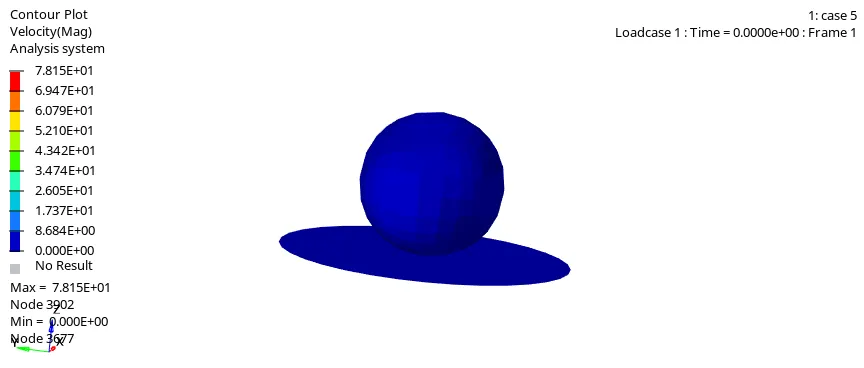
A vector measurement of the rate and direction of motion is what is meant by the term "velocity." Simply put, velocity is the rate of movement in a certain direction. Examples include the speed of a car moving north on a major highway or the speed of a rocket as it takes off for space. The velocity vector's scalar (absolute value) magnitude represents the motion's speed. The first derivative of position with respect to time is known as velocity in calculus. There is a straightforward formula that employs rate, distance, and time to calculate velocity.
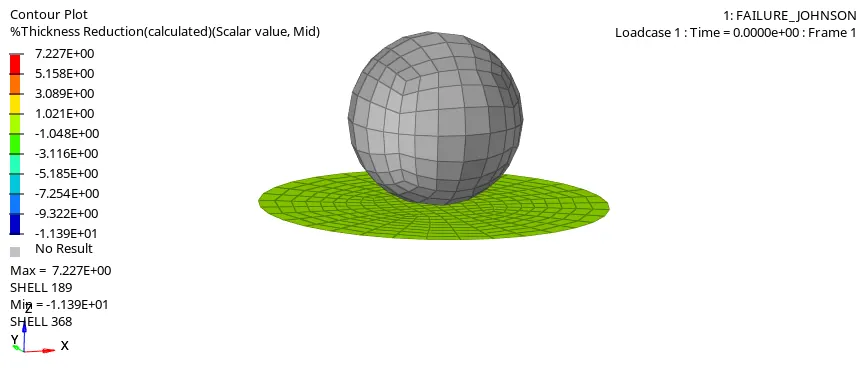
% Thickness Reduction Point of view
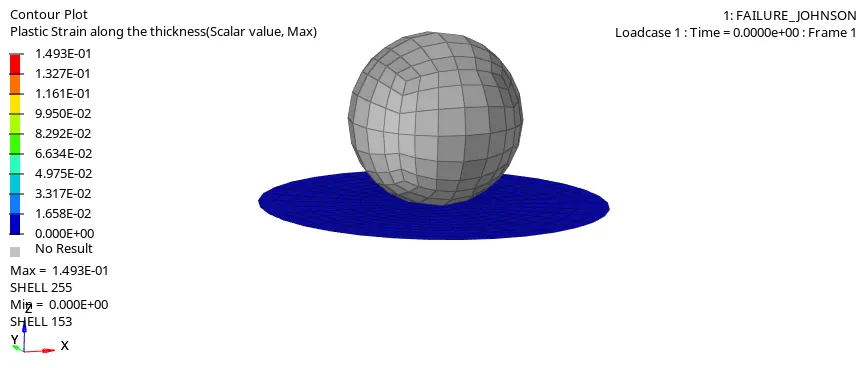
Plastic Strain along the thickness point of view
Graphs:
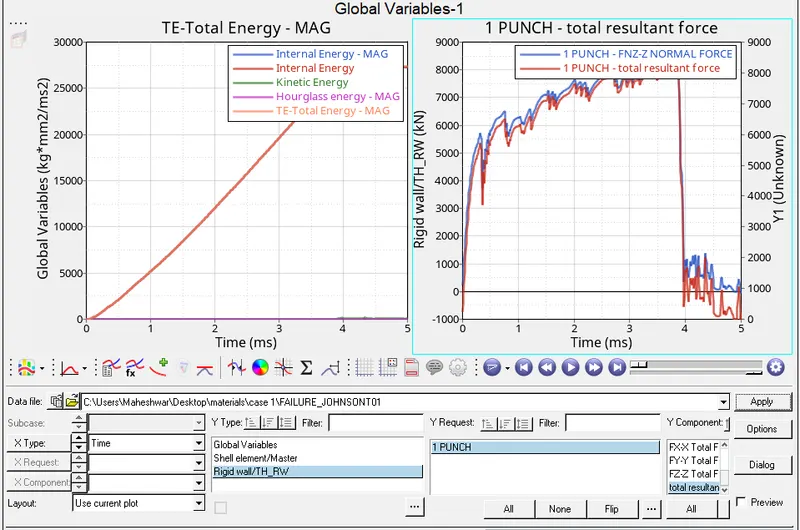
1 - Internal Energy, Kinetic Energy, Contact Energy, Hourglass Energy and Total Energy
2 Total Resultant Force Vs Normal Force
CASE-2
In this case, a few parameters are added to the defined case 1to visualize checking or braking down of elements with the help of 'Ixfem' option in Fail-Johnson failure model card. The necessary changes were made in the parameters as follows,
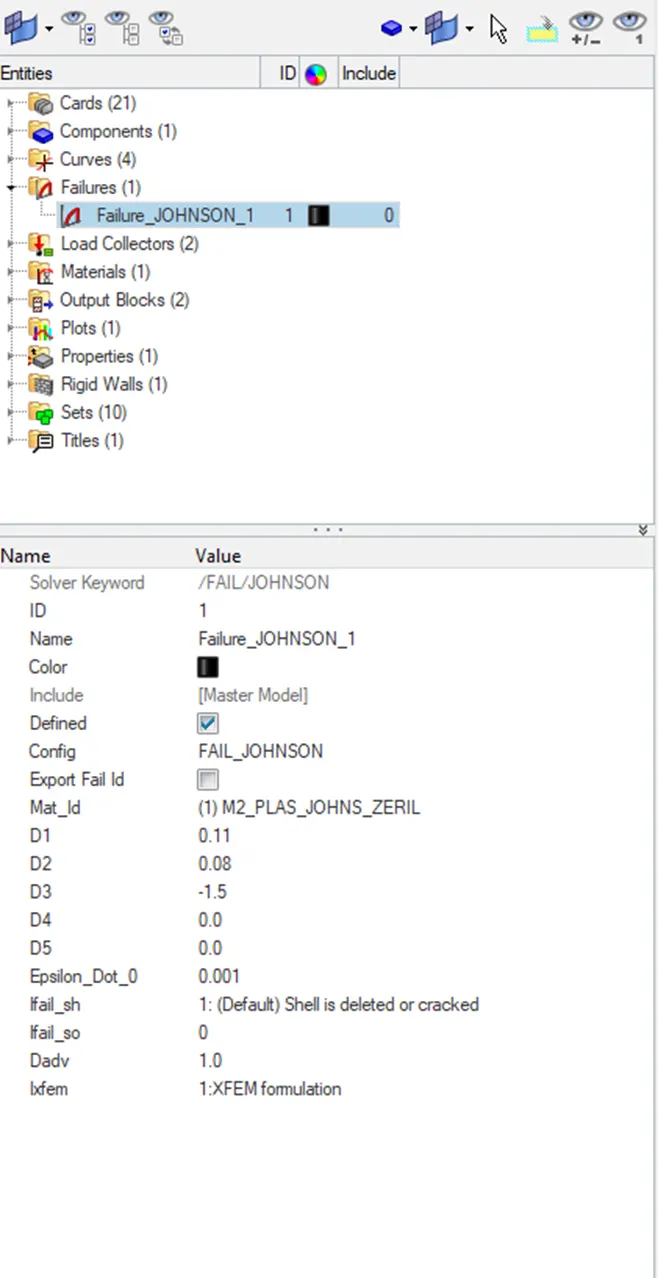
file open in notepad as mentioned above
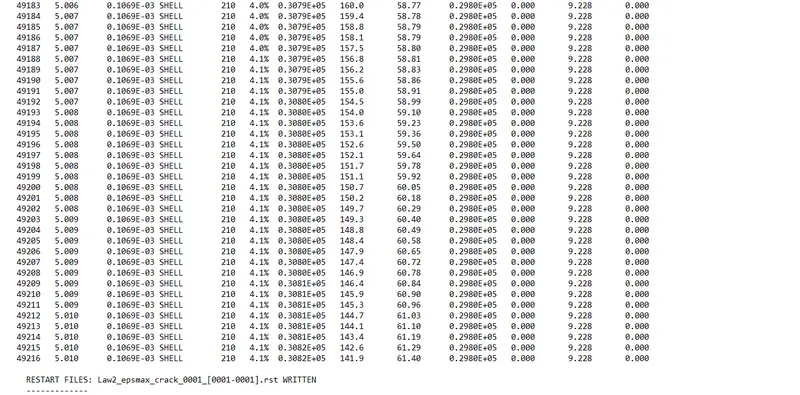
Maximum energy error in this base simulation case is 4.1% , Energy error is acceptable up to 15%
Maximum mass error is 0.000 so simulation is correct
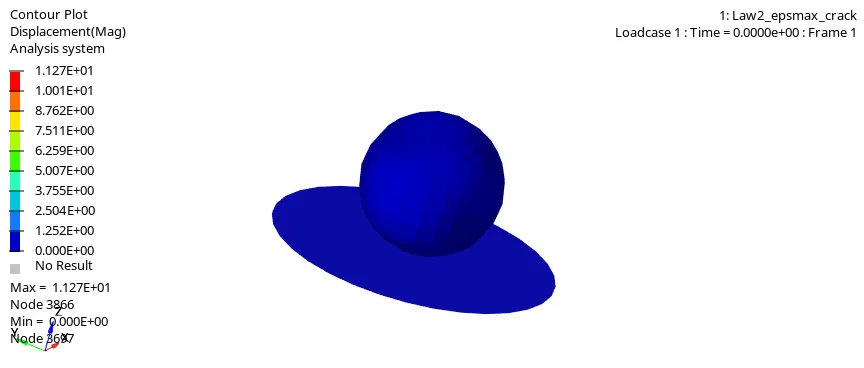
Displacement point of view
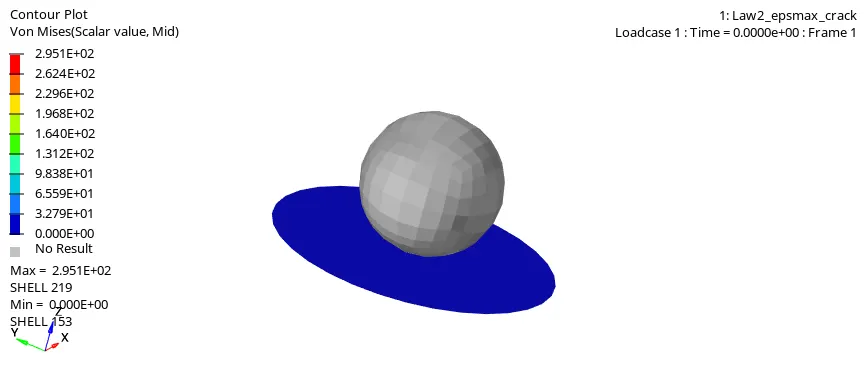
Von Mises yield Criterion point of view:
Velocity point of view:
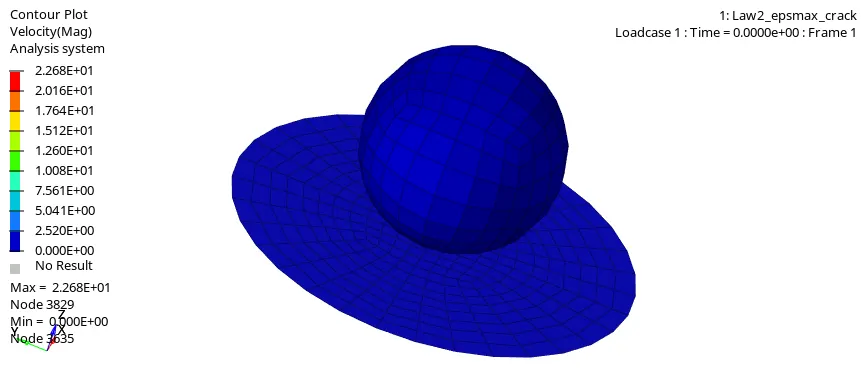
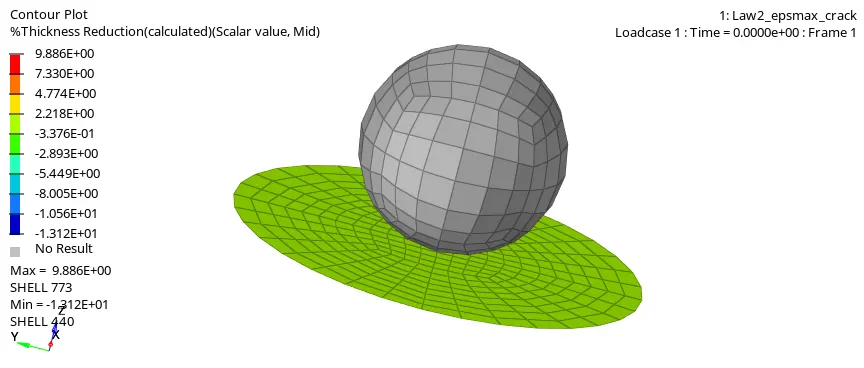
% Thickness Reduction Point of view
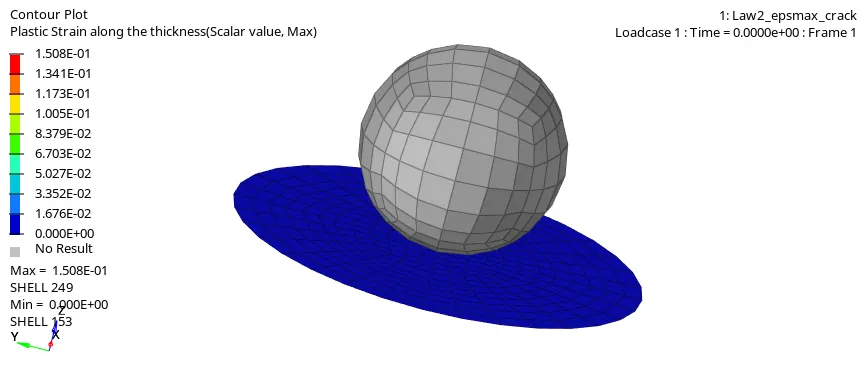
Plastic Strain along the thickness point of view
Graphs:
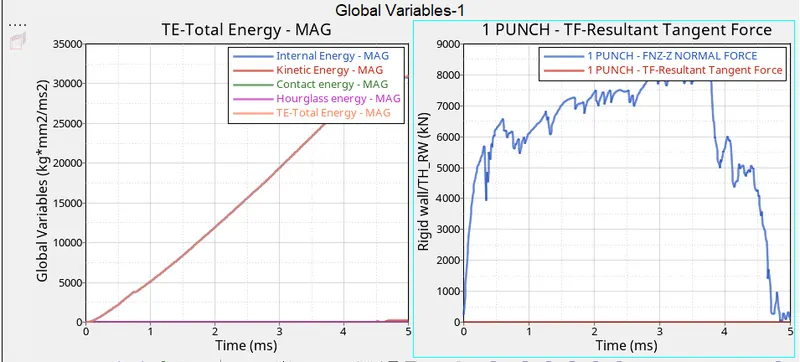
1 - Internal Energy, Kinetic Energy, Contact Energy, Hourglass Energy and Total Energy
2 Total Resultant Force Vs Normal Force
CASE-3
In this case, the material model is same in case elastoplastic but the failure model card s removed to look for any difference in results. Hence, the Plas-Johnson card has deleted and the simulation was done, As we know the law material model is not capable of simulation compression under forces with realistic results. Plas-Johnson card is recommended addition.
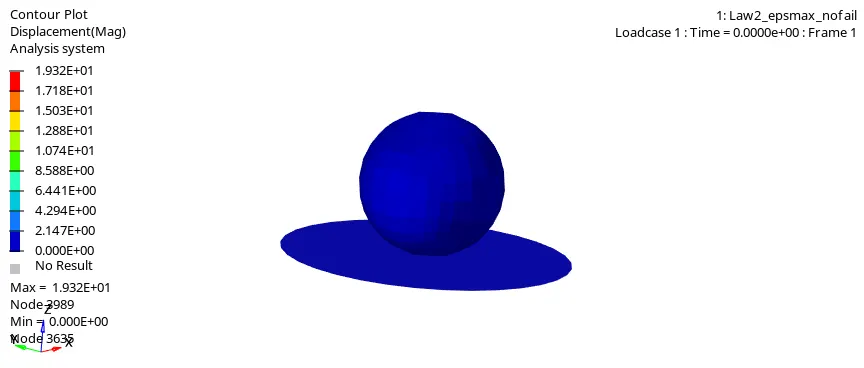
Displacement point of view:
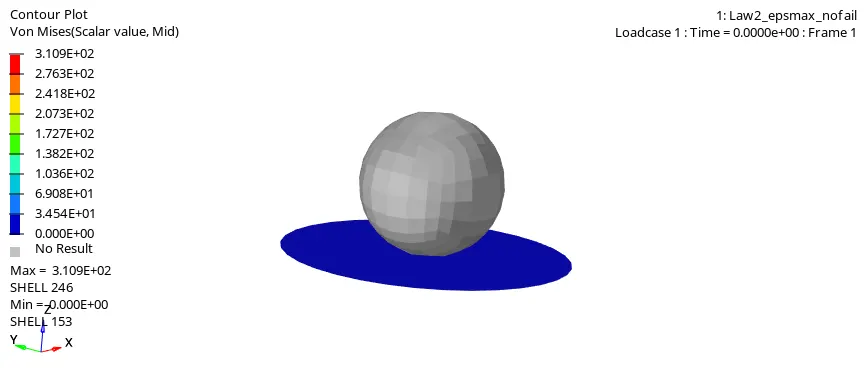
Von Mises yield Criterion point of view:
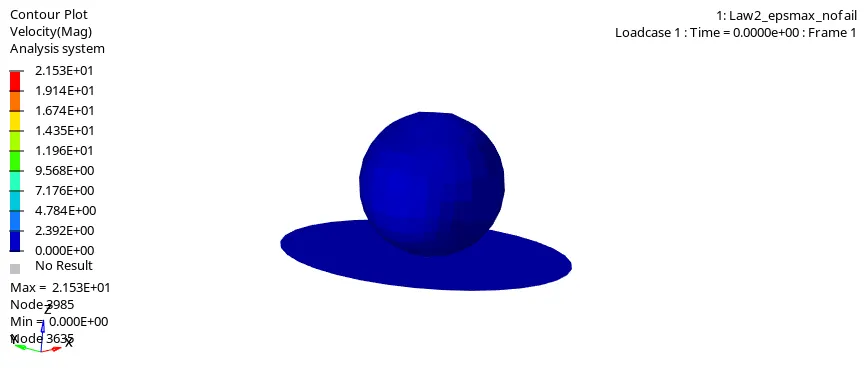
Velocity point of view:
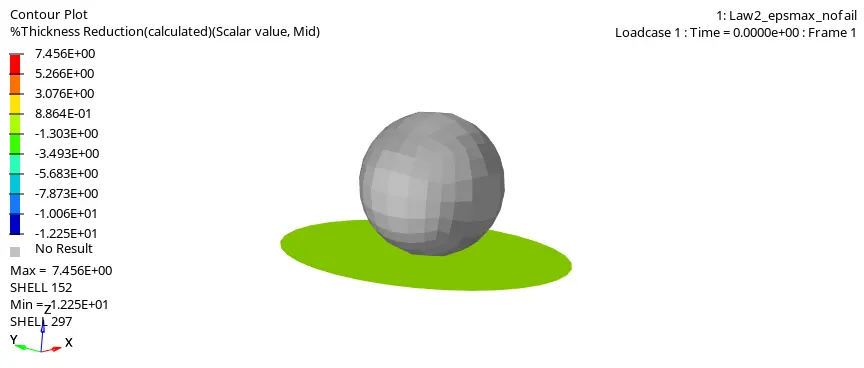
% Thickness Reduction Point of view:
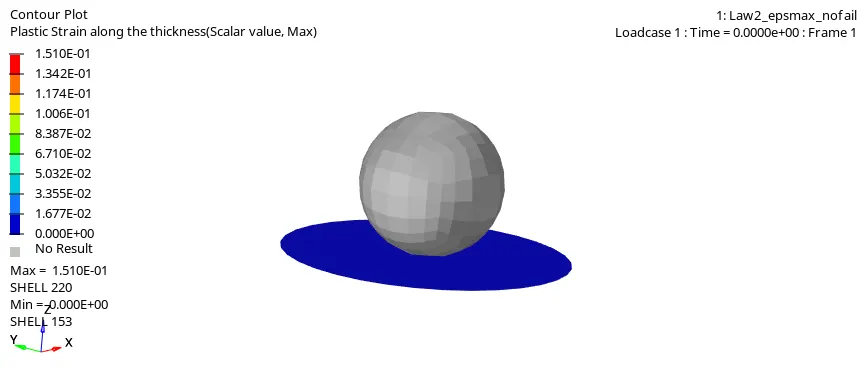
Plastic Strain along the thickness point of view:
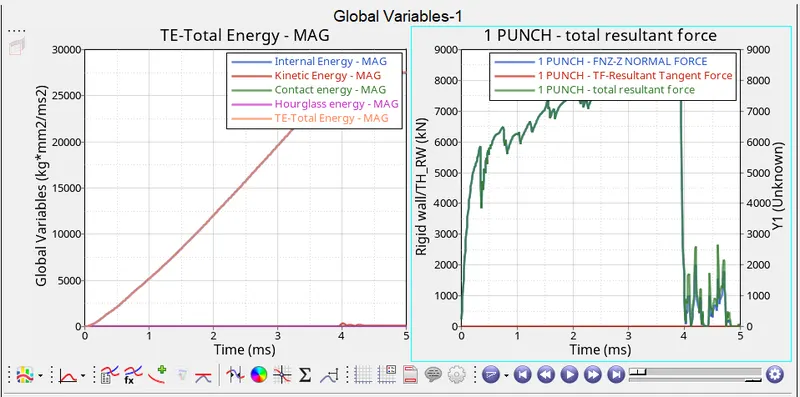
Graphs:
1 - Internal Energy, Kinetic Energy, Contact Energy, Hourglass Energy and Total Energy
2 Total Resultant Force Vs Normal Force
CASE 4:
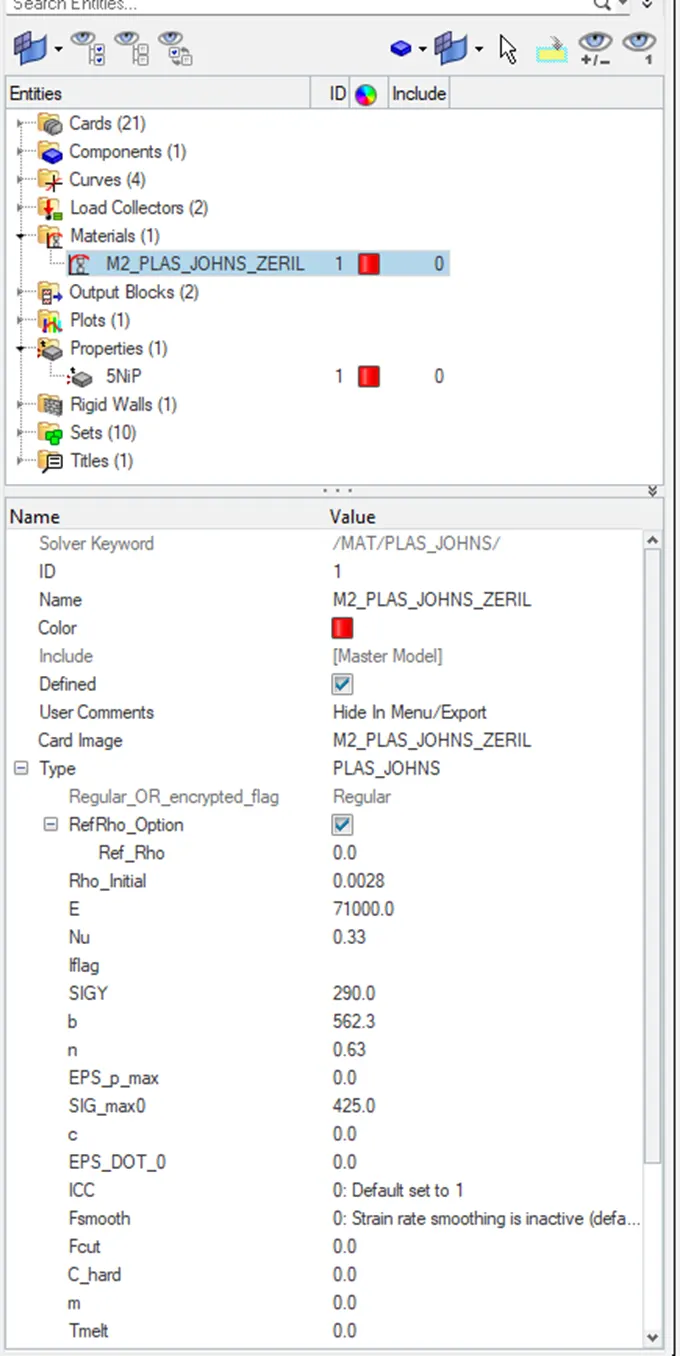
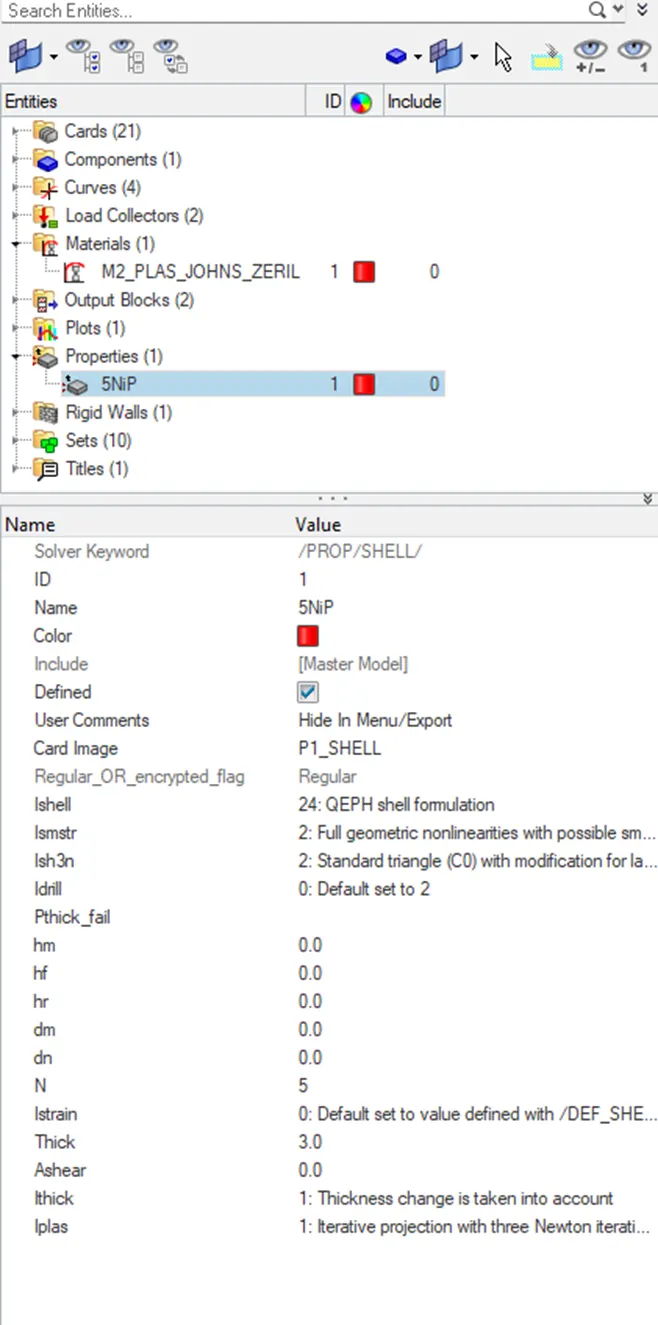
In this case, import the case 3 starter file - Law2_epsmax_nofail_0000.rad.This time, delete the EPS_p_max value (make it as 0). Going to the model tab, we can go to Materials > Aluminium as shown below
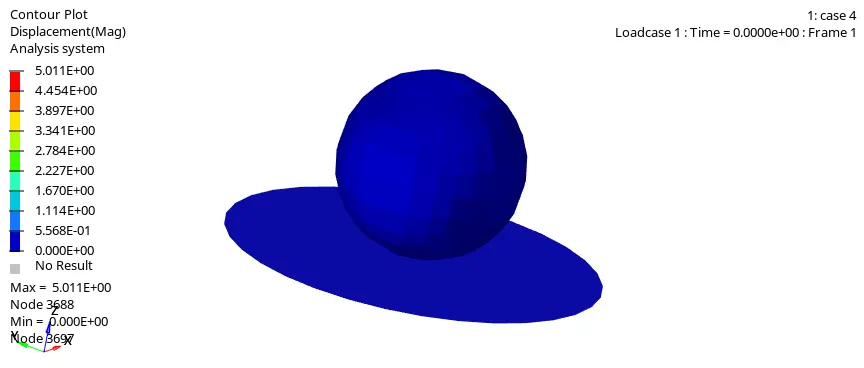
Displacement point of view:
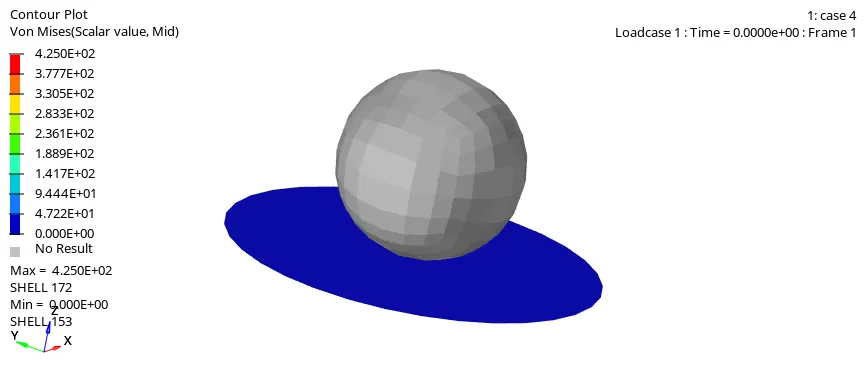
Von Mises yield Criterion point of view:
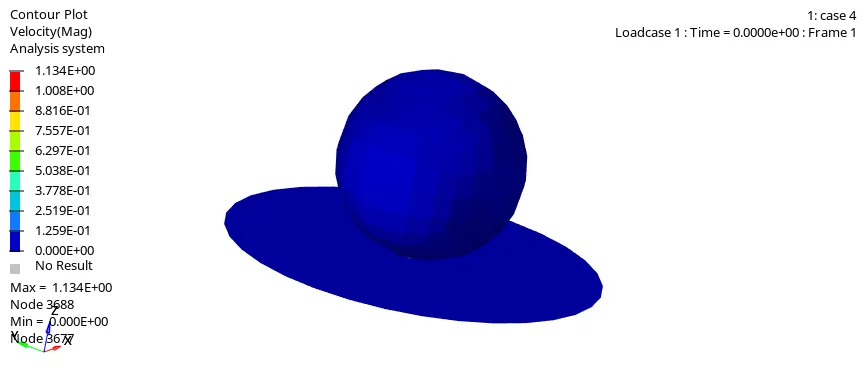
Velocity point of view:
% Thickness Reduction Point of view:
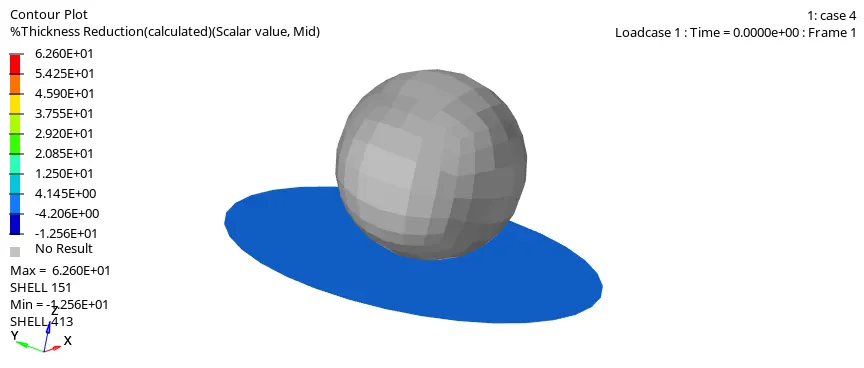
Plastic Strain along the thickness point of view:
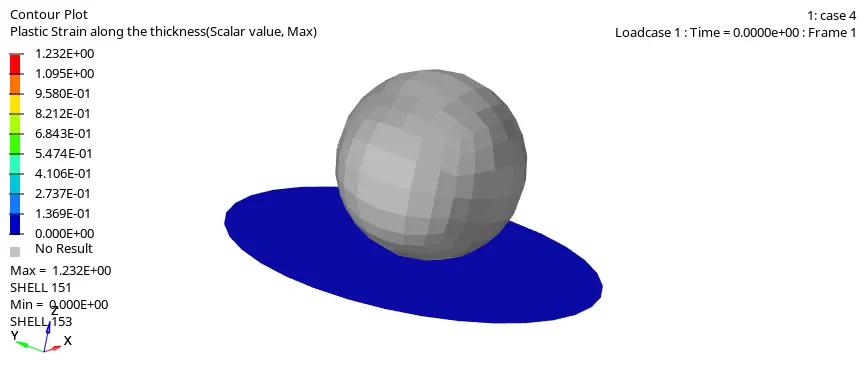
Graphs:
1 - Internal Energy, Kinetic Energy, Contact Energy, Hourglass Energy and Total Energy
2 Total Resultant Force Vs Normal Force
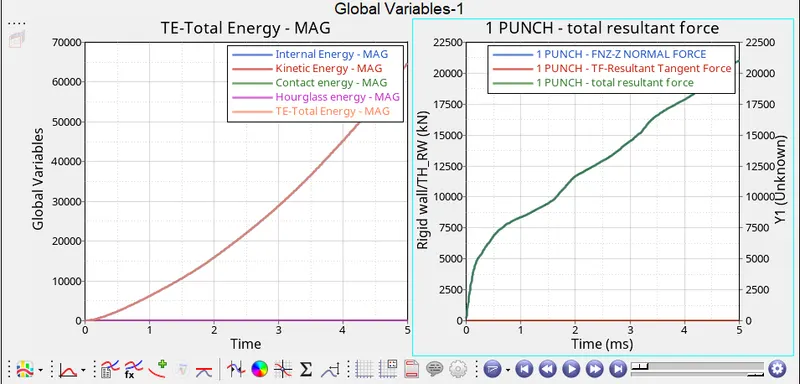
CASE-5:
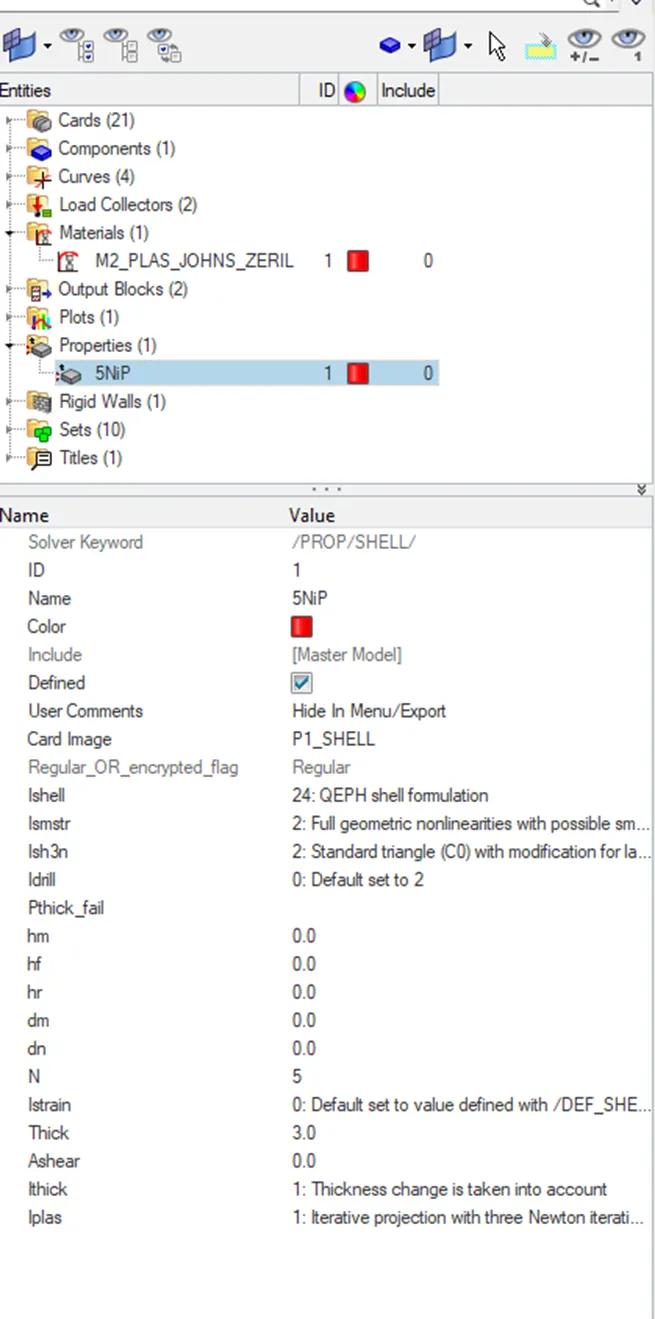
In this case import the main starter file - FAILURE_JOHNSON_0000.rad.After that, go to Materials card > Aluminium and change the card image to M1_ELAST, which is Law 1.Also set the values for Rho_Initial, E & Nu as follows:
Rho_initial = 0.0028, E = 71000.00, nu = 0.33.
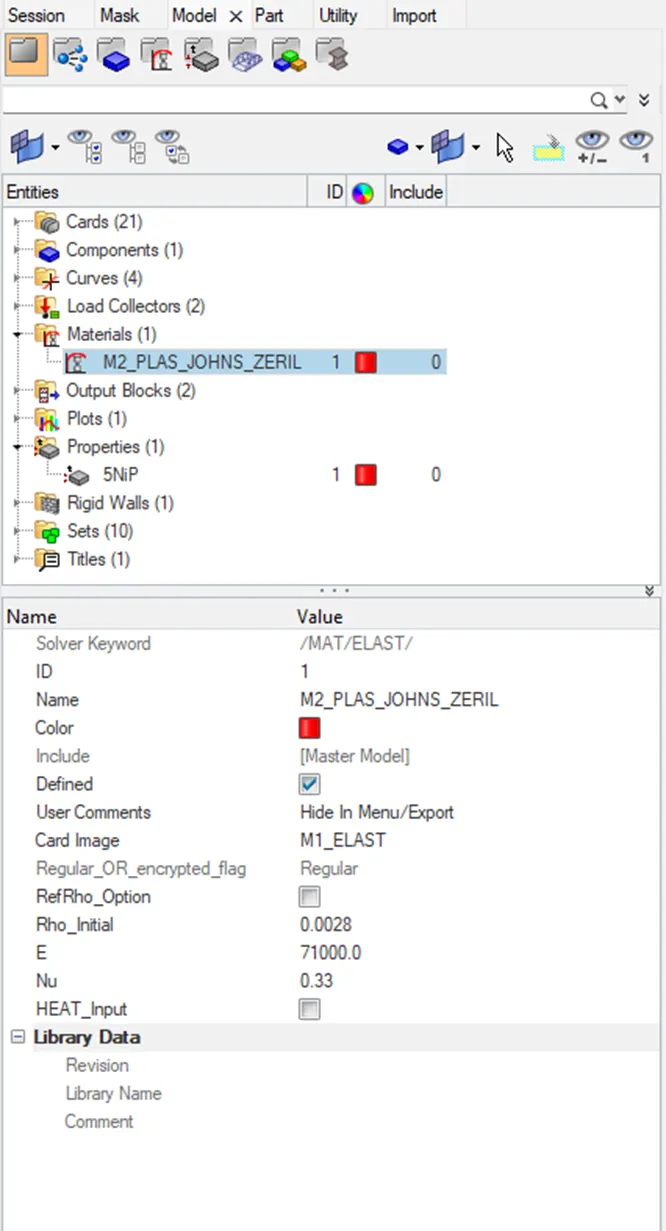
Displacement point of view:
Von Mises yield Criterion point of view:
Velocity point of view:
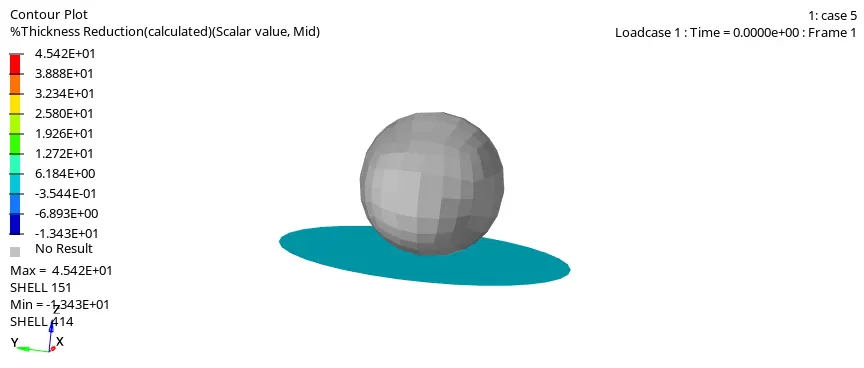
% Thickness Reduction Point of view:
Plastic Strain along the thickness point of view:
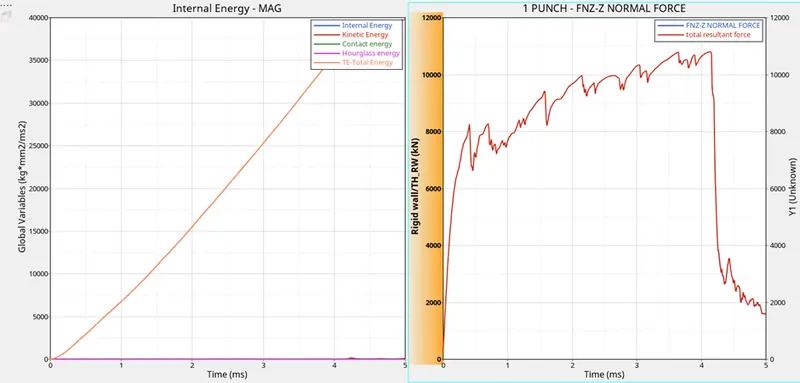
Graphs:
1 - Internal Energy, Kinetic Energy, Contact Energy, Hourglass Energy and Total Energy
2 Total Resultant Force Vs Normal Force
CASE-6
In this case, the material is Plas_brit which is an elastic-Plastic Material with additional parameters to define in nature of material such as eps_t1, t2, eps_f1, f2 eps_m1, m2, and dmax1, 2 which are a tensile failure in strain. Maximum tensile failure , tensile strain at element detection and maximum tensile damage to limit in two directions. To start with Law 27 is nothing but Law 2 with additional parameters hence, much detail analysis can be done.
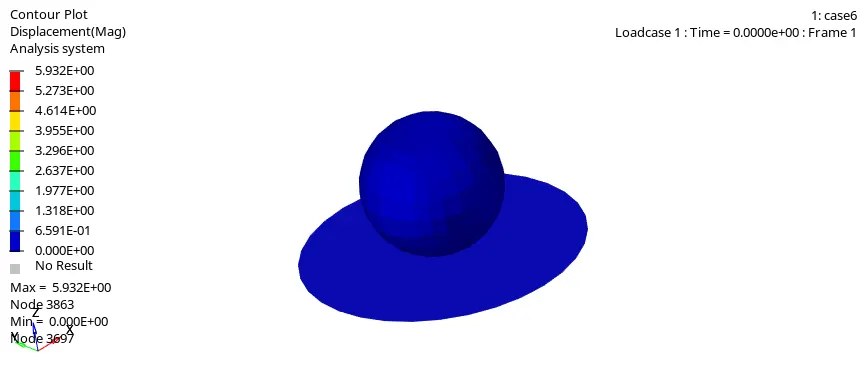
Displacement point of view:
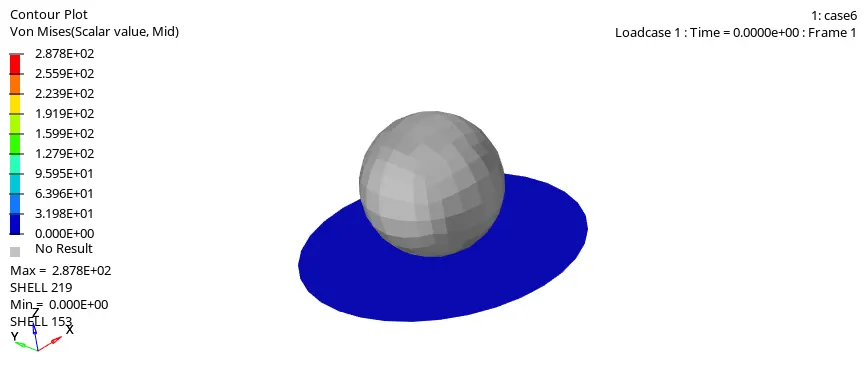
Von Mises yield Criterion point of view:
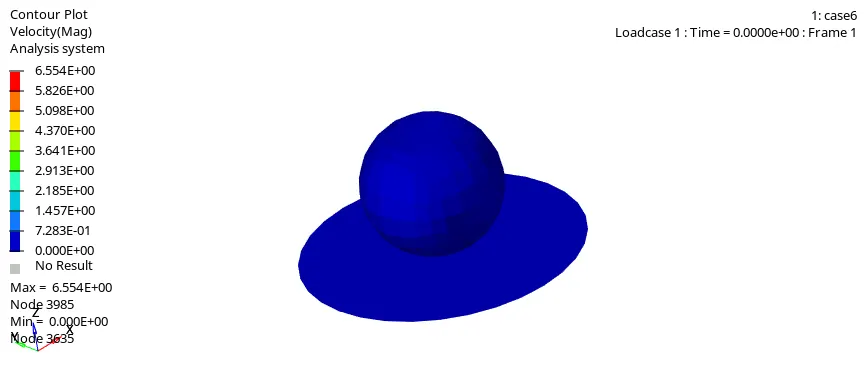
Velocity point of view:
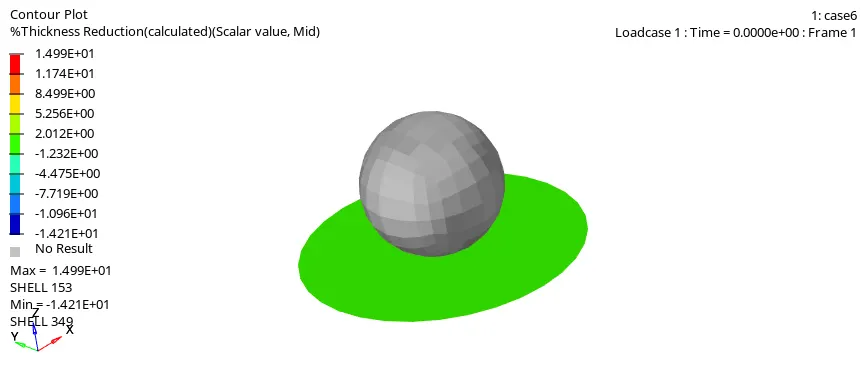
% Thickness Reduction Point of view:
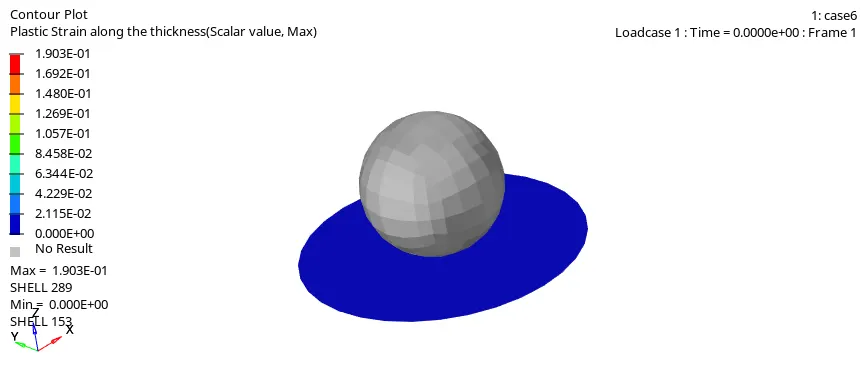
Plastic Strain along the thickness point of view:
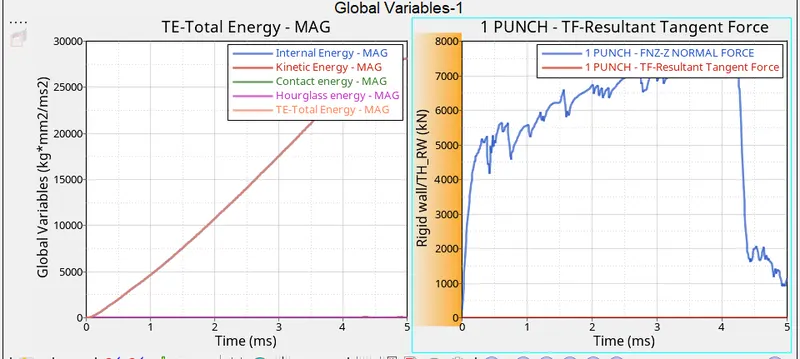
Graphs:
1 - Internal Energy, Kinetic Energy, Contact Energy, Hourglass Energy and Total Energy
2 Total Resultant Force Vs Normal Force
CASE-7
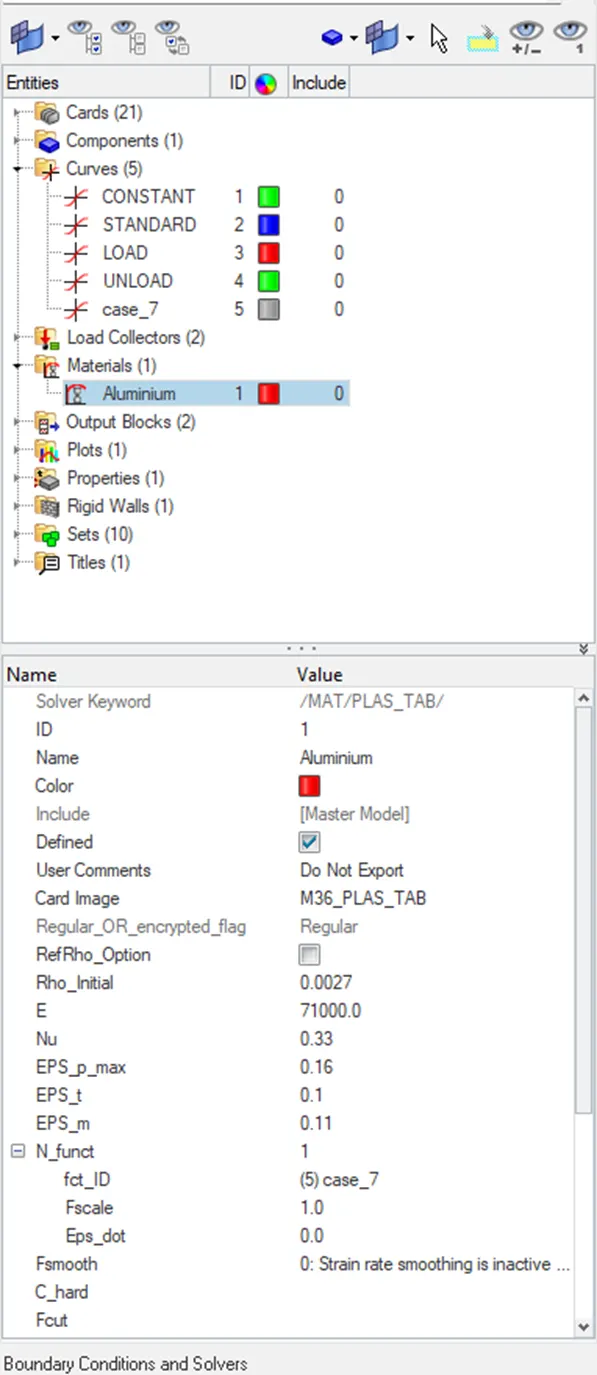
In this material model, the input parameters previously discussed eps_p_max, eps_m and eps_f in a single direction are defined. The important feature of the model is a user can input a stress v/s strain Plot as a curve and callit in the card from which the strain rate parameter is capturing. also, scaling factor, hardening coefficients etc can also be added to give further details for better analysis. The necessary inputs ere gathered from video lecture 6 and 7 were to added mode.Import File'Law36_0000.rad'.
Graph data
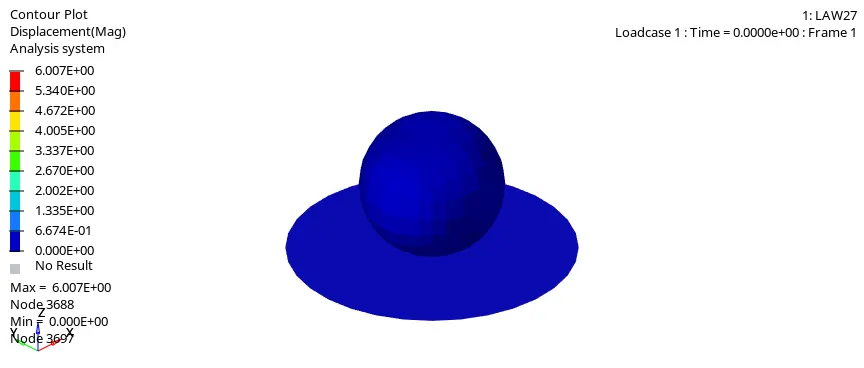
Displacement point of view:
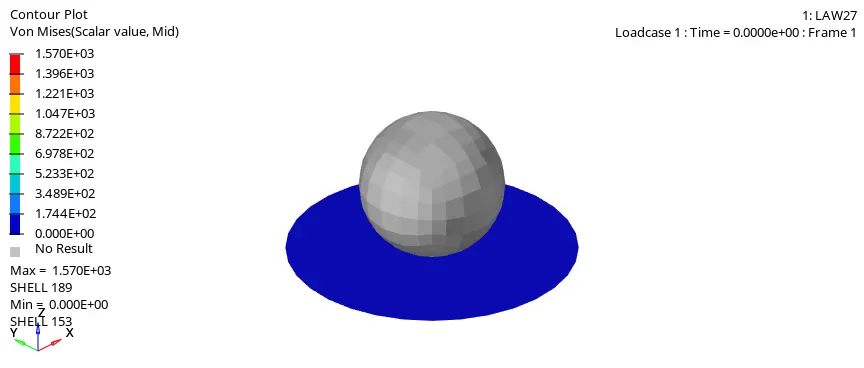
Von Mises yield Criterion point of view:
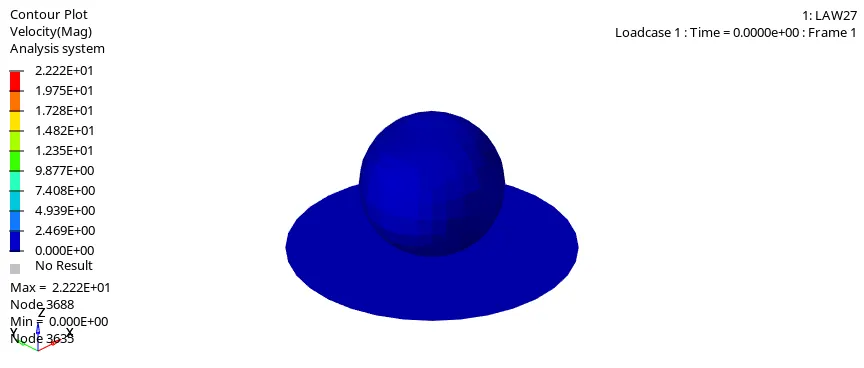
Velocity point of view:
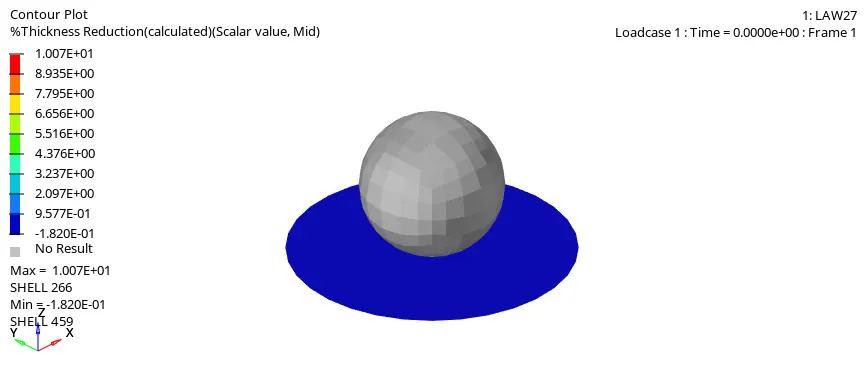
% Thickness Reduction Point of view:
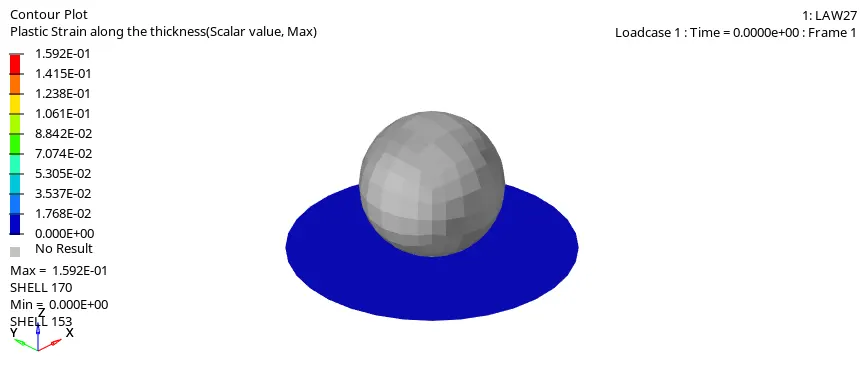
Plastic Strain along the thickness point of view:
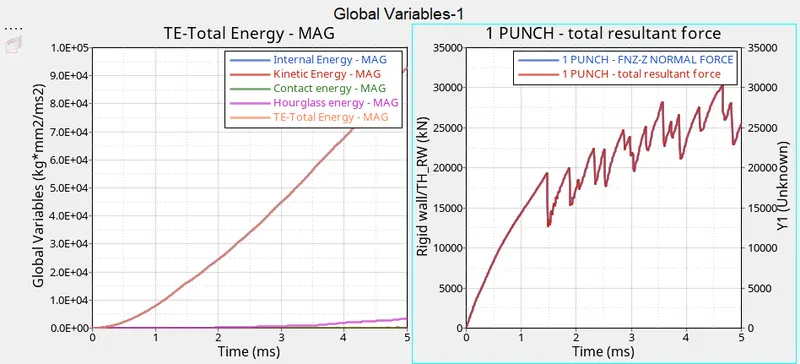
Graphs:
1 - Internal Energy, Kinetic Energy, Contact Energy, Hourglass Energy and Total Energy
2 Total Resultant Force Vs Normal Force
conclusion:
As indicated, case 1, case 6, and case 7, given the right inputs, will produce realistic results for the current scenario, where the material in question is aluminium alloy. The best alternative with the specified inputs and more thorough results than Law 2-Elastoplastic with Fail Johnson card is Law 27-Plas brit material model. The final option is plastic strain parameters, however they require reliable data, ideally from physical testing, because the Plas tab material model is sensitive to its inputs (the stress v/s strain curve).
In this instance 1, the Fail/JOHNSON card and the EPS p max value are allocated, and the Ixfem value is set to 0. As evidenced by the simulation shown above, the items are eliminated as soon as they surpass the EPS p max threshold.
Reactions to the force produced by the sphere on the sheet include internal energy and rigid wall forces. Up until the 4ms barrier, where numerous elements are eliminated, energy increases linearly. This most likely causes some vibrations, which at the same time cause a surge in kinetic energy.
The stiff wall forces fluctuate when pieces are removed, and when a significant number of elements are removed at 4 milliseconds, the graph lowers, indicating that there aren't many elements left. meaning there aren't many elements opposing the force of the sphere. Most of the elements in its path have been deleted at that point.
As part of the Fail/JOHNSON card in Case 2, we have used Ifail sh, Dadv, and Ixfem. Because it controls how the elements respond, Ixfem is particularly significant in this situation. Its value in this case is 1, which indicates that the elements will break and fail. Dadv and crack propagation can both be observed in this case, with elements being eliminated only as the crack approaches them. This portrayal is therefore more accurate.
In this instance, the solid wall is shifting. Therefore, for any thing to move, there needs to be an external force acting on it. As a result, the rigid wall forces begin to increase from zero, and when they hit the plate, the energy was transferred to the elements.that's the reason the rigid wall forces get decreased again to zero.
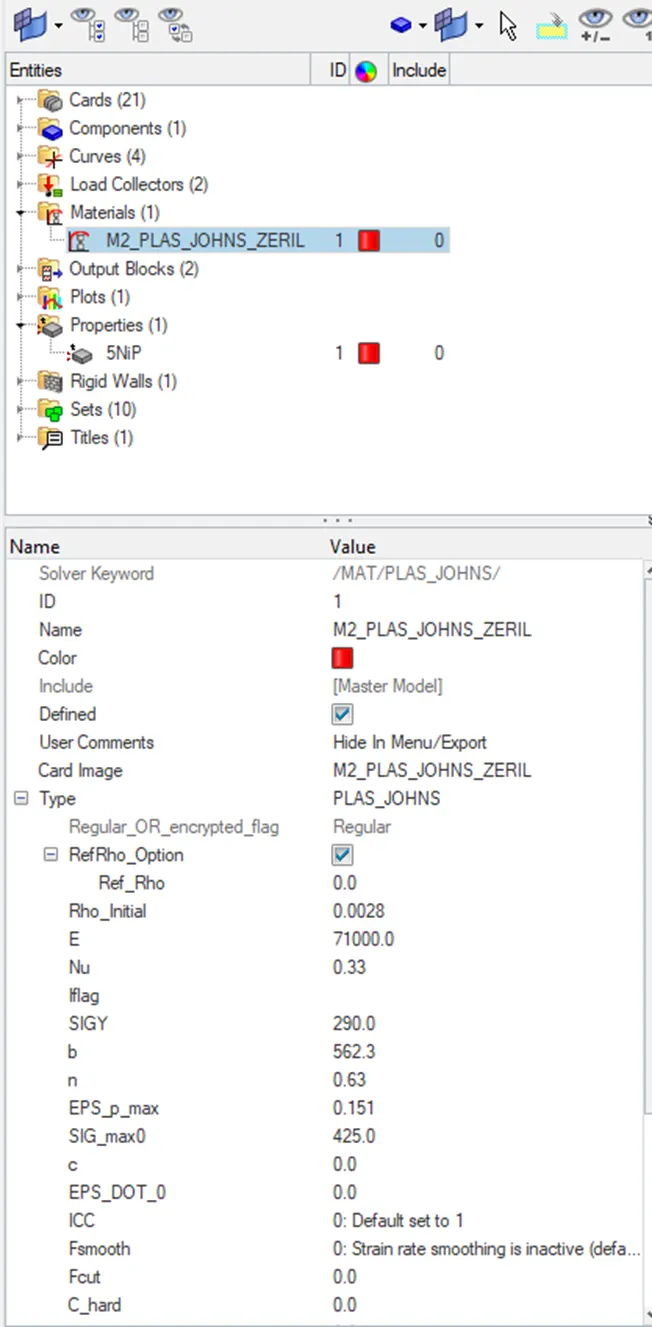
It is up to EPS_p_max to be the determining factor for element deletion in case 3 with the Fail/JOHNSON card eliminated in this instance. The number is 0.151, as shown in the screenshot below, and it indicates that elements will be destroyed if any integration point within those components experiences a strain greater than 15.1% of the plastic strain. When compared to the elements in instance 2, which had an XFEM crack formulation, the elements in this case break more quickly.Internal and total energy both rise linearly until the majority of the elements are eliminated from the model. This is expected since the energy that these elements received is lost when they are deleted.
in case 4 as a function of strain, strain rate, and temperature, Law 2 (PLAS JOHNS) expresses material stress.
The main reason the value for EPS p max was eliminated is that the metal sheet can resist a lot of stress and prevent element elimination. As a result of being erased, RADIOSS gives it the default value of 1030. Furthermore, the fail/JOHNSON card was erased. Since the material has an extremely high EPS p max threshold and elements cannot be eliminated because of no failure cards, it behaves like a pseudo-elastic (also known as elasto-plastic) material.There is no strain rate when c (Strain Rate Coefficient) = 0. (neither does temperature play a role here). The stress is therefore solely a product of this circumstance.As a result, the stress, in this case, is purely a function of strain generated in the material.
in case 5, a LAW-1 material that outlines the fundamental characteristics of elastic material is used to define the plate. This model simply takes into account the material's elastic phase; linear deformation caused by plasticity is not taken into account.
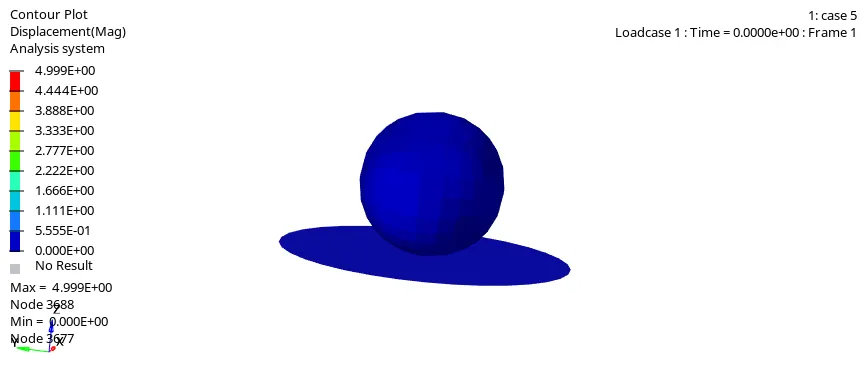
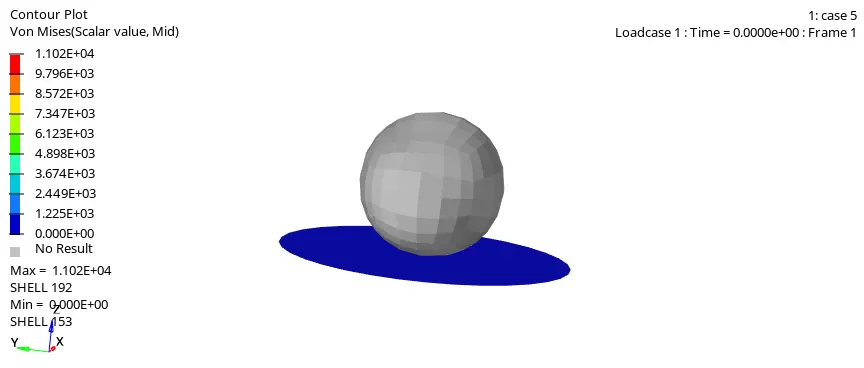
The M1 Elast card is used in this instance, and as can be seen, the metal sheet fully absorbs the impact of the sphere. Purely elastic materials are modelled using this material law. The lack of element deletions or ruptures is explained by this. The peak near the end of the kinetic energy plot below is due to the flexibility of the material, which also allows it to absorb a tremendous amount of energy.Absorbing a lot of energy also results in very high stresses - the maximum stress observed on the metal sheet is 10890 MPa, which is a massive value compared to the same in LAW 2.
In this case 6 the use of the M27_PLAS_BRIT material card that is used for isotropic elastoplastic Johnson-Cook material model with an orthotropic brittle failure model. The sheet (compared to case 7) absorbs more force and resorts to more deformation before the elements are deleted (at around 4ms).With the loss of energy through deleted elements, we notice the graph plateaus at around the 4 ms mark.With several elements deleted and none to stop the incoming sphere, the rigid wall force graph drops at the same timestamp of 4ms. The spikes are formed when an element is deleted and is characterized by a trough and crest but with so many elements deleted, the trough is massive at the 4ms mark.
In this case7, from the simulation, we can say that this material exhibits strong brittle behaviour. It does not bend as much in response to the applied force and immediately disintegrates. There seems to be not much cracking and the region of element deletion takes the shape of the sphere. Another thing that we can notice is that the stress concentration is localized around the region of impact and these stresses are not dissipated throughout the whole metal plate.Up to 3 milliseconds, when numerous elements are eliminated all at once, there is a nearly linear relationship between internal energy and time. The curve plateaus when the elements are removed because the energy spent on each element is wasted.The rigid wall force graph makes this issue of energy loss and element deletion more obvious. Every spike is the result of an element loss. Past the same 3 ms mark, the resulting force steadily builds to the point when the sheet gives way and allows the sphere through. The rigid wall forces are greatly decreased because there is not much of the sheet in the way, which causes the dip at the 3ms mark. The initial drop occurs when the sheet ruptures the first time.
LAWS:
Law 1 is used to model purely elastic materials or materials that remain in the elastic range. To model this we require Poisson's ratio and Young's modulus. This law represents a linear relationship between stress and strain.
Law 2: In this law, the material behaves as linear elastic when equivalent stress is lower than the yield stress. For a higher value of stress, the material behaves like plastic. Failure can be captured better with the help of an optional Fail_Johnson card.
Law 27: Used for brittle materials.
Law 36: The elastic-plastic behavior of isotropic material is modeled with user-defined functions. The stress-strain curve is modeled using E and Poisson's ratio. Therefore, it is the best card because we cannot know the exact failing condition of the material in the other cases, but we can define the stress-strain curve, and then we can decide where the material is failing.