Assignment 4-RADIOSS Material Laws Challenge
RADIOSS Material Laws Challenge
Objective: To carry out a simulation on the given model by applying different material laws and to compare the behavior of the model with different material laws and failure formulations.
Problem Specification:
- Run the model as it is Name it as law2_epsmax_failure
-
In /FAIL/JOHNSON , change ifail sh =1, Dadv =1, and Ixfem=1. Run the model as Law2_epsmax_crack
-
Delete /FAIL/JOHNSON card. Run the model as Law2_epsmax_nofail.
-
Delete the value of eps_p_max and run the model with the name Law2.
-
Convert this material into LAW1elastic with the same density, E, and nu, and check the results.
-
Open LAW27_000.rad
. Change the shell properties to recommended.
• Notice the material card, and Johnson cook parameter but different values for EPS-based failures.
• Run the model with Law27
7. Run the model with Law36 and change material properties.
Compare 7 cases as discussed in a tabulated format based on:
1. the Total number of cycles, Energy error, mass error, and simulation time.
2. Notice the animation of all 5 and describe the animations in brief based on whether the elements are being deleted or cracked.
3. Plot energies and notice any difference.
4. Based on all the results, which case would represent the on-field scenario.
PROCEDURE :
CASE 1
Open the HyperWorks and select the RADIOSS profile.
Import the given 0000.rad file
Change the properties to recommended properties of shell elements.
This file contains the Johnson-Cook material model and the failure card.
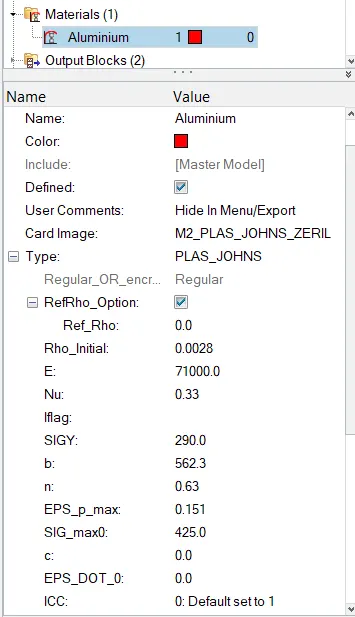
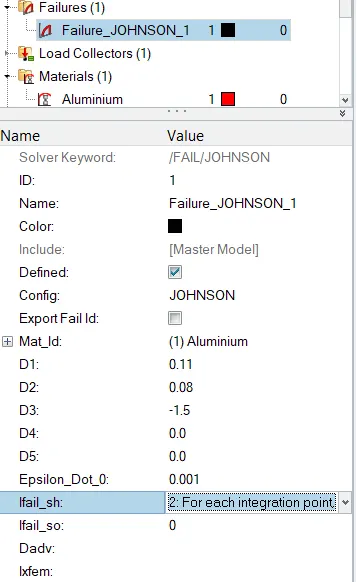
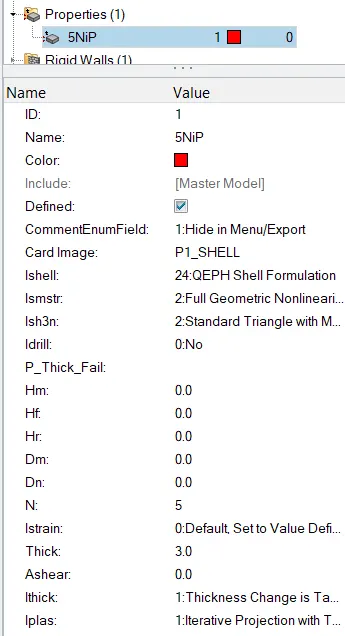
( In this case, Failure card FAIL/JOHNSON is active, as well as EPS_p_max value, is also defined. Ixfem value is 0 which means elements will be deleted as soon as they cross the Eps_p_max threshold .)
Run the Simulation and save the file as Law2_epsmax_failure
Go to the folder where the results are saved and then open the 0001.out file to view the simulation results.
Observe the energy error whether it is in the acceptable range or not.
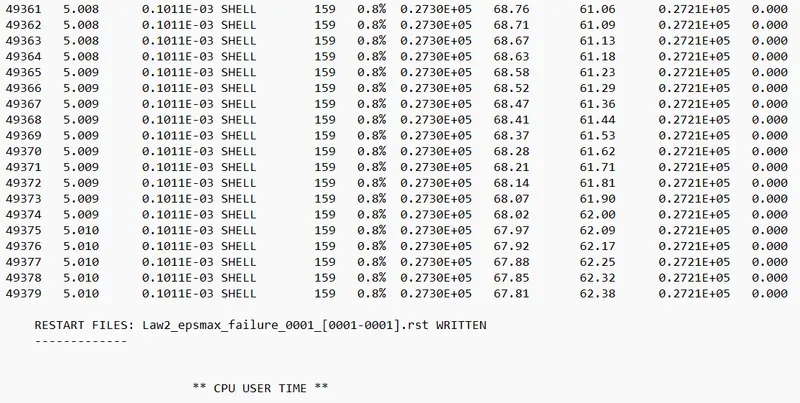
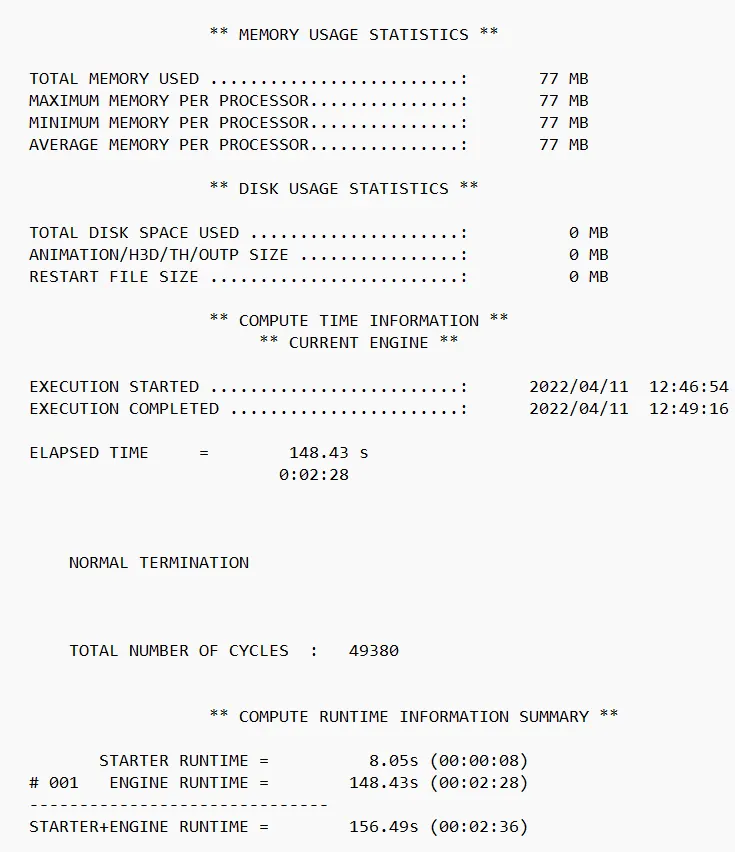
In this case, the energy error is reaching up to 0.8% and it is in the acceptable range.
Mass error is zero throughout the simulation.
Open the Hyperview and load the .h3d file to see the animations and plot the Von Mises stress and the plastic strain contours.
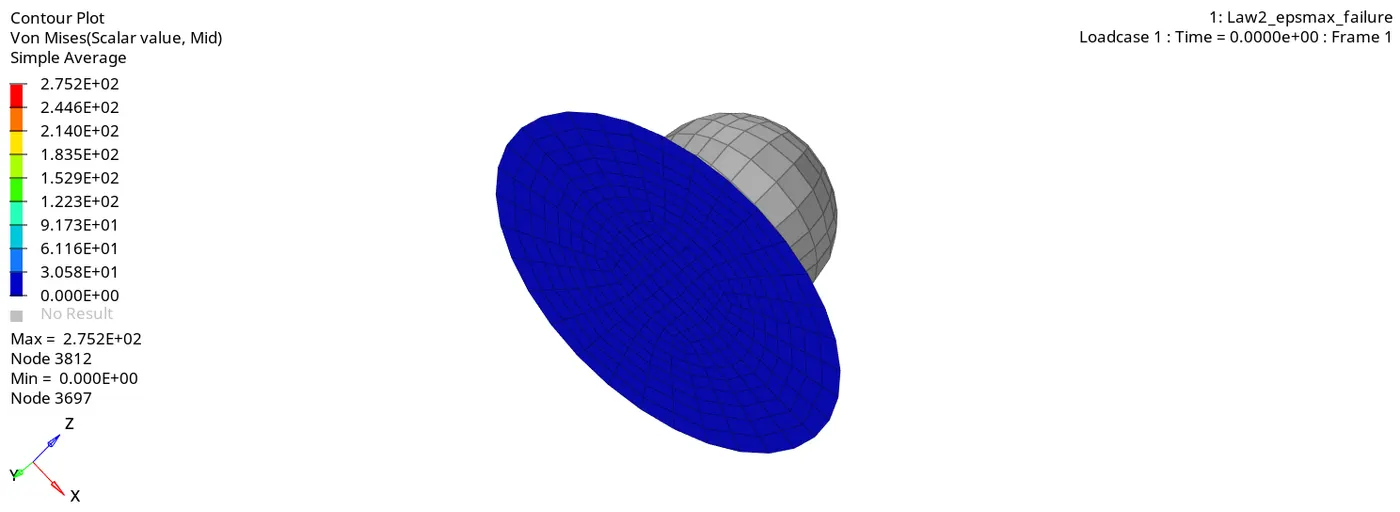
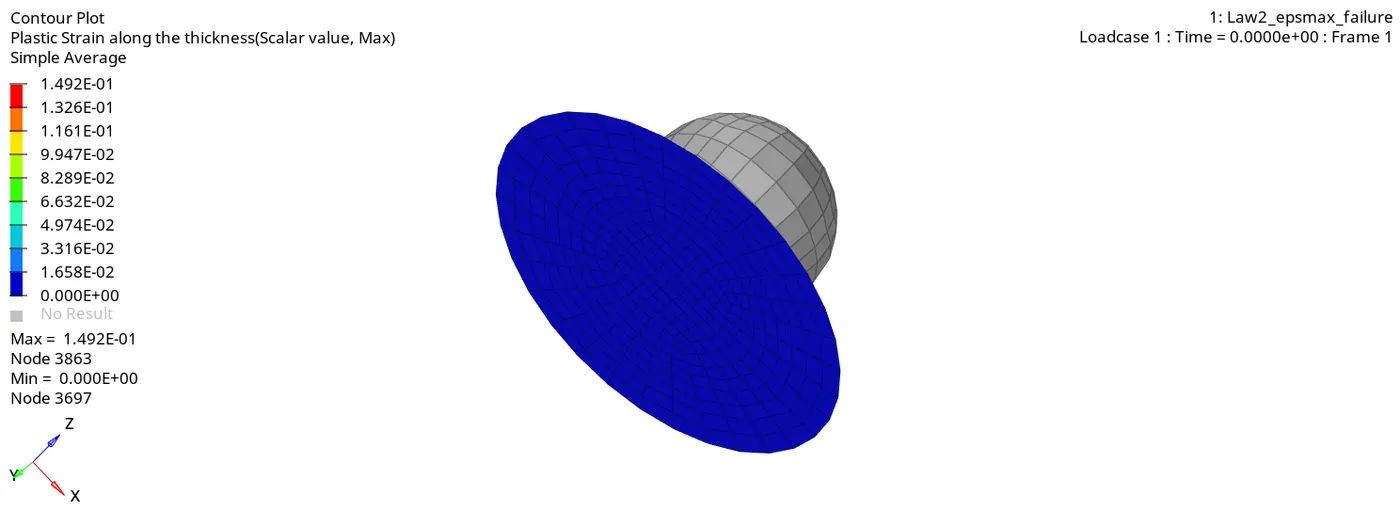
Since the errors are in the acceptable range plot the required curves of the simulations in the Hypergraph 2D
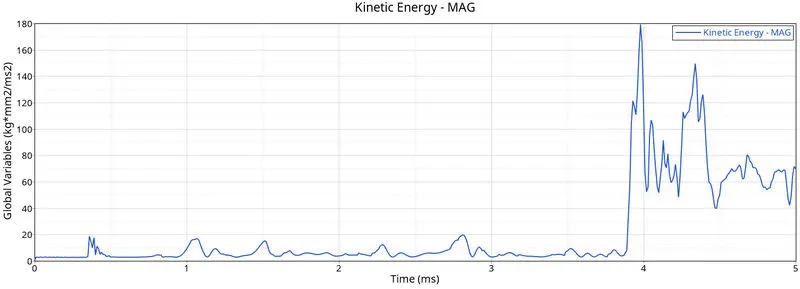
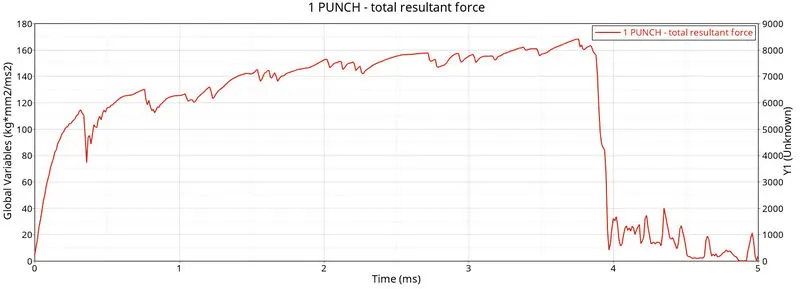
Observations:
- Total number of cycles = 49380
- Energy error = 0.8%
- Mass error = 0
- Simulation time = 148.43 s
- Maximum Stress = 275 MPa
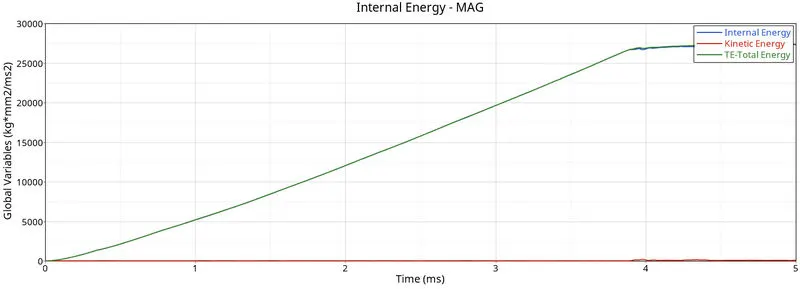
- Internal energy, as well as rigid wall forces, are reactions to the force generated by the sphere on the sheet. Energy increases linearly until many elements are deleted at around the 4ms threshold. This probably creates some vibrations and that results in a surge of kinetic energy at the same point.
- The rigid wall forces fluctuate when the elements are deleted, and when a large chunk of elements are deleted at 4ms, the graph drops, meaning there aren't many elements opposing the force of the sphere Most of the elements in its path have been deleted at that point.
CASE 2
Modify the failure card as shown below.
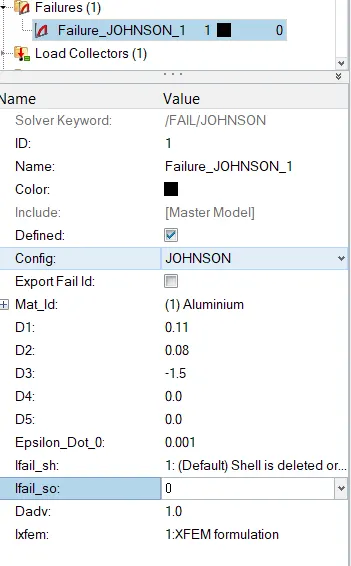
( In this case, Failure card FAIL/JOHNSON is active, as well as EPS_p_max value, is also defined. Ixfem value is 1 which will generate the crack in the shell element Dadv is the criteria of crack advancement .)
Run the Simulation and save the file as Law2_epsmax_crack
Go to the folder where the results are saved and then open the 0001.out file to view the simulation results.
Observe the energy error whether it is in the acceptable range or not.
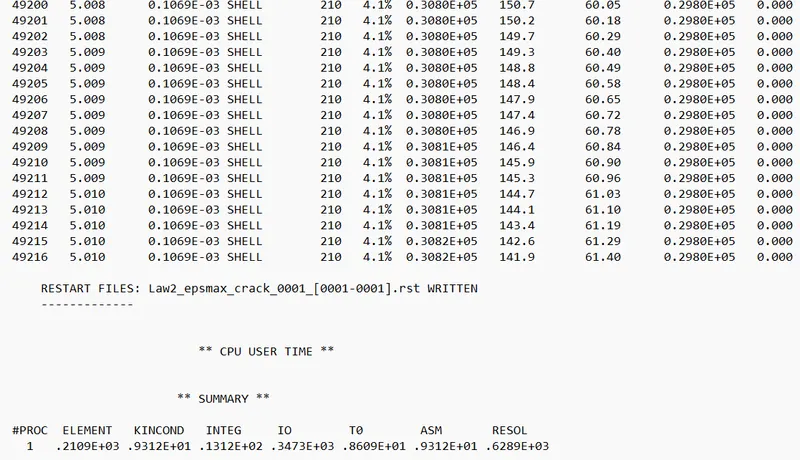
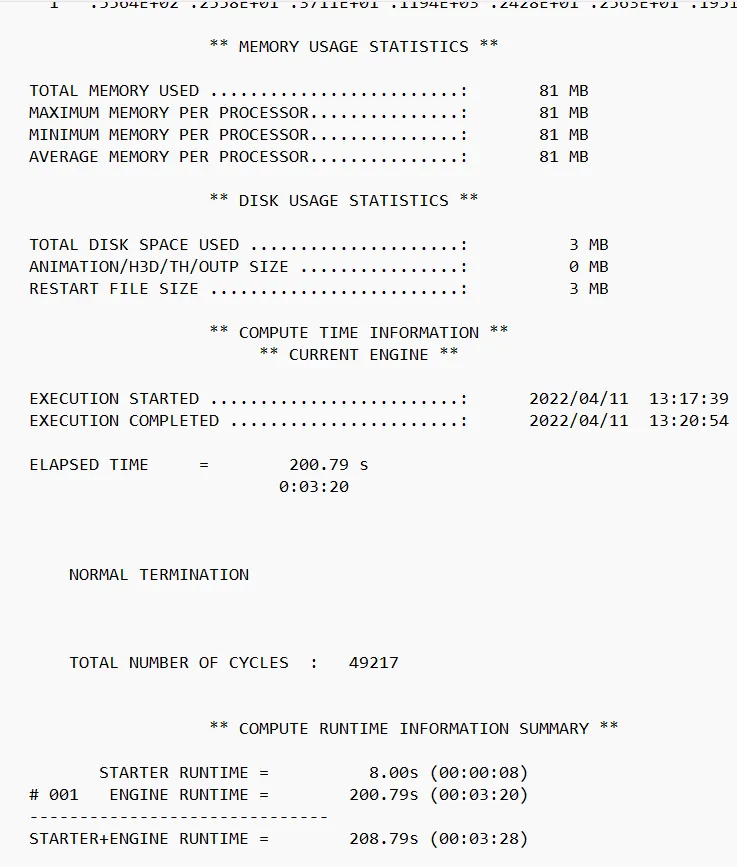
In this case, the energy error is reaching up to 4.1% and it is in the acceptable range.
Mass error is zero throughout the simulation.
Open the Hyperview and load the .h3d file to see the animations and plot the Von Mises stress and the plastic strain contours.
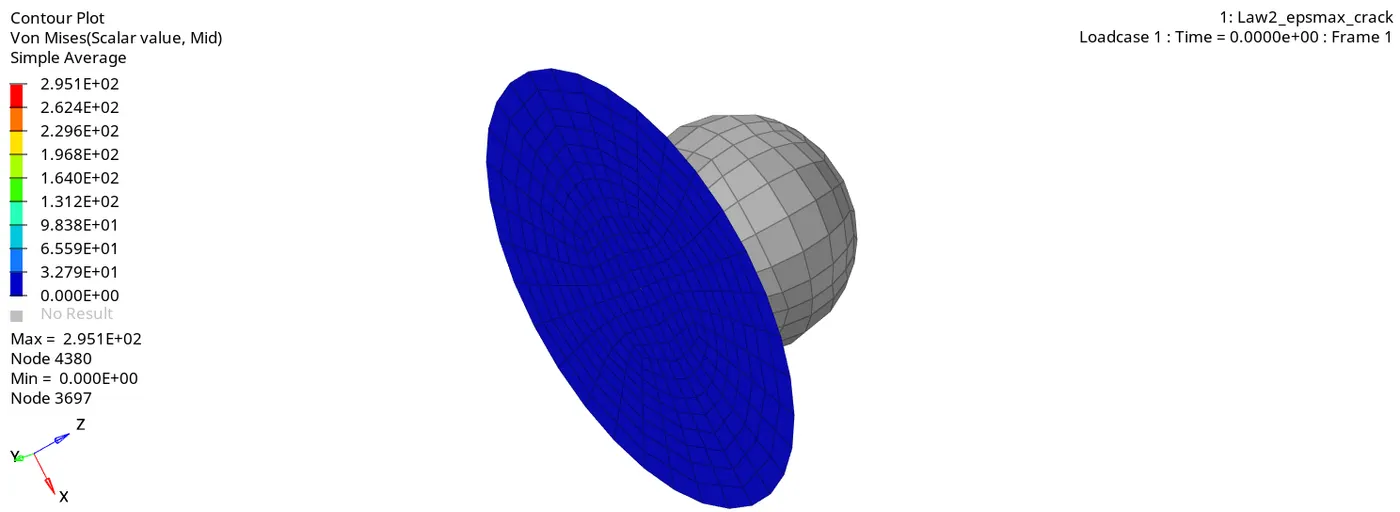
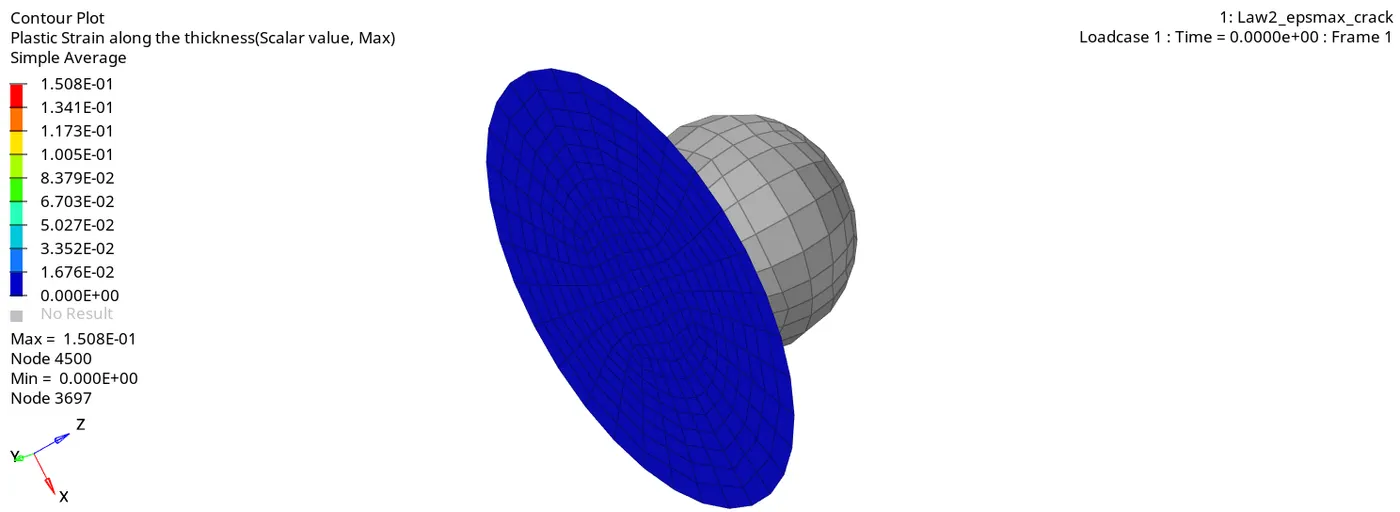
Since the errors are in the acceptable range plot the required curves of the simulations in the Hypergraph 2D
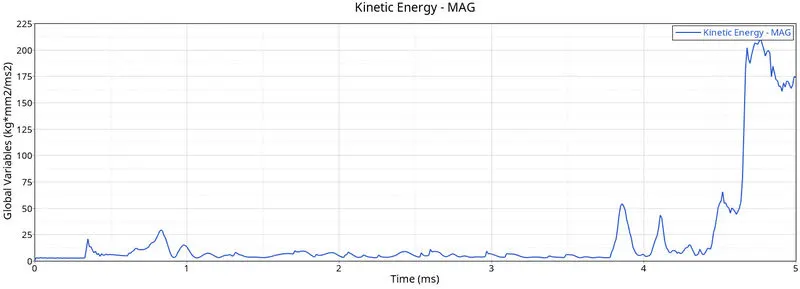
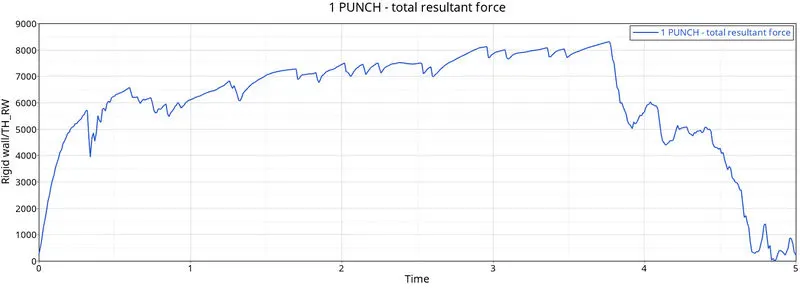
Observations:
- Total number of cycles = 49217
- Energy error = 4.1%
- Mass error = 0
- Simulation time = 200.79 s
- Maximum Stress = 295 MPa
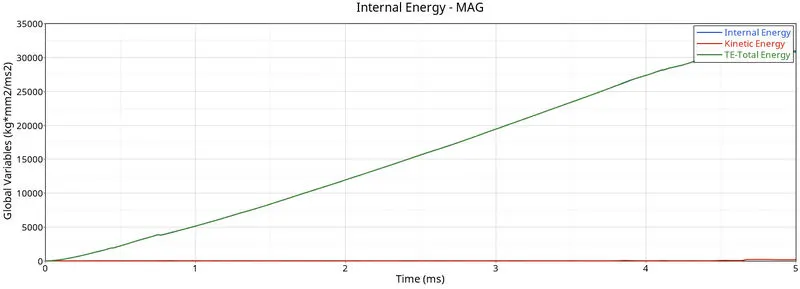
- In this case, the Energy increases linearly and the kinetic energy plot change is not abrupt as it was in Case1.
- Similarly, the Rigid wall force fluctuations are not abrupt as it was in case 1.
CASE 3
Delete the failure card from the simulation and run the simulation.
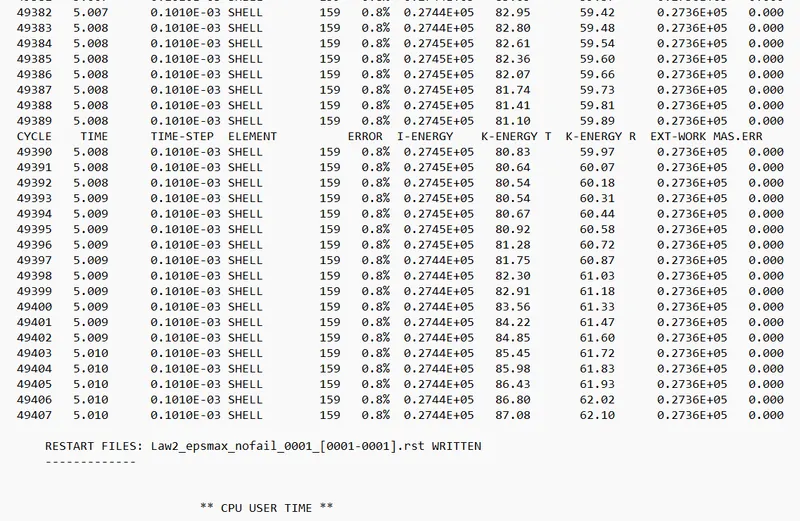
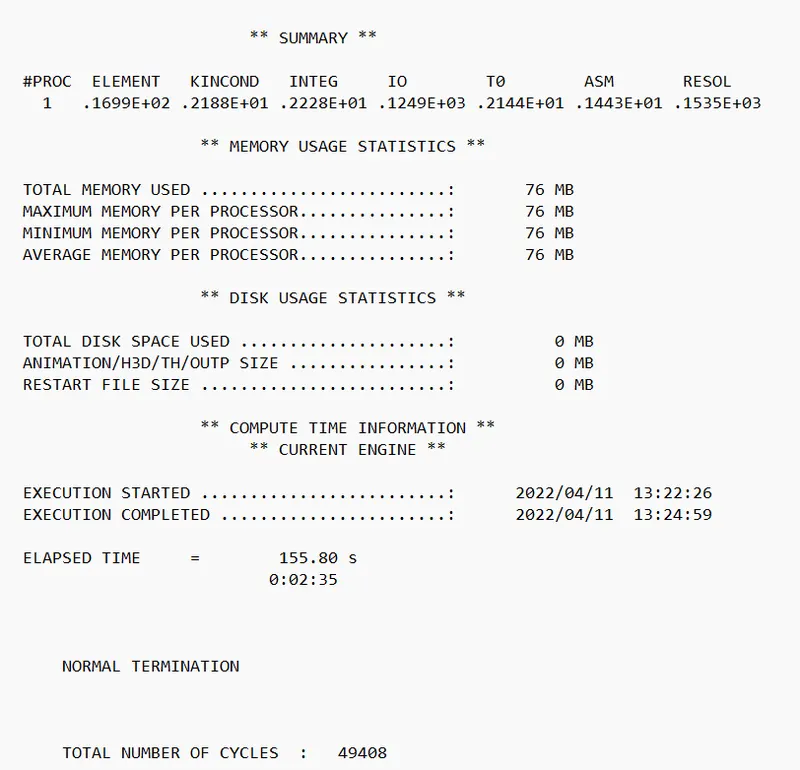
In this case, the energy error is reaching up to 0.8% and it is in the acceptable range.
Mass error is zero throughout the simulation.
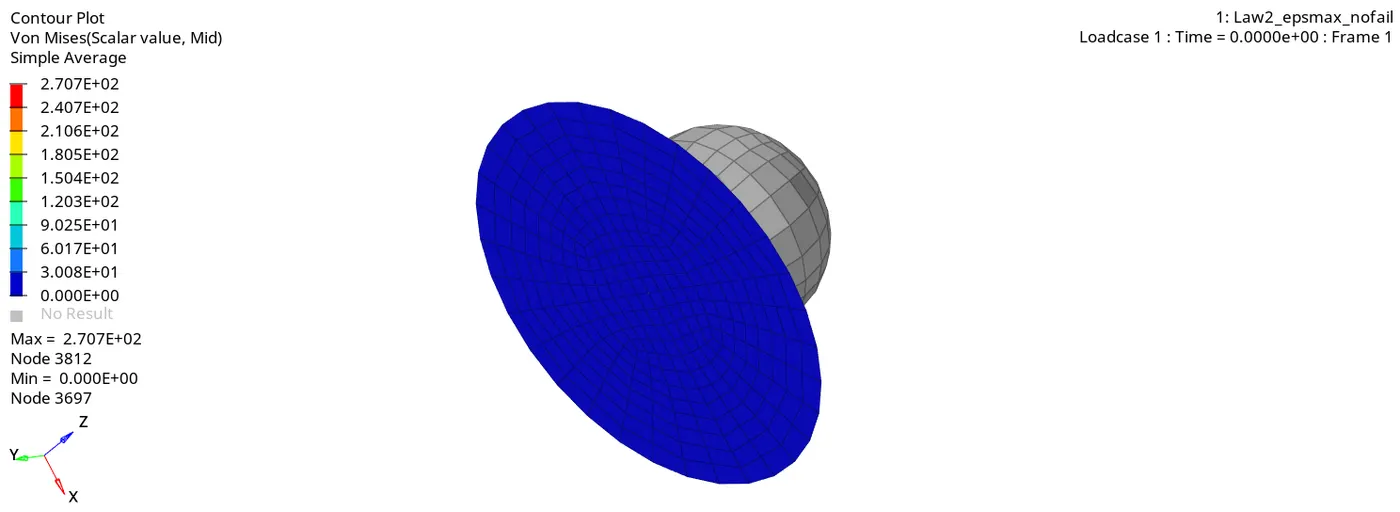
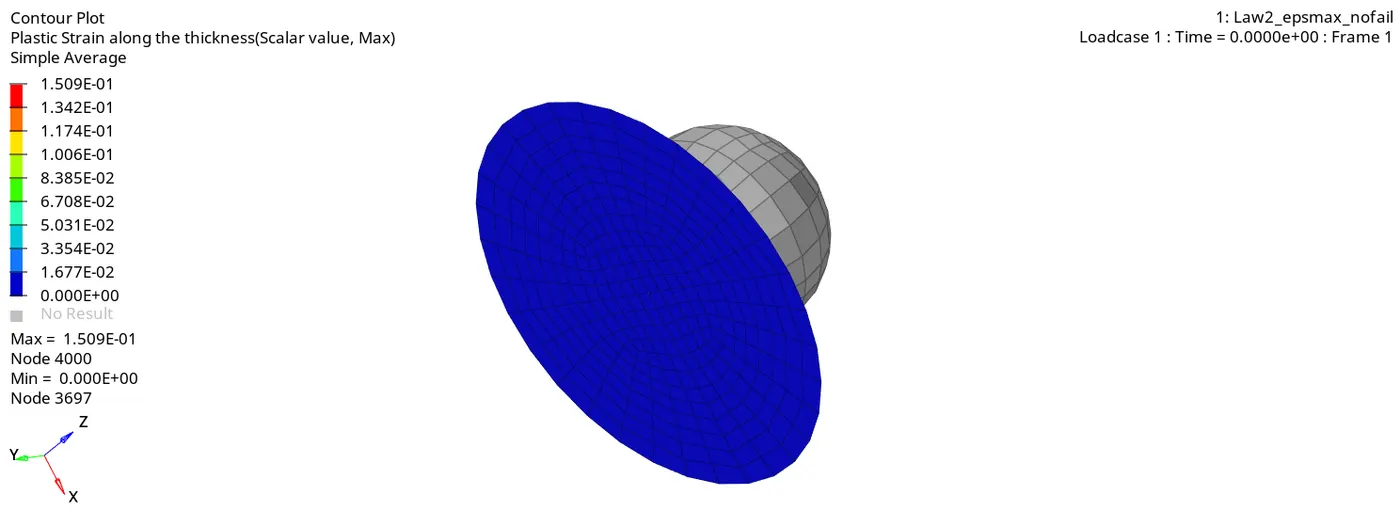
Open the Hyperview and load the .h3d file to see the animations and plot the Von Mises stress and the plastic strain contours.
Since the errors are in the acceptable range plot the required curves of the simulations in the Hypergraph 2D
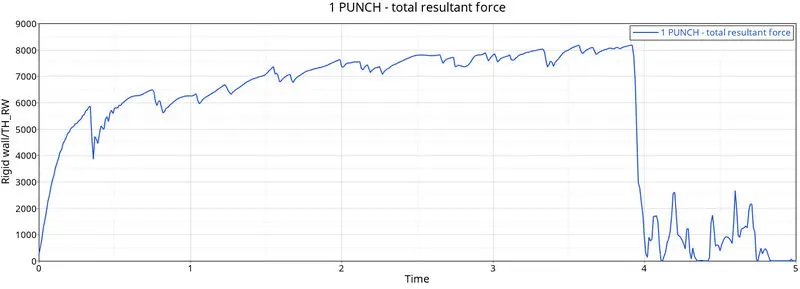
Observations:
- Total number of cycles = 49408
- Energy error = 0.8%
- Mass error = 0
- Simulation time = 155.80 s
- Maximum Stress = 270.7 MPa
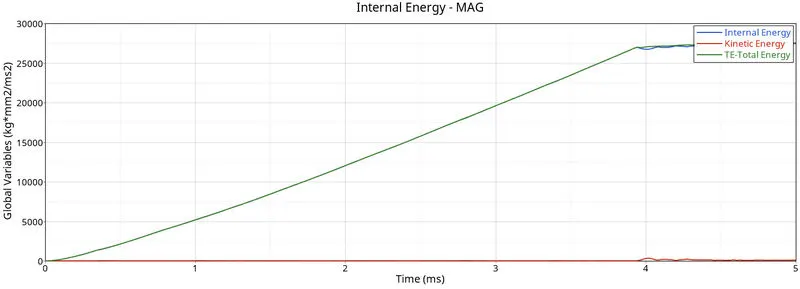
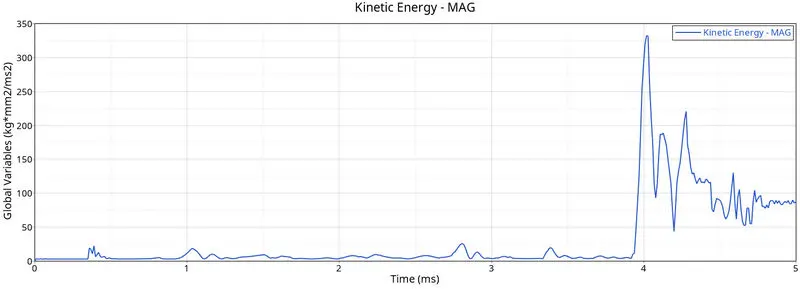
- Since the Fail/JOHNSON card was deleted in this case, the EPS_p_max is the factor for element deletion. The elements, in this case, are failing rapidly as compared to the elements in case 2 due to the Ixfem crack formulation being there.
- There is a linear increase in internal and total energy until a bulk of the elements are deleted from the model This is expected since the energy absorbed by these elements goes to waste due to their deletion.
- There is a sudden drop in rigid wall forces because most of the elements that were in contact with the sphere during the collision were deleted. The rigid wall force is a measure of the opposing force generated by the metal sheet against the sphere. Fluctuations occur when elements are deleted When there are no elements to oppose the incoming sphere, there won't be any rigid wall forces.
CASE 4
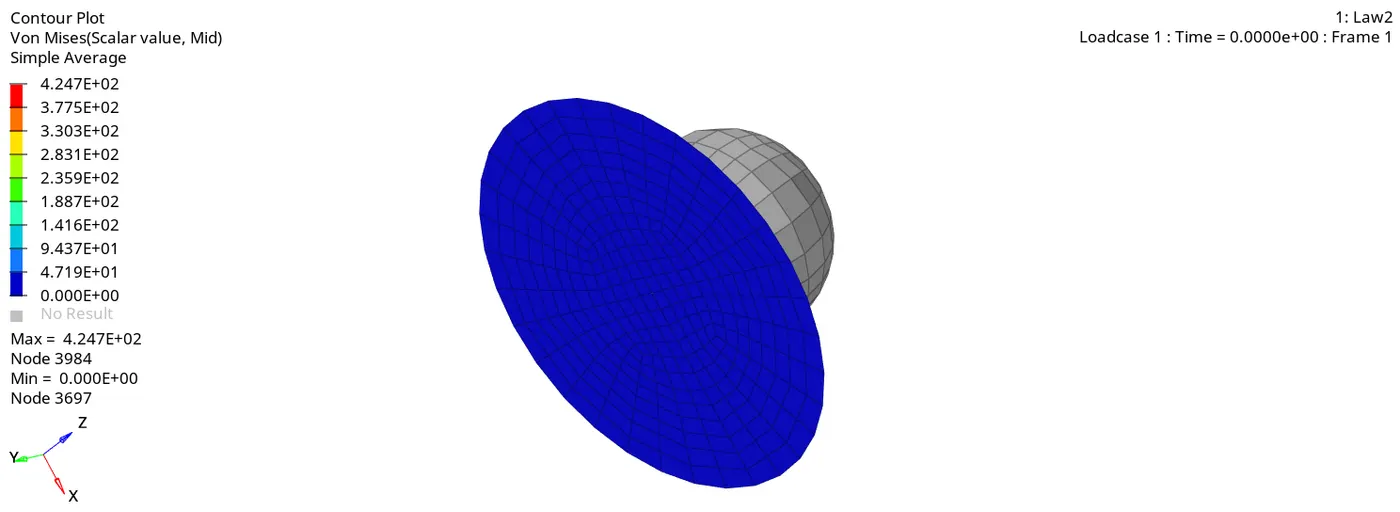
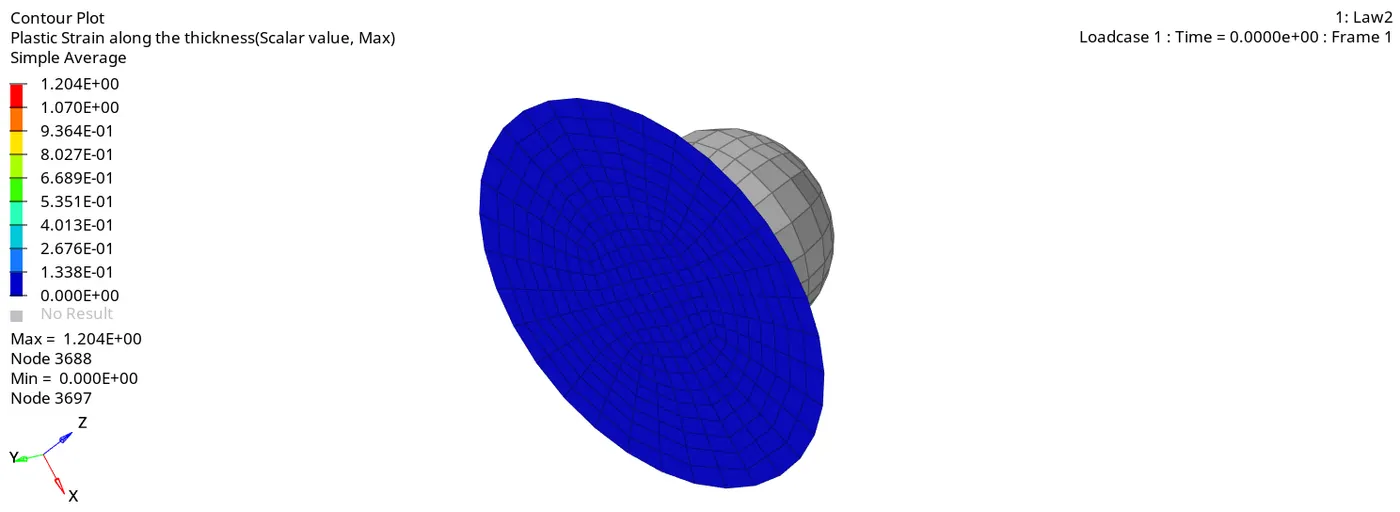
Run the model with zero EPS_p_max value.
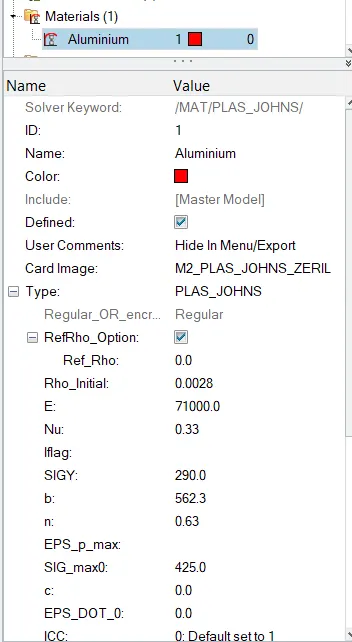
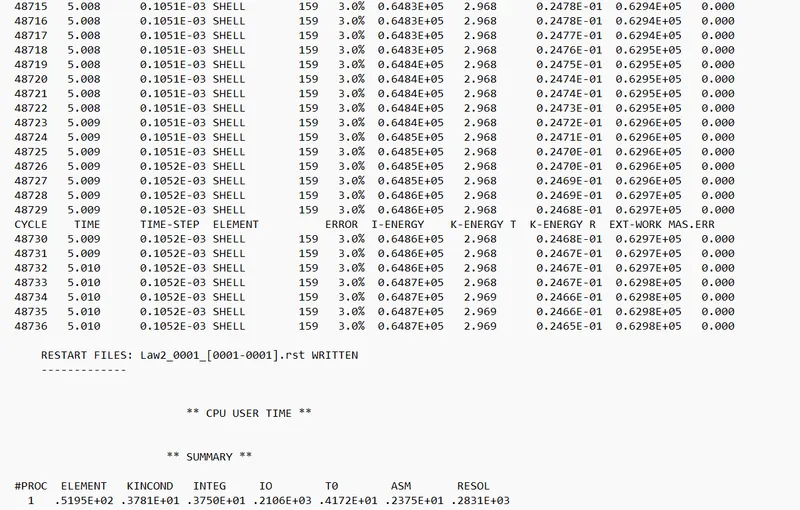
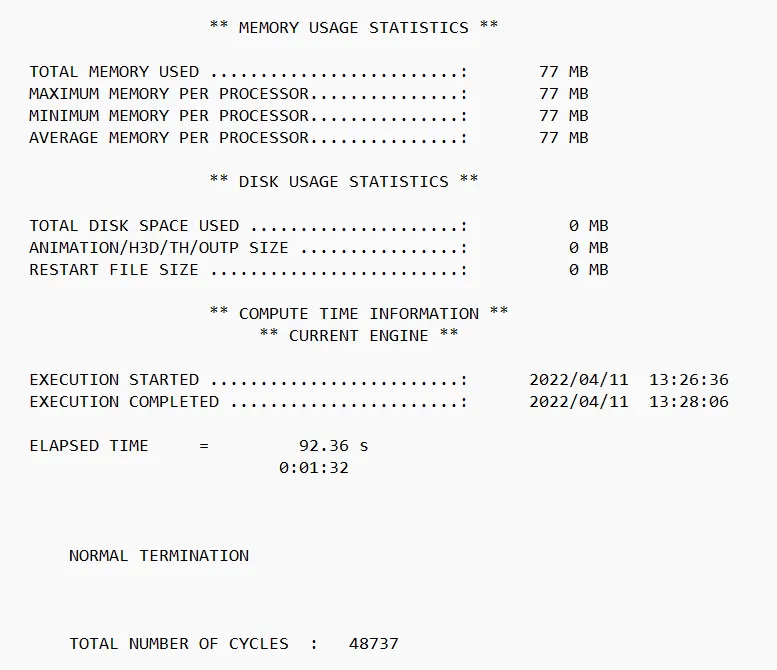
In this case, the energy error is reaching up to 3.0% and it is in the acceptable range.
Mass error is zero throughout the simulation.
Open the Hyperview and load the .h3d file to see the animations and plot the Von Mises stress and the plastic strain contours.
Since the errors are in the acceptable range plot the required curves of the simulations in the Hypergraph 2D
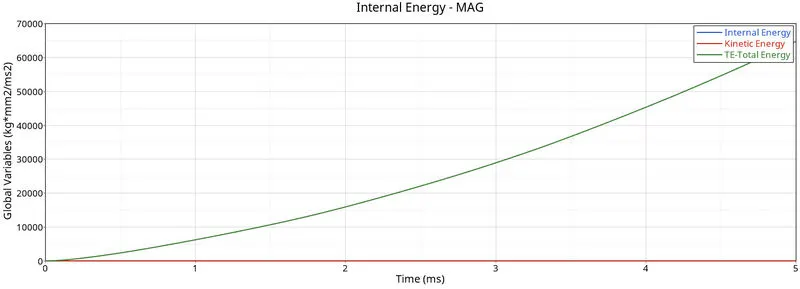
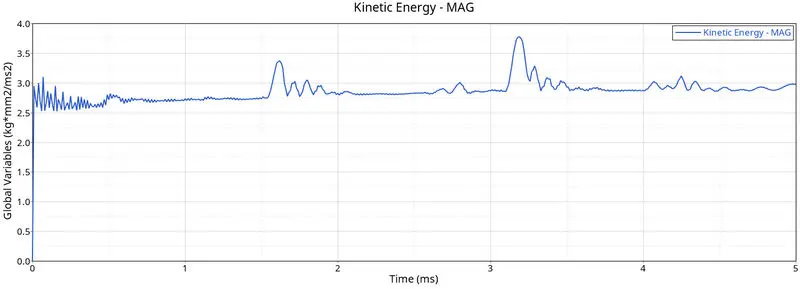
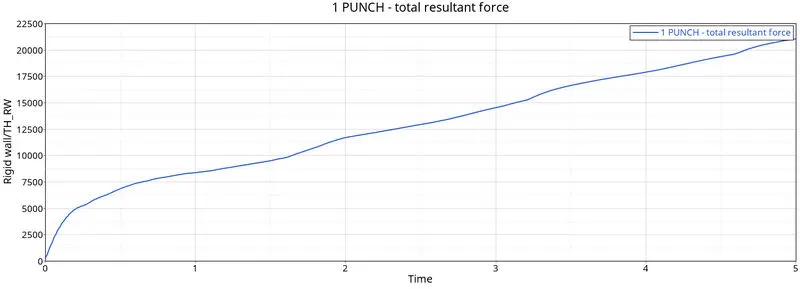
Observations:
- Total number of cycles = 49737
- Energy error = 3.0%
- Mass error = 0
- Simulation time = 92.36 s
- Maximum Stress = 424.7 MPa
- In this case, the elements are not failing because of the absence of a failure card as well as the EPS_p_max value is set as zero( Default value 10^30).
- Energy is increasing linearly throughout because the elements are not deleted.
- Kinetic energy is too low compared to the previous cases.
- Rigid wall force is also increasing because of the same reason.
CASE 5
Change Law2(elastoplastic material) to Law1( Linear elastic material) with the same values of E, Rho, and Nu.
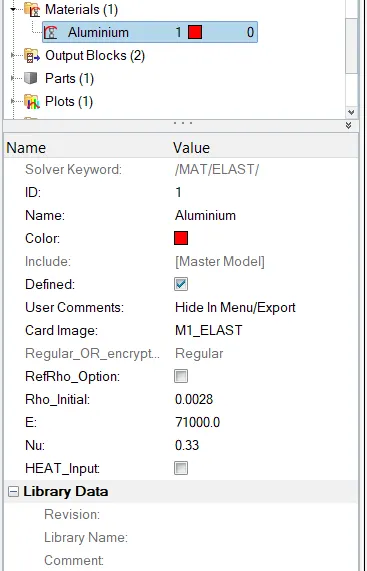
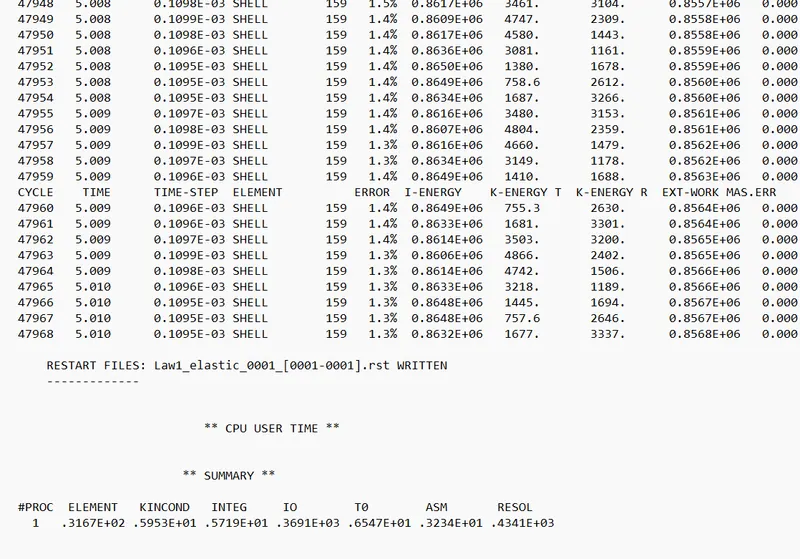
In this case, the energy error is reaching up to 1.3% and it is in the acceptable range.
Mass error is zero throughout the simulation.
Open the Hyperview and load the .h3d file to see the animations and plot the Von Mises stress and the plastic strain contours.
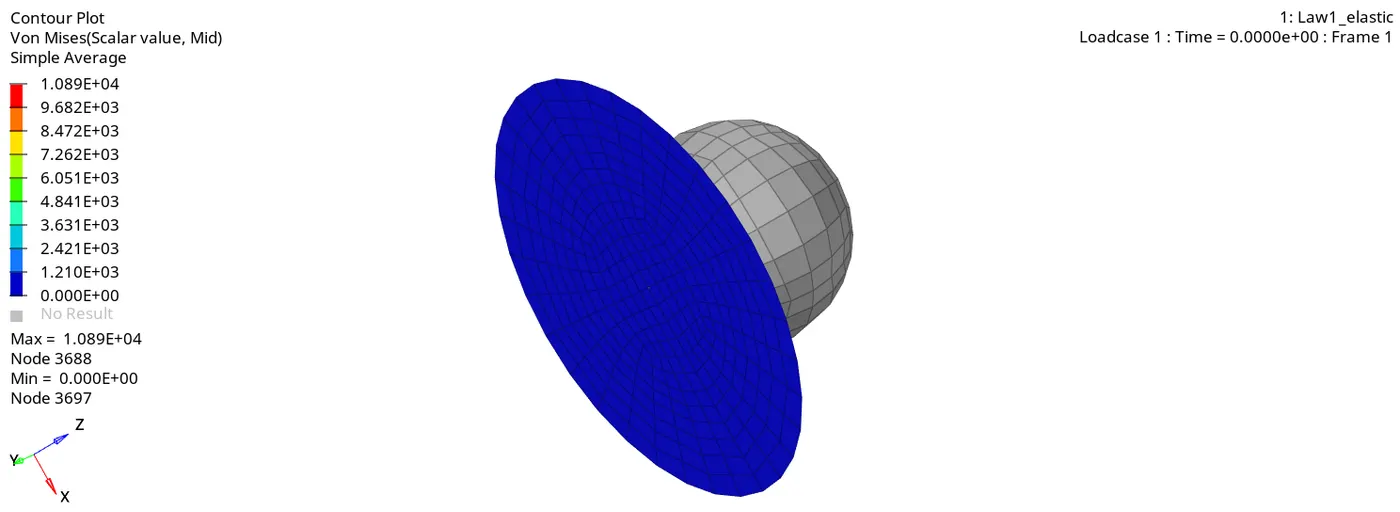
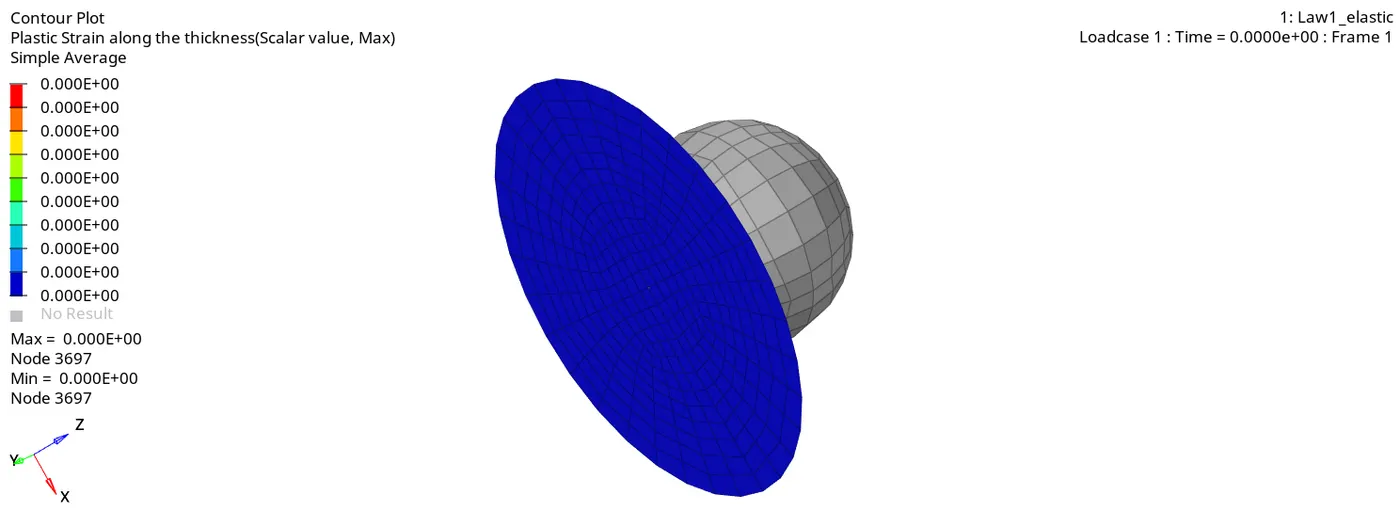
Since the errors are in the acceptable range plot the required curves of the simulations in the Hypergraph 2D
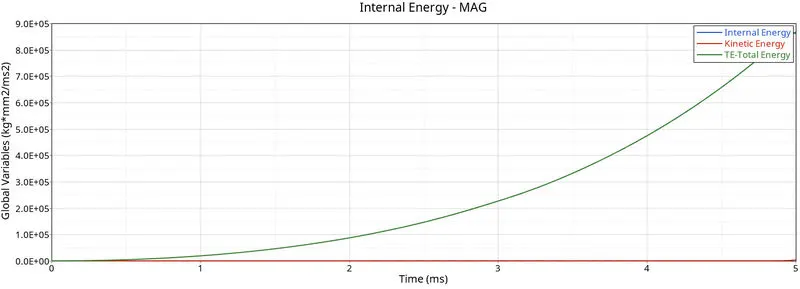
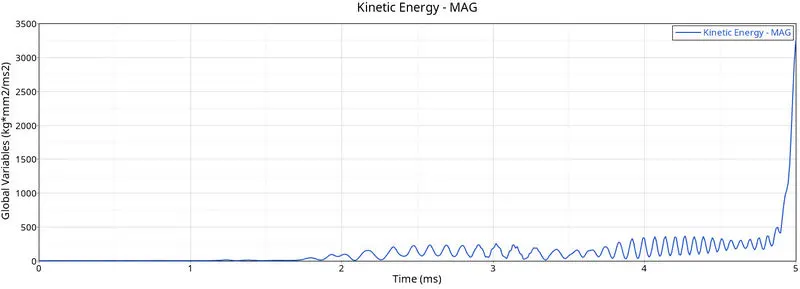
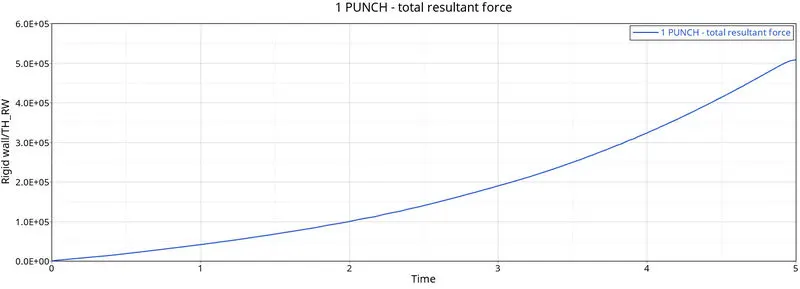
Observations:
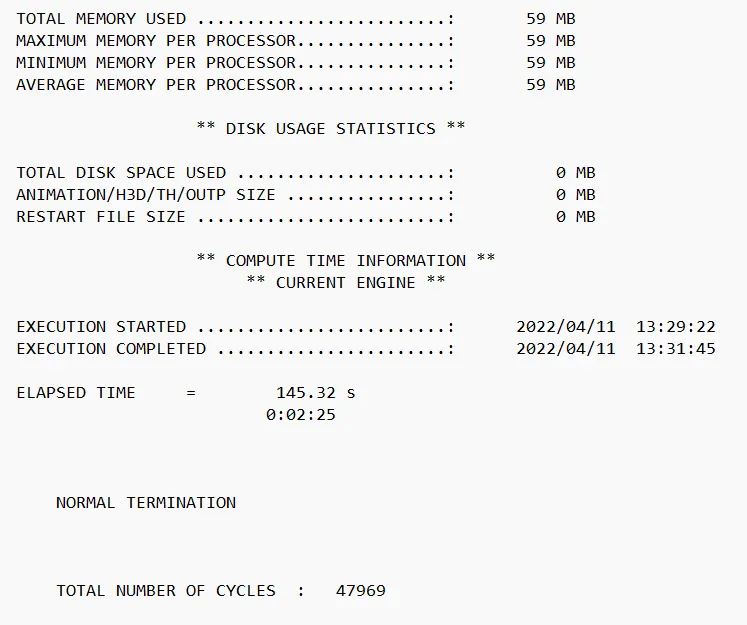
- Total number of cycles = 47969
- Energy error = 1.3%
- Mass error = 0
- Simulation time = 145.32 s
- Maximum Stress = 1089 MPa
- In this case, the elements are not failing because they are not undergoing plastic deformation as the elastic material card is applied.
- Energy is increasing throughout because the elements are not deleted and energy absorption by the elements is too higher in this case.
- Kinetic energy is also high in this case.
- Rigid wall force is also increasing because of the same reason.
CASE 6
Import the given starter file LAW27_0000.RAD file.
Change the properties to recommended properties of shell elements.
This file contains the M27_PLAS_BRIT material card.
This law combines johnson cook's material with the brittle failure method, this law is applicable only to shell elements.
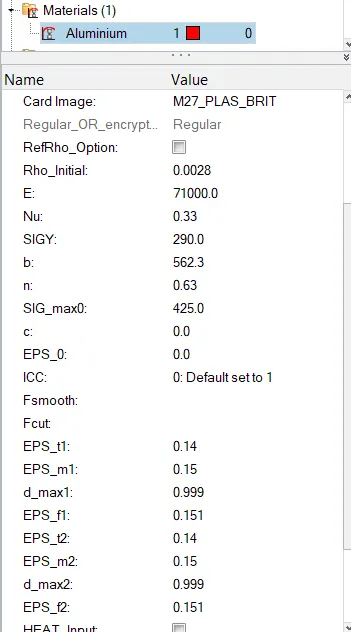
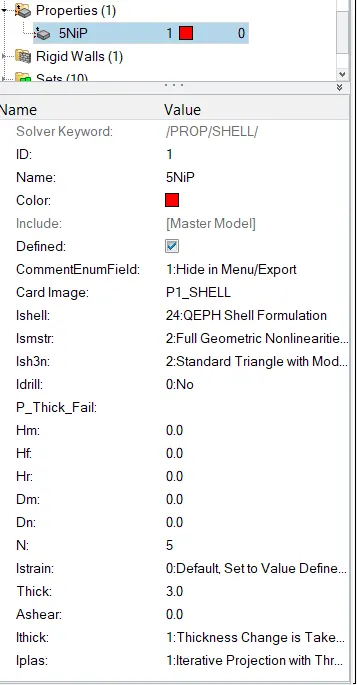
Material card for LAW 27.
where,
EPS _t1 is tensile failure strain at which stress starts to reduce in the principal strain direction 1.
EPS _m1 is the maximum tensile failure strain in principal strain direction 1 at which the stress in the element is set to a value dependent on email
EPS_f1 is a maximum tensile strain for element deletion in principal strain direction 1
dmax1 is the maximum damage factor in principal strain direction 1 which is a default value of 0.999
EPS_t2, EPS _m2 and EPS_f2 are for direction 2.
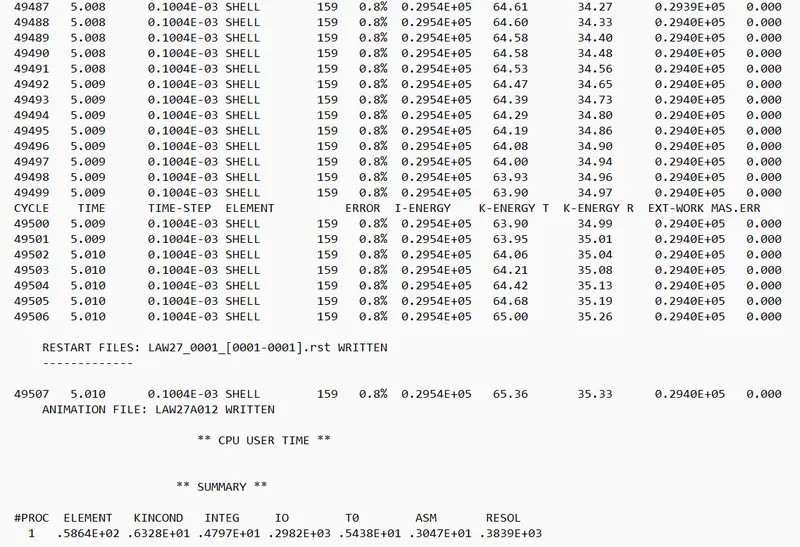
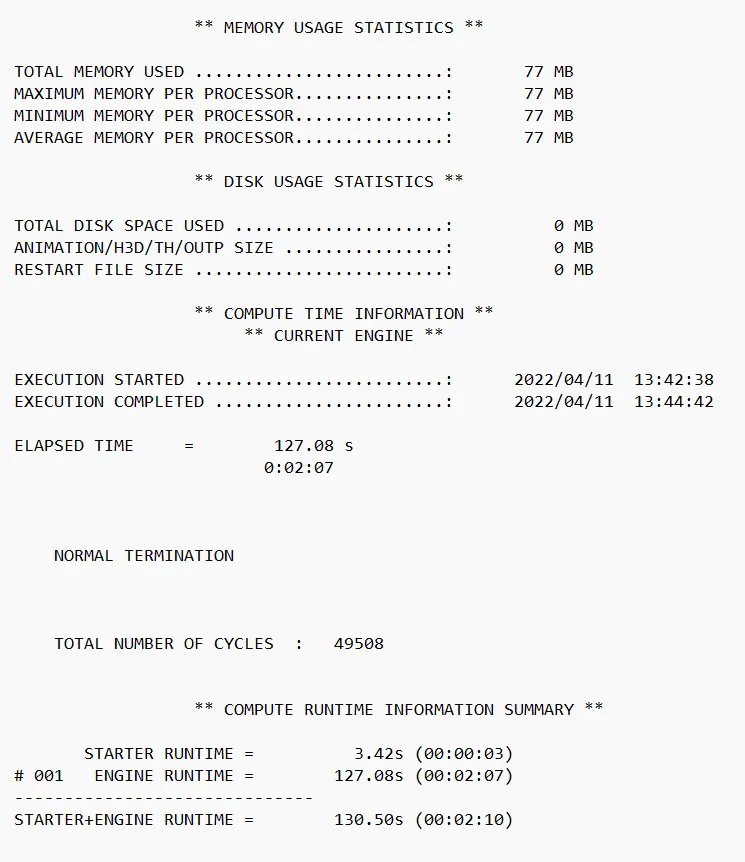
In this case, the energy error is reaching up to 0.8% and it is in the acceptable range.
Mass error is zero throughout the simulation.
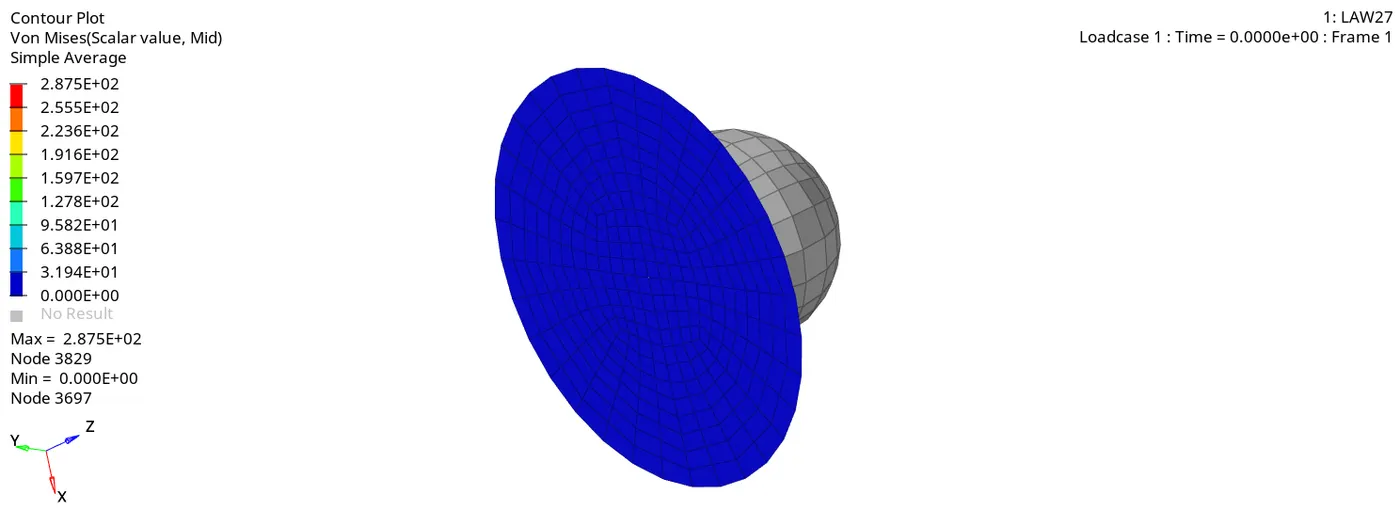
Open the Hyperview and load the .h3d file to see the animations and plot the Von Mises stress and the plastic strain contours.
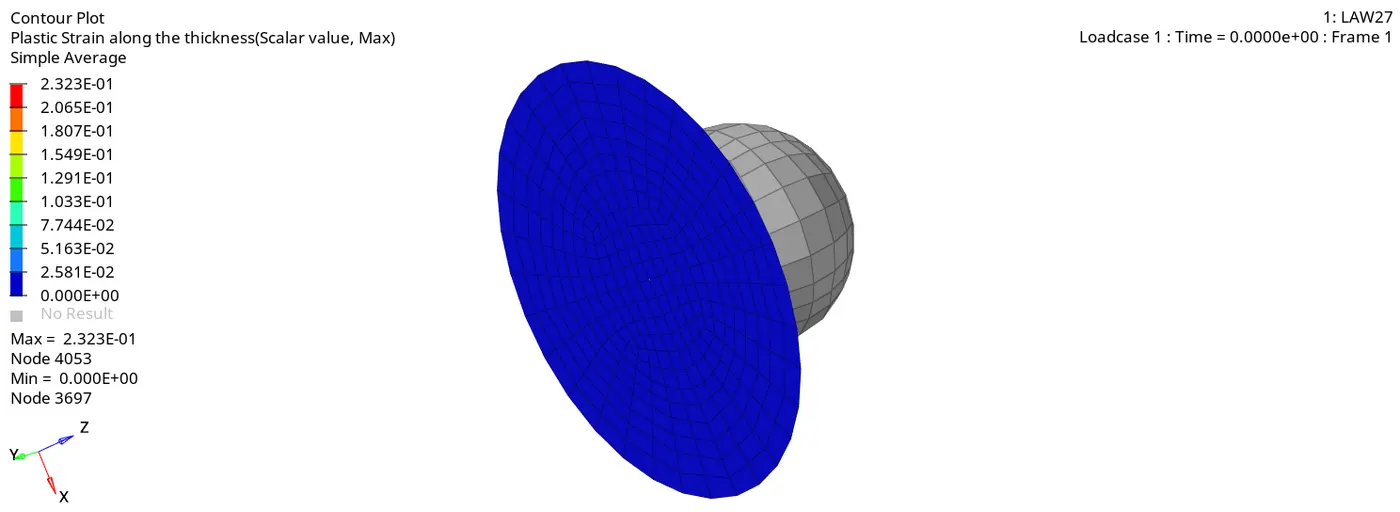
Since the errors are in the acceptable range plot the required curves of the simulations in the Hypergraph 2D
Observations:
- Total number of cycles = 49508
- Energy error = 0.8%
- Mass error = 0
- Simulation time = 127.08 s
- Maximum Stress = 287.5 MPa
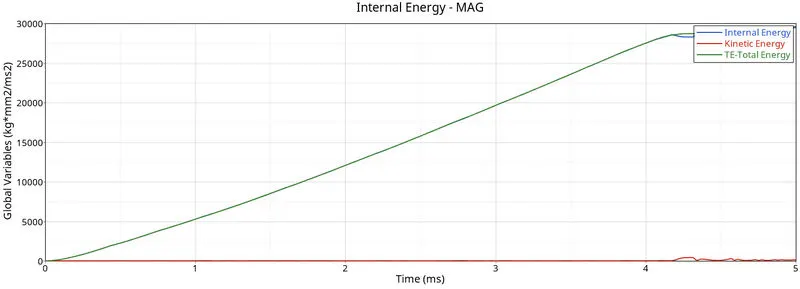
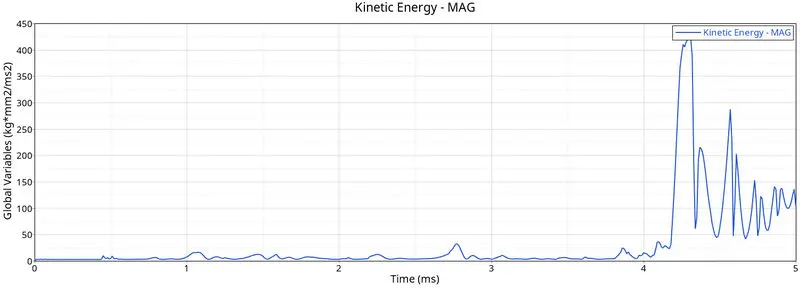
- Energy is increasing linearly with time and then it is flattening at around 4 ms due to the deletion of the elements.
- The maximum value of the stress is 287.5 MPa in this case which is less than the plastic yield value of 290 MPa
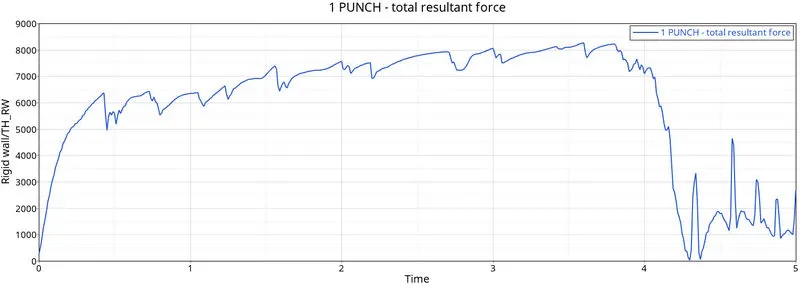
- Because of the deletion of the elements rigid wall force graphs drop at the same time step.
CASE 7
Law 36 is an isotropic elastoplastic material using user-defined functions (curve).
create a curve with to apply in the material model N_funct
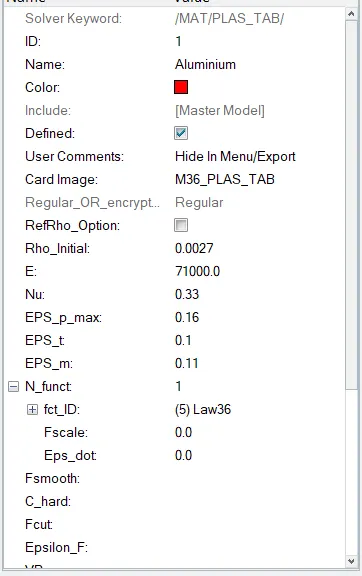
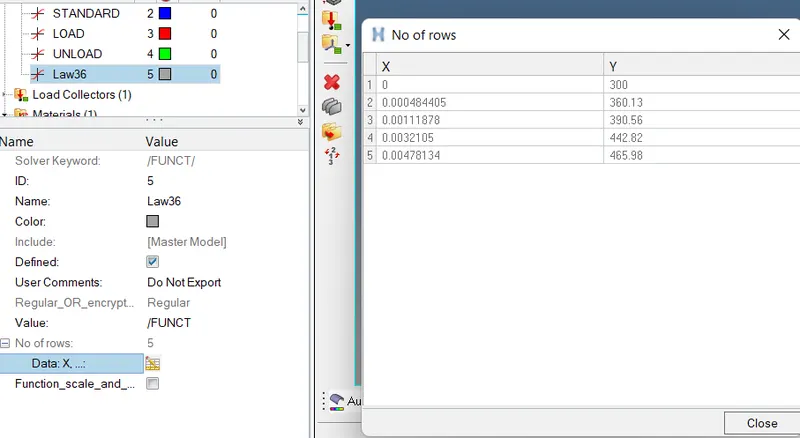
Material card selection and curve selection.
N_funct is the Number of functions that can be between 1 and 100 depending on the requirements of the simulation.
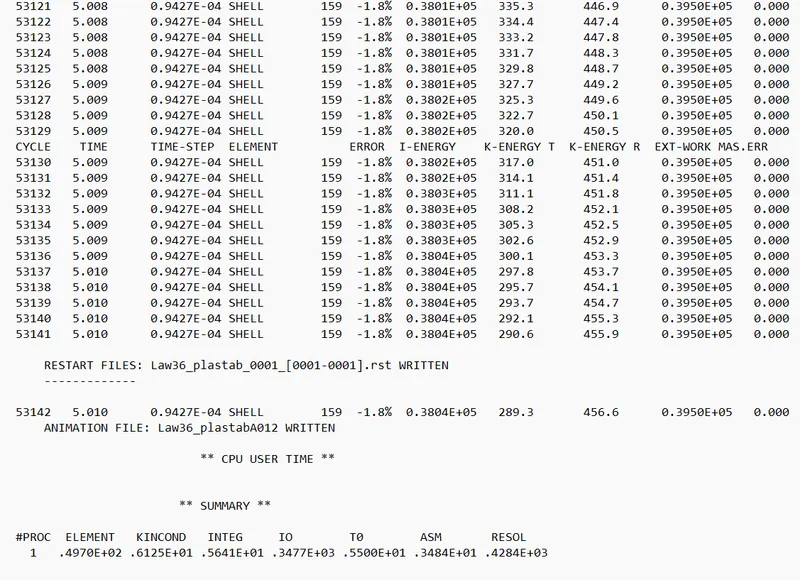
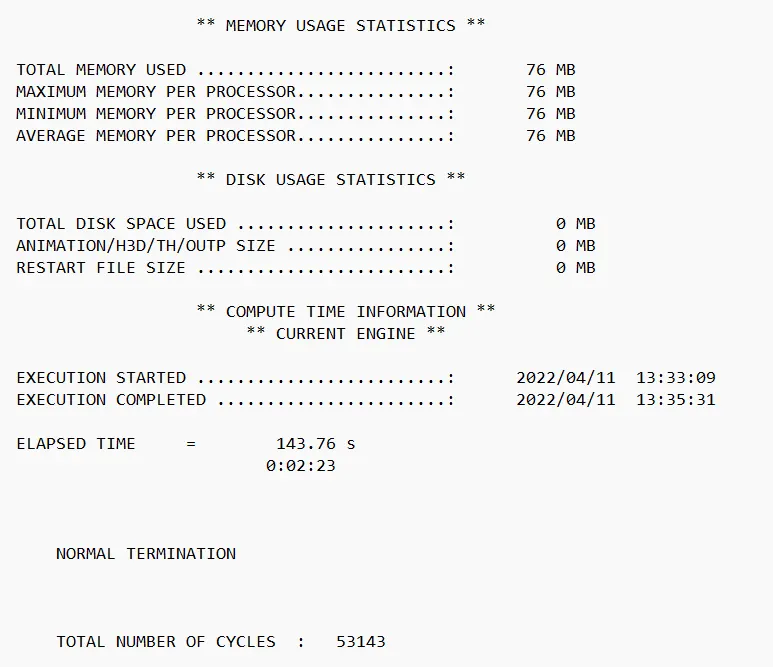
In this case, the energy error is reaching up to -1.8% and it is in the acceptable range.
Mass error is zero throughout the simulation.
Open the Hyperview and load the .h3d file to see the animations and plot the Von Mises stress and the plastic strain contours.
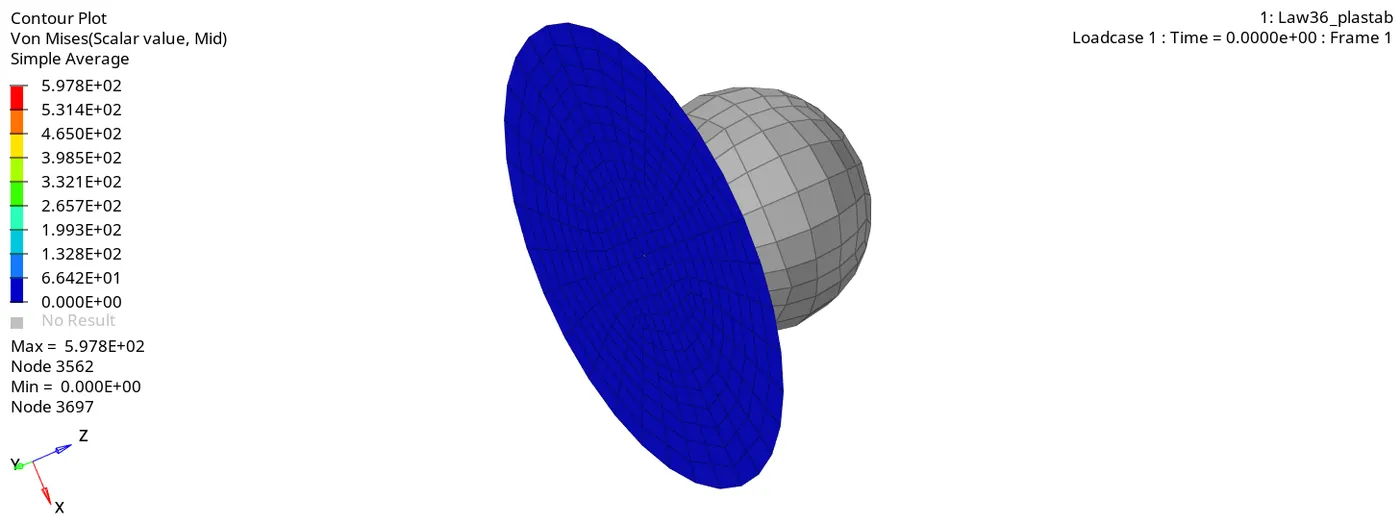
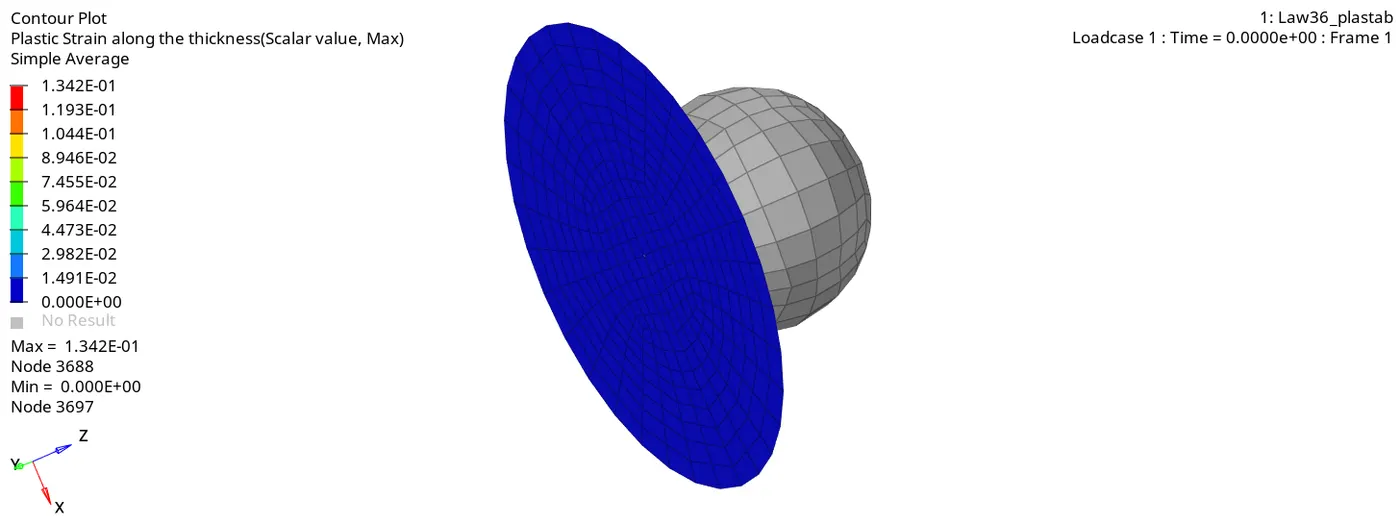
Since the errors are in the acceptable range plot the required curves of the simulations in the Hypergraph 2D
Observations:
- Total number of cycles = 53143
- Energy error = -1.8%
- Mass error = 0
- Simulation time = 143.76 s
- Maximum Stress = 597.8 MPa
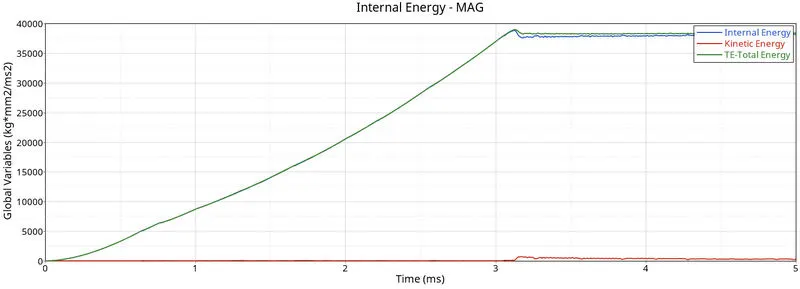
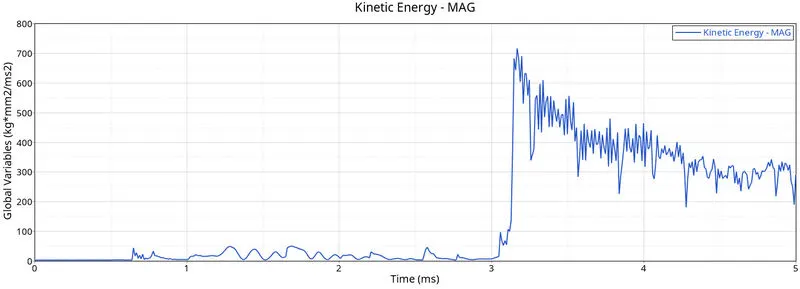
- Energy is increasing linearly with time and then it is flattening at around 3 ms due to the deletion of the elements.
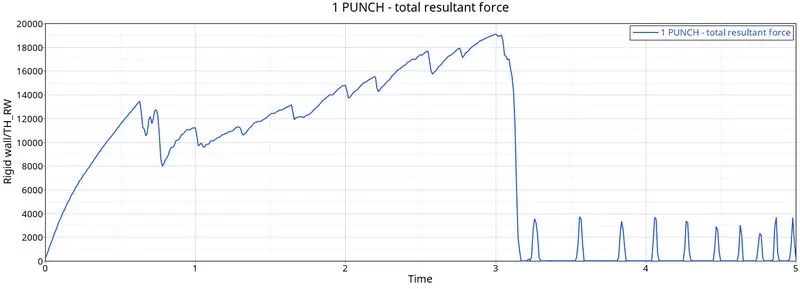
- Because of the deletion of the elements rigid wall force graphs drop at the same time step.
- Material is showing strong brittle behavior the value of strain is very less as compared to the force applied. The stress is localized around the impact it is not dissipating throughout the whole plate.
Comparision
|
Case |
No of cycles |
Energy Error (%) |
Mass Error |
Simulation Time (sec) |
Element Behaviour |
|
Case 1 (Law2_epsmax_failure) |
49380 |
0.8 |
0 |
148.43 |
Deleted |
|
Case 2 (Law2_epsmax_crack) |
49217 |
4.1 |
0 |
200.79 |
Cracks first then deleted |
|
Case 3 (Law2_epsmax_nofail) |
49408 |
0.8 |
0 |
155.80 |
Deleted |
|
Case 4 (Law2) |
48737 |
3.0 |
0 |
92.36 |
Preserved |
|
Case 5(Law1) |
47959 |
1.3 |
0 |
145.32 |
Preserved |
|
Case 6 (Law27) |
49508 |
0.8 |
0 |
127.08 |
Deleted |
|
Case 7 (Law36) |
53143 |
-1.8 |
0 |
143.76 |
Deleted |
Conclusion:
The simulation has been carried out in the given model by applying different material and failure cards Von mises stress and plastic strain animations have been recorded for each case and various curves were also plotted to study the behavior of the elements in the different scenarios. Based on the observation of the results: case 7 represents the best on-field scenario in the simulation because the animation is more practical than in other cases and in Law 36 we can define the stress-strain curve and then we can decide where the material is failing.