Assignment 4
Assignment 4
AIM : The aim of this assignment is to compare different material laws and failure laws. It also involves the study of the reasons behind the element deletion as well as cracking of the elements.
Case 1 : Law2_eps_max failure
- This model involves the simulation of the model given as it is.
- Material Law : MLAW2_PLAS_JHON
- Failure Law : FAIL_JOHNSON
- Properties : Recommended properties.
- When the simulation is run according to the given properties the simulation looks as given below.
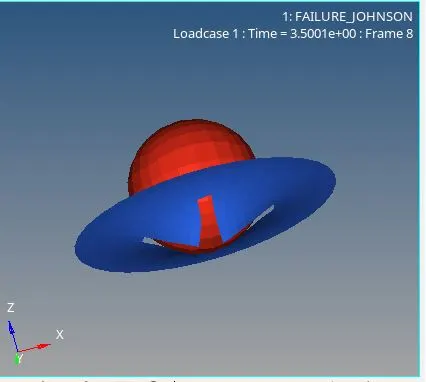
- If we observe the failure Johnson card we see that the model is not using XFEM formulation.
- As a result the elements are getting deleted and there is no crack observed.
- According to the Material law if reaches then the element (shell) will get deleted.
- So we can see in the simulation the elements for which the strain exceeds the limit they get deleted.
- This is shown in the simulation the elements are getting strained and the are getting deleted.
Case 2 : Law2_epsmax_crack
- This case changes few parameters in the failure criteria. We still use the same properties and the same failure criteria.
- Material Law : MLAW2_PLAS_JHON
- Failure Law : FAIL_JOHNSON
- Properties : Recommended properties.
- Few properties of the failure criteria are changed, they are indicated below.
- Ifail_sh = 1, This indicates that our shell is deleted or cracked when D exceeds value 1 for one integration point or layer.
- Dadv = 1 , This allows crack advancement. It is used when an existing crack reaches an element.
- Ixfem = 1, This allows failure through element crack. If the strain reaches a certain maximum the element starts to crack up rather than just getting deleted.
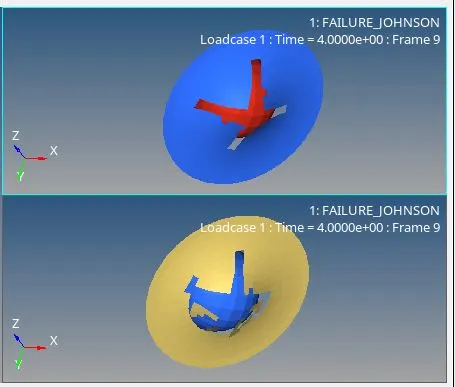
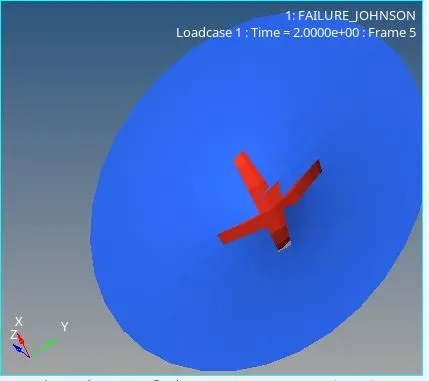
Comparision btw case1&2 initiation of crack(case2)
- We can see from the images that the element cracks and then it propagates.
- As a result of the above changed parameters in the failure model we can see the initiation of the crack and propagation.
- In the picture where internal energy is plotted across time, we can see that the internal energy reaches a value and flats out.
- In case 1 we have our elements deleted if they exceed limiting value. But in case 2 we have the crack propagation.
- That is the reason why we have more internal energy.
Case 3 : Law2_epsmax_nofail
- In this case we have removed the failure criteria.
- The Johnson failure criteria is removed, this removes a lot of parameters through which we control the crack initiation and propagation.
- Material Law : MLAW2_PLAS_JHON
- Properties : Recommended properties.
- The simulation image attached below shows the comparison of the same a material having same properties and even same element formulation but different failure criteria.
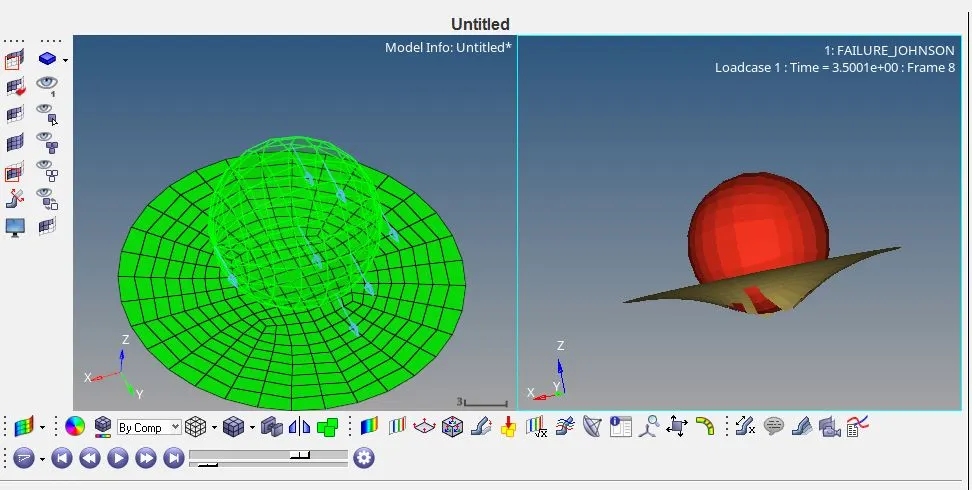
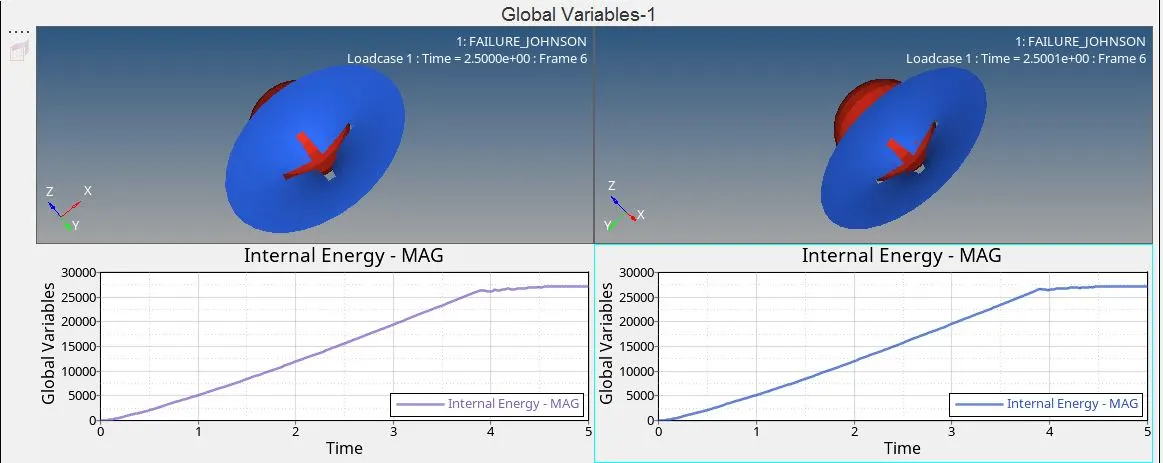
case 3 comparision of case1 and case3
- As the limit is reached the materials starts to vanish as per the material law.
- There is no provision included for crack initiation and the crack growth.
- If we observe the energy plots of case 1 and case 3 we can see there is no significant change in the internal energy.
- This is because both the cases donot have the crack phenomena.
- However the simulation changes because of the presence of the failure Johnson criteria.
- The element deletion in the first case is subjected to both the material law as well as the failure Johnson critetia, where as in the case 3 it is subjected to only the material law that is why we have the variation.
Case 4 : Law2
- The case in which we don’t have a failure criteria and the is zero.
- That is it takes a default value of . This is very high that is why we can see our material is intact.
- Material Law : MLAW2_PLAS_JHON
- Properties : Recommended properties.
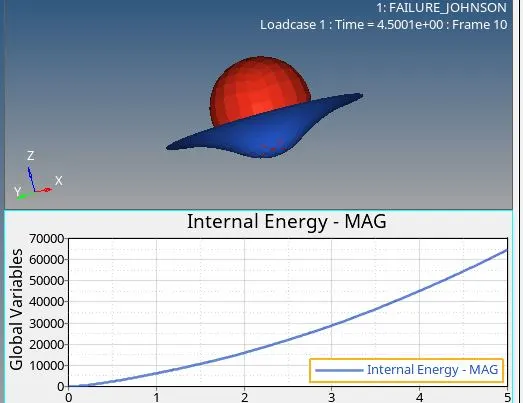
case 4
- All we can see is plastic deformation but no failure.
- We can see this from our energy plot too , the internal energy keeps on increasing.
- Where as in the previous cases it plateaus at a particular point.
- That time is where the material fails.
Case 5 : Law1
- This case involves changing the material property into LAW 1 ie elastic.
- Material Law : MLAW1
- Properties : Recommended properties.
- The properties like E=71000,nu=0.33,rho=0.0027.
- The simulation looks the same with respect to case4.
- But the energy plot suggests different, the material is elastic that is why we have higher internal energy when compared to the previous case.
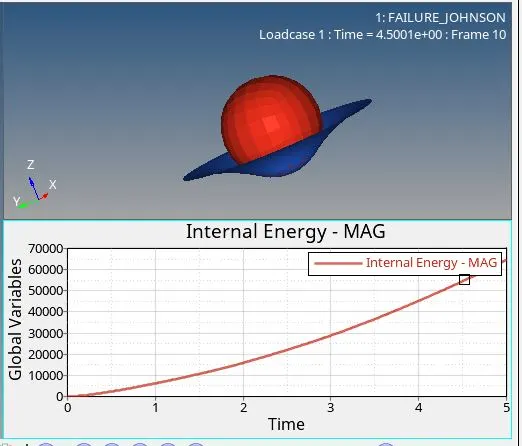
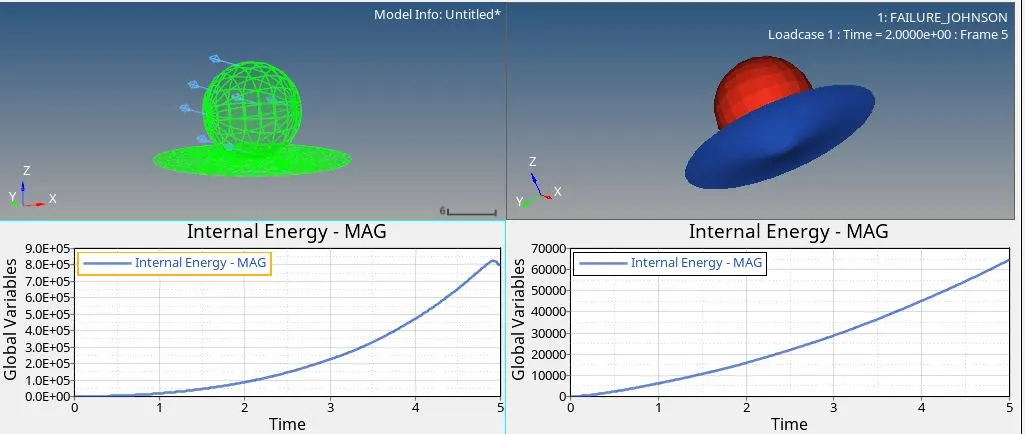
case 5 comparision of internal energy for case 4 & 5
- The results suggest the same.
- The simulation results as well as the energy plots are shown above.
- The internal energy dips at the end suggest that the material is well above its elastic limit.
Case 6 : Law27
- This case deals with a material property LAW 27 which is PLAS_BRIT.
- Material Law : MLAW2_PLAS_JHON
- Properties : Recommended properties.
- The material has isotropic elasto - plastic combined with orthotropic brittle failure.
- Brittle fracture in the two principle directions.
- We can see the material failure through brittle fracture in the simulation.
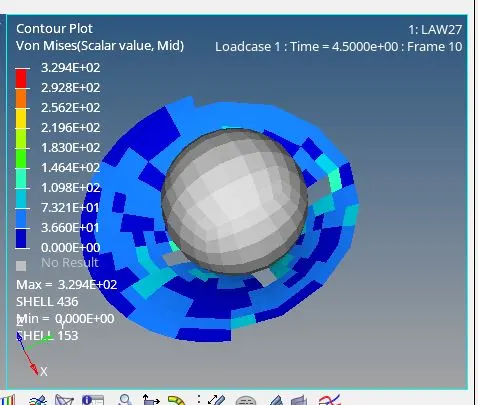
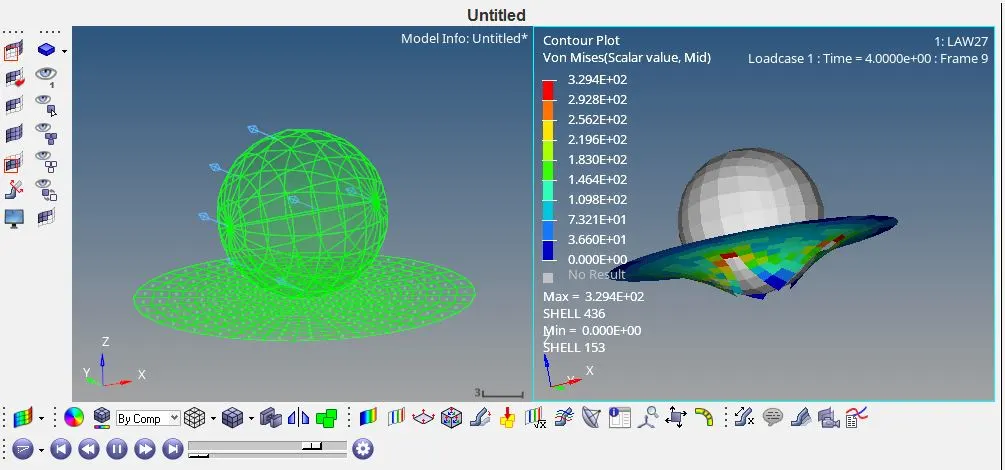
case 6
- The plot show cases the raise in the internal energy with respect to time.
- The outer elements are disappearing at the end of the simulation indicating the elements at the periphery of the plate are reaching the maximum strain limit.
Case 7 : Law36
- This law models elasto-plastic material using user defined functions.
- The required properties are mentioned in the material card given.
- The data is added in the material card and the plot is generated.
- A new material is created and the material image card is given as M36 PLAS_TAB.
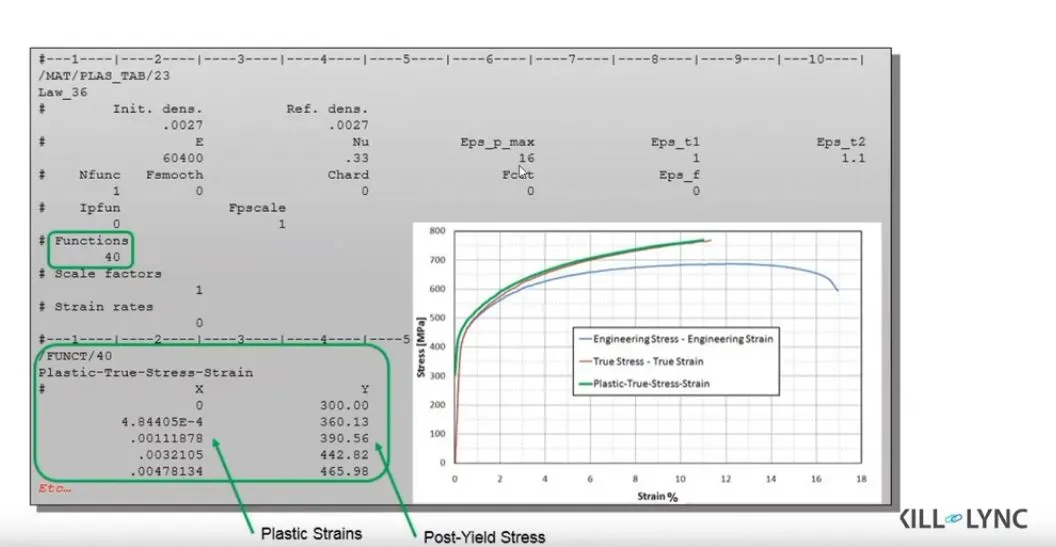
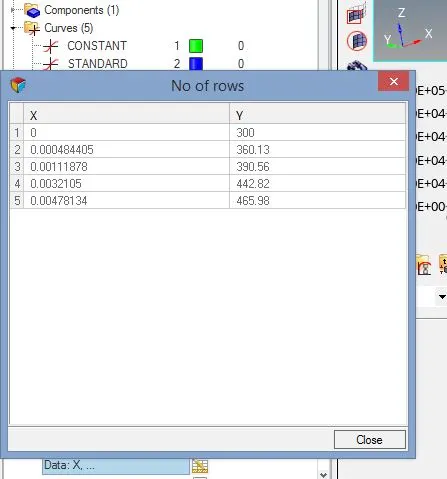
material properties for case 7 test curve to be fit to the material
- A new plot is created in the name of test curve and test curve is assigned to the new material created.
- The properties are filled up according to the recommendations and the material card.
- The simulation and the plot of the energy images are attached below.
- The data we added through the curve represents the power law of the material.
- The material we added deforms plastically and as we have not added any failure criteria elements get deleted.
- The energy plot of the law36 and law 27 are compared.
- As we have a elasto plastic material in law 36 our internal energy curve donot have any sharp turns.
- Where as in the law 27 our failure is brittle and henceforth curve has a sharp turn which is evident in the plots.
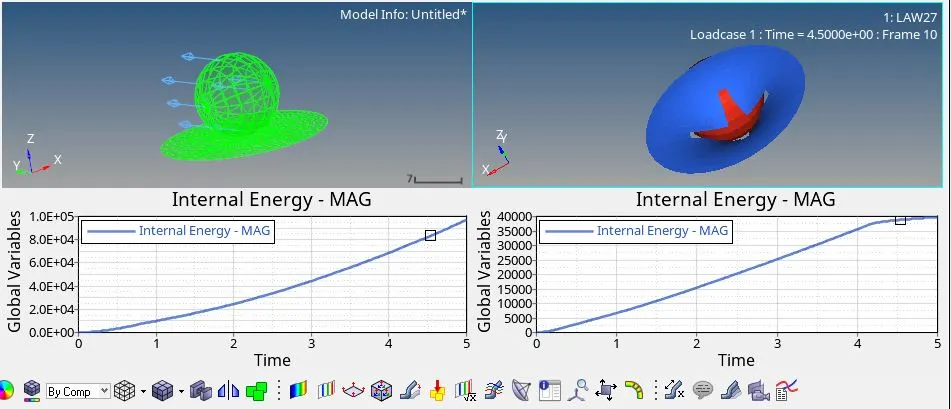
Comparison of the internal energies of case 6 & 7, simulation of case 7.
|
Case |
Energy error |
Mass error |
Number of cycles |
|
Case -1 |
-0.4% to 1.1% |
0% |
49480 |
|
Case-2 |
-0.6% to 5.6% |
0% |
49397 |
|
Case-3 |
-0.6% to 1.1% |
0% |
49405 |
|
Case-4 |
-0.3% to 3.0% |
0% |
48737 |
|
Case-5 |
-7% to 3.6% |
0% |
48850 |
|
Case-6 |
-0.1% to 1.1% |
0% |
49356 |
|
Case-7 |
-0.6% to 0.8% |
0% |
53169 |
- From the tabular form it is clear that the energy error for different cases is different.
- But the mass error is same for all and it remains at zero.
- Mass error corresponds to the additional mass added after each time step to keep it constant.
- If no new mass is added then the mass error remains at zero.
- Coming to the energy error the negative energy error indicates the hourglass effect.
- If the negative energy error doesnot cross the limit -20% it is acceptable.
- The negative energy in all the cases is below the mentioned limit, so it is acceptable.
- The positive energy limit only until 2%, if the error is above the limit then it indicates that an external source is creating the energy.
- We will look into this and the cause of these energies with the help of graphs.
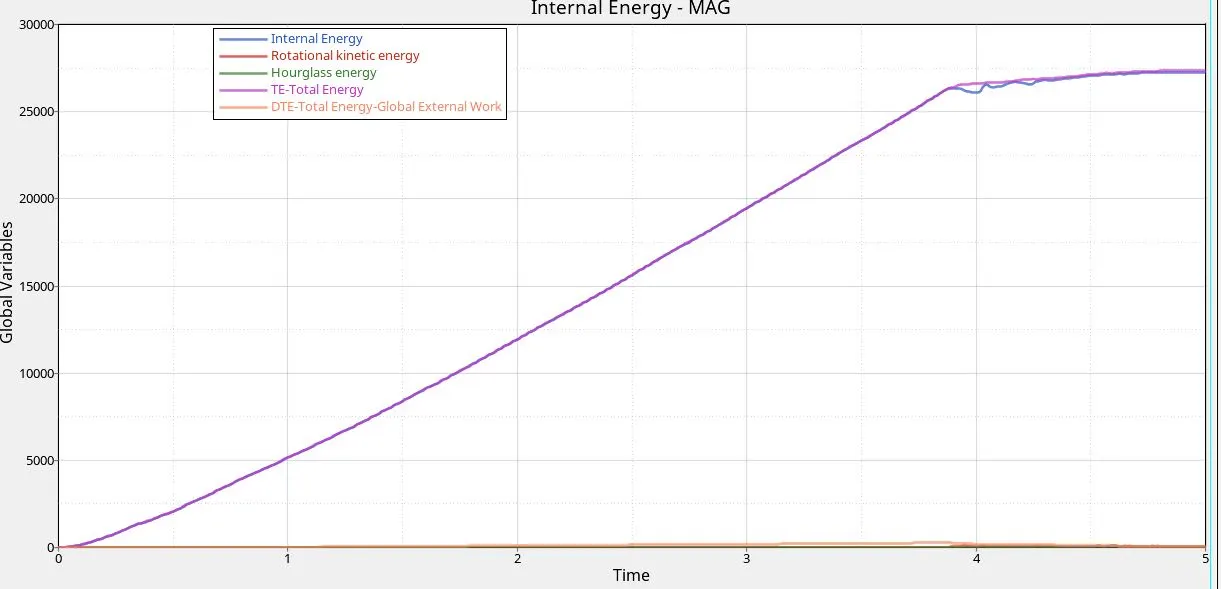
case 1 energy_plot
- If we see energy error towards the positive side is less than 2% and it is acceptable.
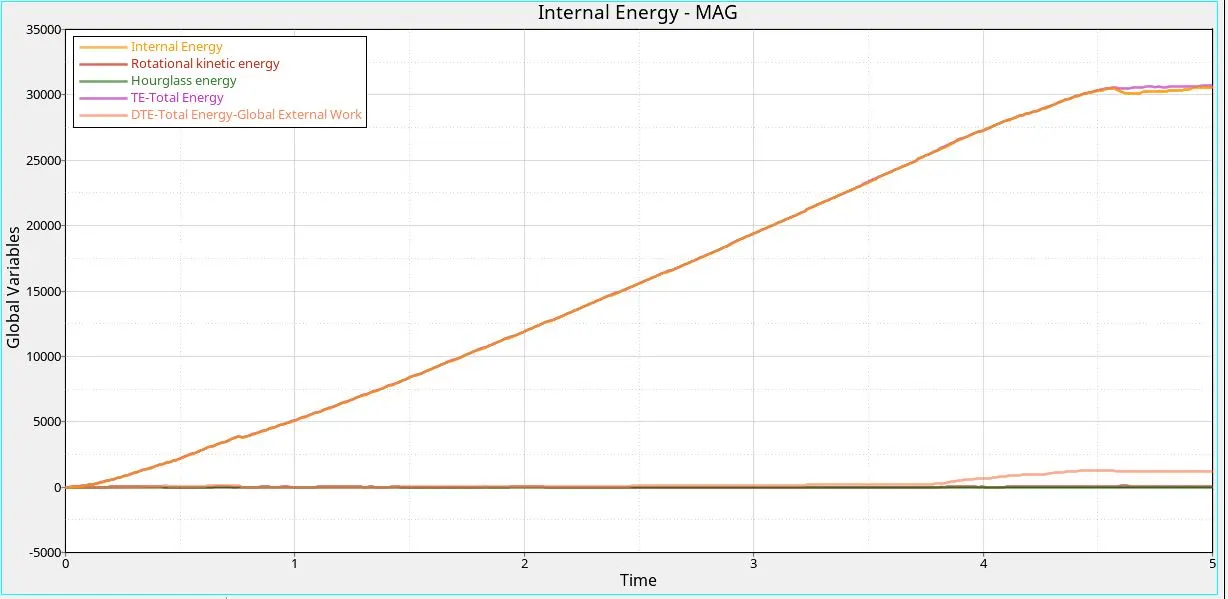
case 2 energy_plot
- For case two we should remind ourselves that we have XFEM formulation, we allowed the crack initiation and propagation as a result when crack forms there will increase in the external energy globally.
- When the crack propagates and the material is completely failed we can that there is a spike in the global external work done.
- Due to this we can see a increased energy error in the output file.
- For case 5 we have the dip in the internal as well as the total work own as the material reaches the plastic deformation stage.
- For case 4 too we can see the increase in the global external workdone as a result the energy error is on the higher side.
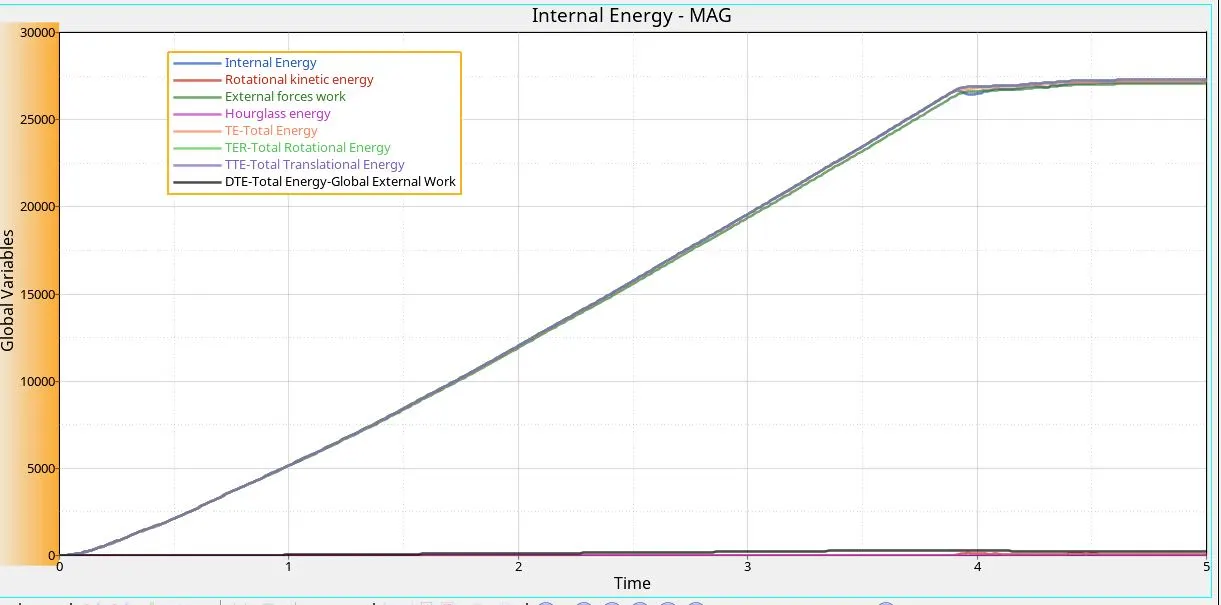
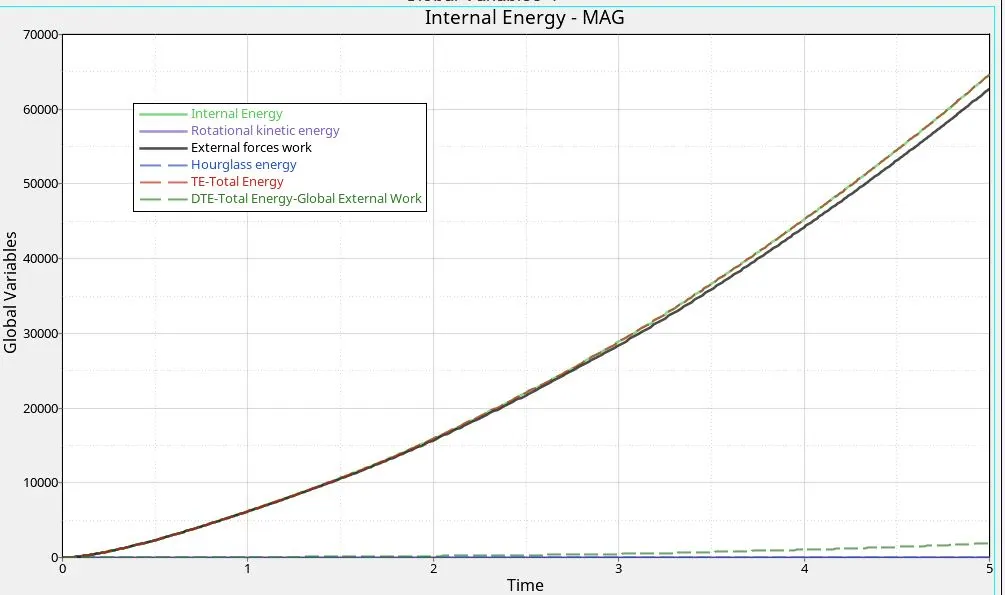
case 3 energy_plot case 4 energy_plot
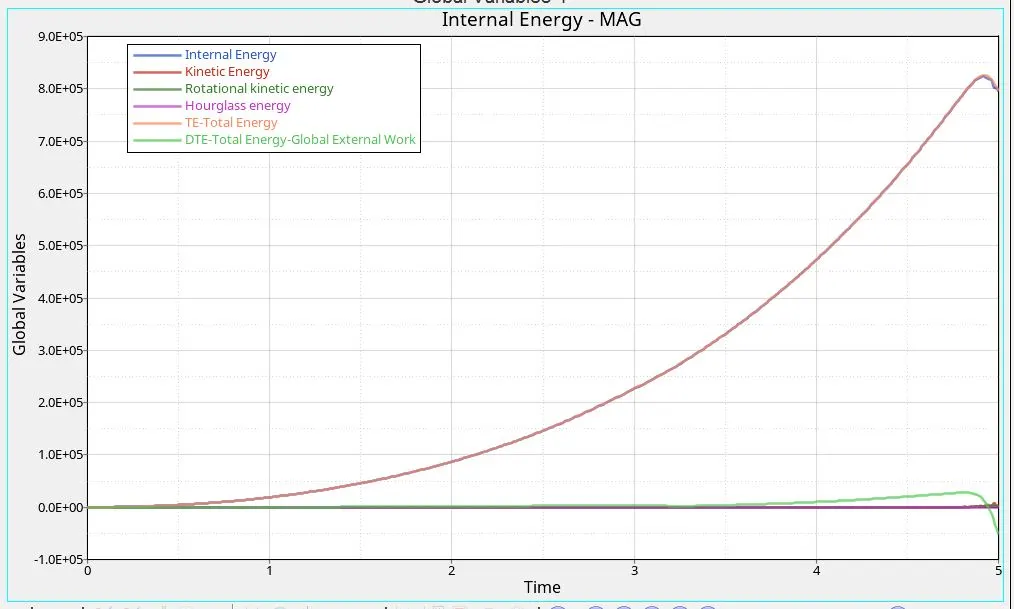
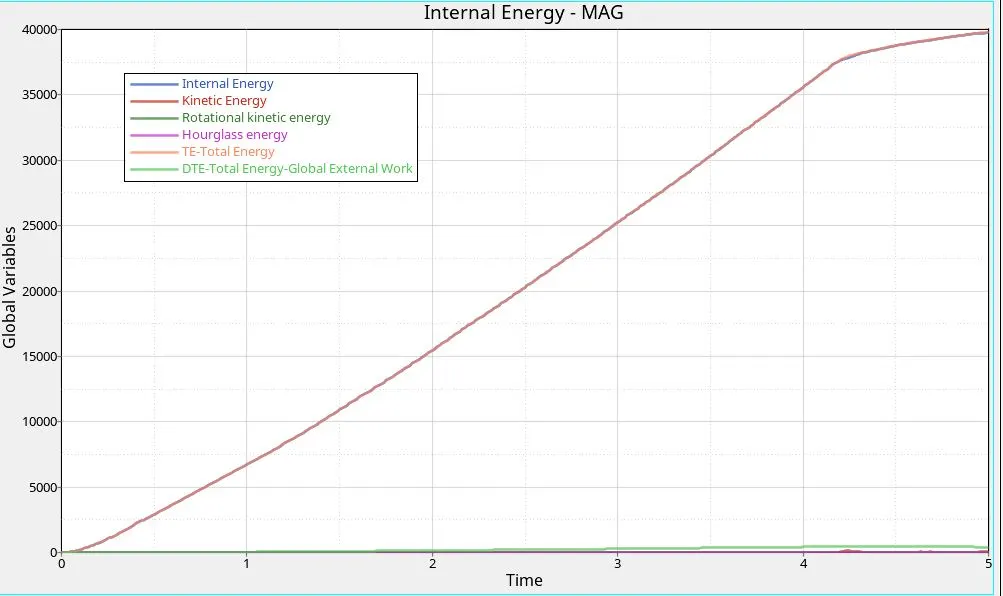
case 5 energy_plot case 6 energy_plot
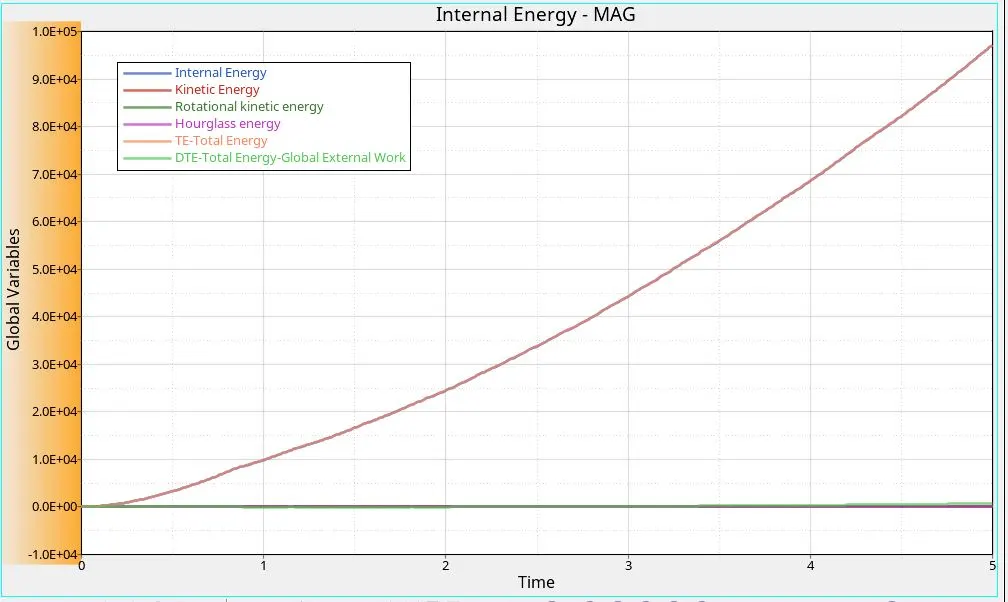
case 7 energy_plot
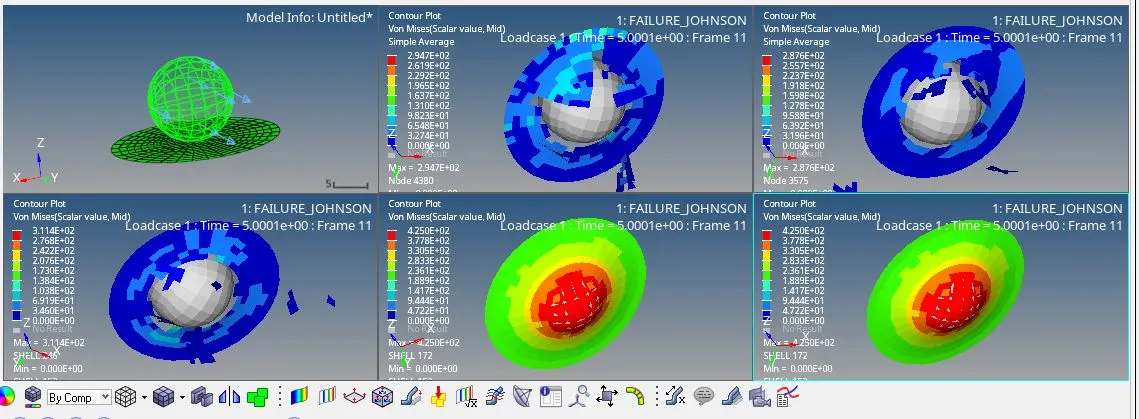
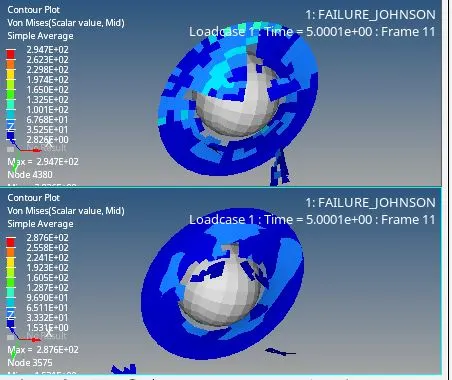
Comparison of the vonmises stresses of cases (1 to 5)
Conclusion:
Based on the above simulations and studies, case 2 that is maxeps_fail_crack is more likely to happen. Because it takes into consideration the fracture as well as the crack propagation.