Comparison of Failure Johnson Material Model Law1, Law2, Law27 and Law36.
AIM :
To run the simulation for 7 Cases by changing Law1, Law2, Law27, Law36 and Modifying Failure Card, Material Properties and Compare results for all cases.
OBJECTIVE :
Compare 7 cases as discussed in last 3 slides, in a tabulated format on the basis of:
1. To obtain Total number of cycles, Energy error, mass error and simulation time.
2. Notice the animation of all 5 and describe the animations in brief on the basis of whether the elements are being deleted or cracked.
3. To Plot energies and notice any difference.
4. Based on all the results, which case would represent the on-field scenario.
5. To Prepare a ppt/docx and list down case by case result and your conclusion as to why the failure happened.
THEORY :
Mechanical Characterization of Materials :
The typical material test for metal is tensile test. With this test strain-stress curve, yield point, necking point and failure point of material could be observed.
In this Force-elongation curve or engineer stressstrain curve, three points are important:
- Yield point: where material begins to yield. Before yield you can assume material is in elastic state (the Young's modulus E could be measured) and after yield, material plastic strain which is non-reversible. Some material in this test will first reach the upper yield point (R ) and then drop to the lower yield point (R ). In engineer stress-strain curve, lower yield stress (conservative value) could be taken. Some material can not easily find yield point. Take the stress of 0.1 or 0.2% plastic strain as yield stress.
- Necking point: where the material reaches the maximal stress in engineer
stress-strain curve. After this point, the material begins to soften. - Failure point: where material failed.
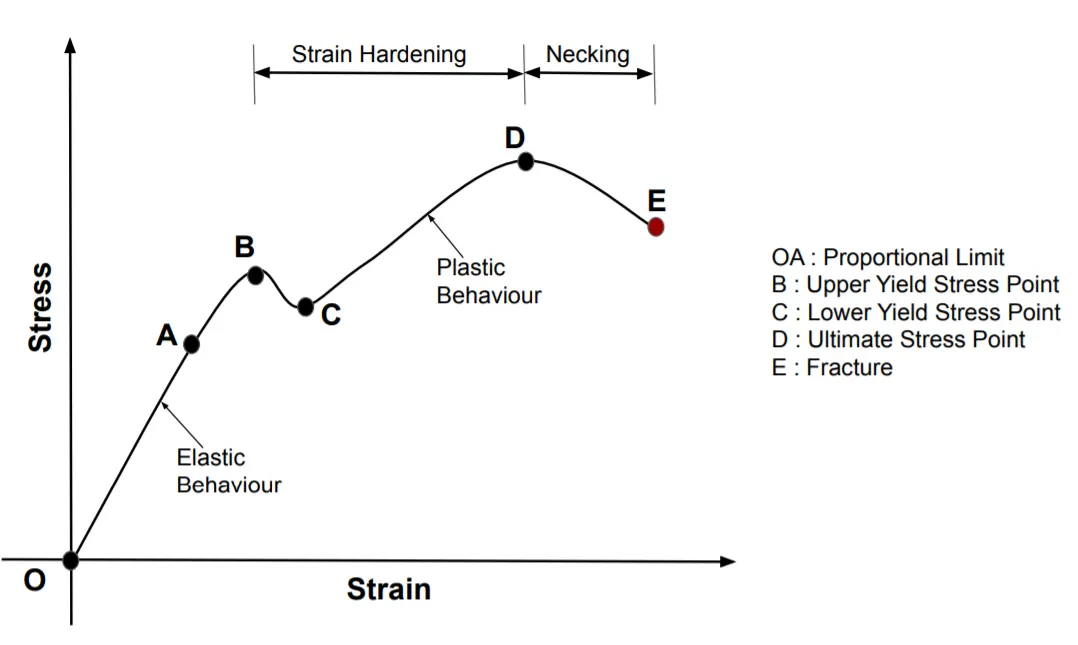
Fig : Stress-Strain Curve
LAW1 (M1_ELAST) Linear Elastic Material
In Law1( /MAT/ELAST) defines an isotropic, linear elastic material using Hooke’s law. This law represents a linear relationship between stress and strain. It is available for truss, beam (type 3 only), shell and solid elements. This material law is used to model purely elastic materials. The material stiffness is determined by only two values: the Young’s modulus (E), and Poisson’s ratio (Nu). The shear modulus (G) can be computed using E and Nu:
`G = E/(2(1+Nu))`
LAW 2(PLAS_JOHNS) Johnson Cook Material :
This law represents an isotropic elasto-plastic material using the Johnson-Cook material model. This model expresses material stress as a function of strain, strain rate and temperature. A built-in failure criterion based on the maximum plastic strain is available.In this model the material behaves as a linear-elastic material when the equivalent stress is lower than the plastic yield stress. For higher stress values, the material behavior is plastic, and the true stress is calculated as:
`nbsp; `sigma=(a+bepsi_p^n)(1+cln(epsi^*/epsi_o))(1-T^*)^m)`
Where,
`epsi_p` - Plastic Strain,
`epsi^*` - Strain rate,
- When `epsi_p` reaches the value of `epsi_p_max` in one integration point, then based on the element type:
- Shell elements: The corresponding shell element is deleted.
- Solid elements: The deviatoric stress of the corresponding integral point is permanently set to 0; however, the solid element is not deleted.
- The plastic hardening exponent, n must be less than or equal to 1.
- The strain rate has no effect on truss elements.
FAILURE_JOHNSON :
Using the Johnson-Cook failure model /FAIL/JOHNSON along with the Johnson-Cook material model provides more user control of the failure Johnson-Cook failure strain definition:
`epsi_f=[D_1+D_2exp(D_3sigma^*)][1+D_4ln(epsi^**)][1+D_5T^*]`
Where,
`sigma^*=(sigma^m/sigma^(vm))`
`epsi^**=(epsi^*/epsi_o)`
In XFEM formulation (Ixfem=1) is only compatible with BT Q4 (Ishell=1, 2, 3 or 4), and QEPH (Ishell=24) shell elements. If XFEM is activated (Ixfem=1), the failure criteria will lead to element cracking instead of element or layer deletion.
Two different failure (rupture or crack) are introduced in this failure model. The failure criteria is calculated, as:
- Element rupture (Ixfem=0):
Element rupture (deleted) if D > 1
- Element crack (Ixfem=1):
Element cracked, if:
-this element has no failed neighbors and D > 1, then in this case, new crack initialization in element.
-this element has failed neighbors and D > Dadv, then in this case, crack advanced and Dadv is used for crack advancement. Dadv will be used if existing crack arrives to a boundary of an element.
-Element deleted, if a second crack arrives to the same element.
- Dadv should always be less than 1
LAW36 (PLAS_TAB) Elastic Plastic Piecewise Linear Material :
This law models an isotropic elasto-plastic material using user-defined functions for the workhardening portion of the stress-strain curve (for example, plastic strain vs. stress) for different strain rates. Note: The first point of yield stress functions (plastic strain vs stress) should have a plastic strain value of zero.
In order to avoid poor curve extrapolation during the strain calculation, a dummy curve defined for a high strain rate value can be added in the model—typically the highest strain rate curve is repeated. The curves have to be defined such as they don’t intersect themselves in the strain range being used. Otherwise the calculation may fail.
There are 4 damage and rupture parameters:
- εp max is the maximum plastic strain for element deletion for any loading (tensile , shear or compression).
- εt is the beginning of tensile damage. From this point the stress value defined in the curve is reduced by the factor where ε1 is the largest principal strain
- εm is the end of the tensile damage. The stress value is null but the element is not deleted
- εf is the tensile failure strain value for element deletion
LAW27 (PLAS_BRIT) Elasto-Plastic Material with Brittle Failure
- This law combines an isotropic elasto-plastic Johnson-Cook material model with an orthotropic brittle failure model. Material damage is accounted for prior to failure. Failure and damage occur only in tension. This law is applicable only for shells.
- In this model, the material behaves as a linear-elastic material when the equivalent stress is lower than the plastic yield stress. For higher stress values, the material behavior is plastic and the stress is calculated as.
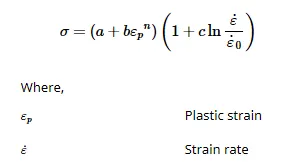
- The plasticity hardening exponent, n must be less than 1.
- Useful for modeling brittle failure of glass
- Yield surface definition same as Johnson-Cook (Law2)
- Damage and rupture defined with 4 parameters for each principal dir
Energy Error & Mass Error :
Energy Error must be negative and decreasing (except for the first cycles or in spring back stage). The error must be less than 15% at the end of the computation(5% for a good model). If the error increases a little and then decreases may be normal. If the error increases, this means that problem has occured. Then the error may grow to 99.9% with computation failure message. So ideally the error should be at most -15% and better to have -5%. Mass error must be very low, error value from (0-1) is better.
PROCEDURE :
CASE - 1 :
1. Import the given FAILURE_JOHNSON_0000 rad file using Radioss in Hypermesh.
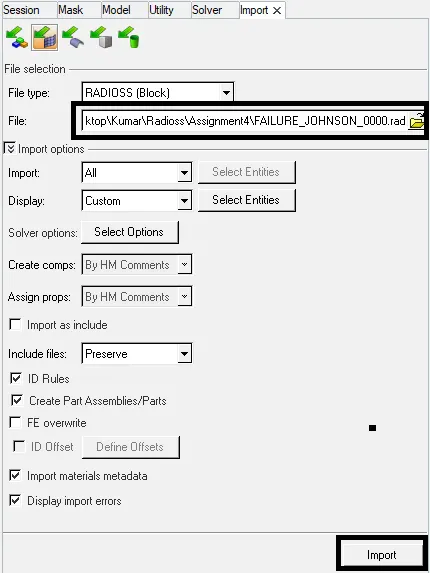
Fig : Importing Model
2. After Importing the model, Run the Simulation by keeping default Material properties as it is.
3. Go to Analysis-->Radioss option and Save the input file in new folder and set options and run the simulation.
4. After that, Go to the Folder which Simulation file has been saved and Open the FAILURE_JOHNSON_0001.out File and Check the Energy Error, Mass Error, Total Number of Cycles and Simulation Time
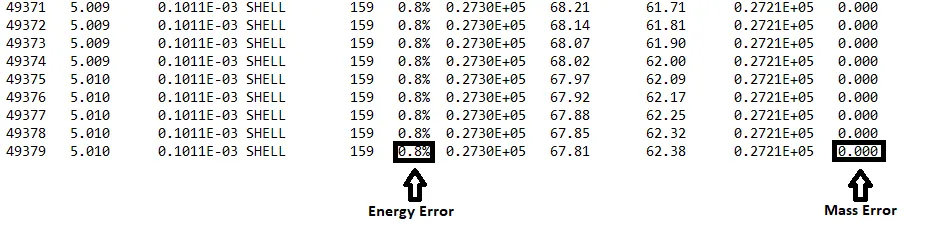
Fig : Energy Error,Mass Error, Total Number of Cycles, Simulation Time
5. In this Case Energy Error is 0.8% and Mass Error is 0%. Total Number of cycles for this simulation is 49380 and Total Simulation time taken as 57.94s.
6. Change Hypermesh into HyperView and load the FAILURE_JOHNSON.h3d model file and Click Apply.
7. Select the Contour icon and set Result type as Vonmises stress and click Apply
8. After Plotting The Vonmises stress contour plot, Change HyperView into HyperGraph 2D to plot the Energy as a function of time.
9. Load the time history file FAILURE_JOHNSONT01 file.
10. Select the Y-type,Y-Request and Y-Component as Global Variables-->Internal Energy, Kinetic Energy,Contact Energy,Hourglass Energy,Total Energy-->Mag and click Apply.
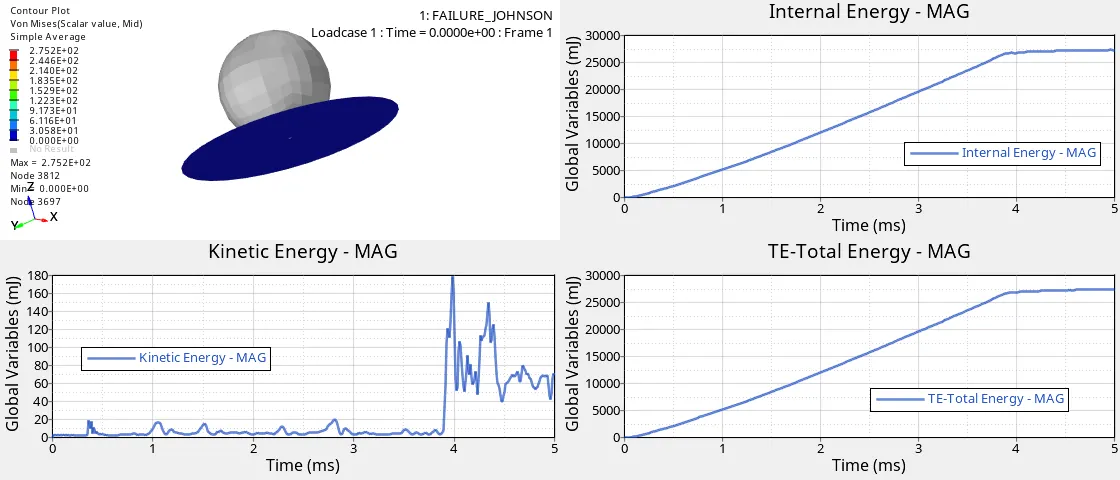
Fig : Vonmises Stress Contour Plot and Energy Plot for Case-1
10. From the above plot we observed that,
- In Vonmises Stress Contour, Rigid ball is impact on Aluminium Plate which maximum stress 2.752E+02 Mpa is applied.
- While Rigid ball is impact on the Aluminium Plate, Internal Energy starts to gain energy of the system due to changes in its internal state and there is no Kinetic Energy will be created of the system at the time of start. In Material Law2(Elasto-Plastic Material) Using Ixfem=0, element will be deleted after reaches the rupture criteria , no stress will be applied on the Aluminium Plate and Internal Energy will rise upto 27000 mJ and become constant. Because its loses its Elasticity and Changed into Plastic region.
- Based Reference Strain Rate(`epsi_o`) in Failure Card, Elements starts to fail and there is no deformation will occur and elements starts to scatter and that scattering elements possess some Kinetic Energy and it will be high (180 mJ) during the start time of element deletion.
- We know that Total Energy is the sum of all Energy, Whenever Kinetic energy losses & Internal Energy gains, Total energy should be stable. But in this case There is less Kinetic Energy is created during deformation. So Total Energy is (27180 mJ), it is similar to Internal Energy.
CASE-2 :
1. In case-2, Use the same FAILURE_JOHNSON_0000 rad file and Go to the Failures and Change Ifail_sh = 1, Dadv = 1 and Ixfem = 1 in Failure_JOHNSON_1 card.
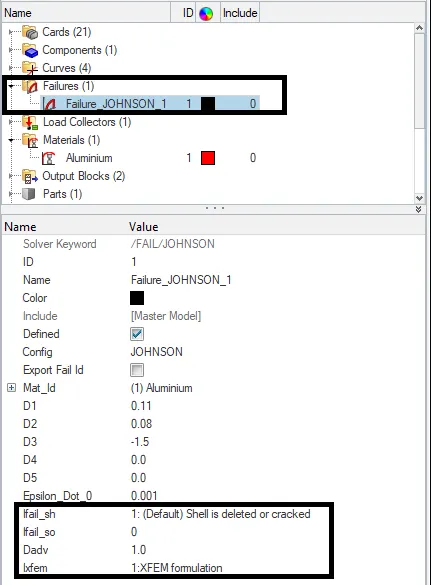
Fig : Failure Card
2. After that, run the simulation by keeping other parameters as default.
3. Go to Analysis-->Radioss option and Save the input file in new folder and set options and run the simulation.
4. After that, Go to the Folder which Simulation file has been saved and Open the FAILURE_JOHNSON_0001.out File and Check the Energy Error, Mass Error, Total Number of Cycles and Simulation Time.
5. In this Case Energy Error is 4.1% and Mass Error is 0%. Total Number of cycles for this simulation is 49217 and time taken for total Simulation is 65.33s.
6. For Plotting the Vonmises Stress Contour Plot and Energy Plot, Same steps to be followed as per Case-1.
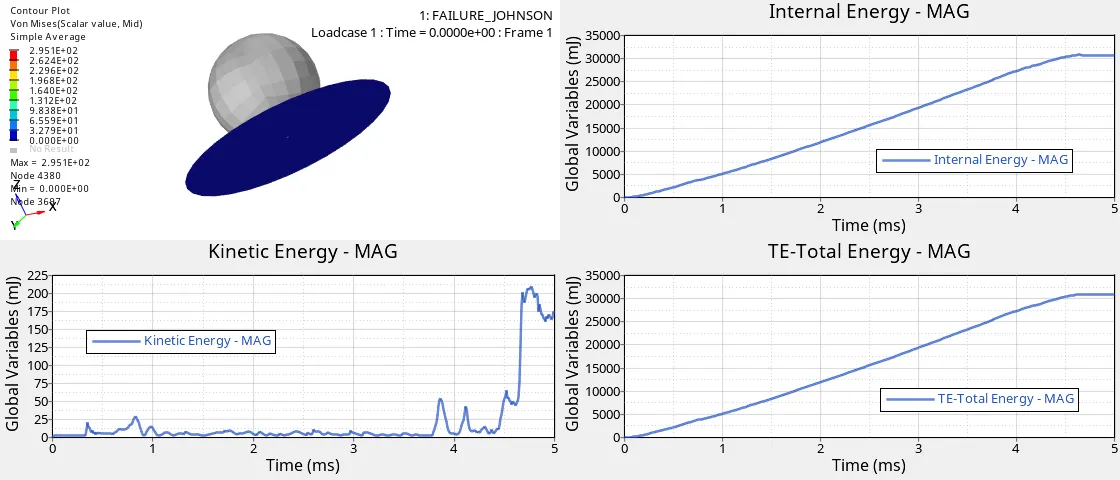
Fig : Vonmises Stress Contour Plot and Energy Plot for Case-2
7. From the above plot we observed that,
-In Vonmises Stress Contour, Rigid ball is impact on Aluminium Plate which maximum stress 2.951E+02 Mpa is applied.
- In this case XFEM is activated (Ixfem=1), the failure criteria will lead to element cracking instead of element or layer deletion. In this element has failed neighbors and D > Dadv, then in this case, crack advanced and Dadv is used for crack advancement. Dadv will be used if existing crack arrives to a boundary of an element (Dadv=1). In XFEM Formulation Elements Starts to crack after reaching the Reference Strain rate, elements starts to crack and Internal Energy will gain energy upto 31000 mJ and become constant.
- Based Reference Strain Rate(`epsi_o`) in Failure Card, Elements starts to crack and there is no deformation will occur and elements starts to scatter and that scattering elements possess some Kinetic Energy and it will be high (215 mJ) during the time of sudden crack is created.
- Total Energy is the sum of all Energy, Whenever Kinetic energy losses & Internal Energy gains, Total energy should be stable. But in this case There is less Kinetic Energy will be created . So Total Energy(31215 mJ) is similar to Internal Energy.
CASE-3 :
1. In case-3, Use the same FAILURE_JOHNSON_0000 rad file and Go to the Failures and Delete the Failure_JOHNSON_1 card.
2. After that, run the simulation by keeping other parameters as default.
3. Go to Analysis-->Radioss option and Save the input file in new folder and set options and run the simulation.
4. After that, Go to the Folder which Simulation file has been saved and Open the FAILURE_JOHNSON_0001.out File and Check the Energy Error, Mass Error, Total Number of Cycles and Simulation Time.
5. In this Case Energy Error is 0.8% and Mass Error is 0%. Total Number of cycles for this simulation is 49408 and time taken for total Simulation is 58.42s.
6. For Plotting the Vonmises Stress Contour Plot and Energy Plot, Same steps to be followed as previous case.
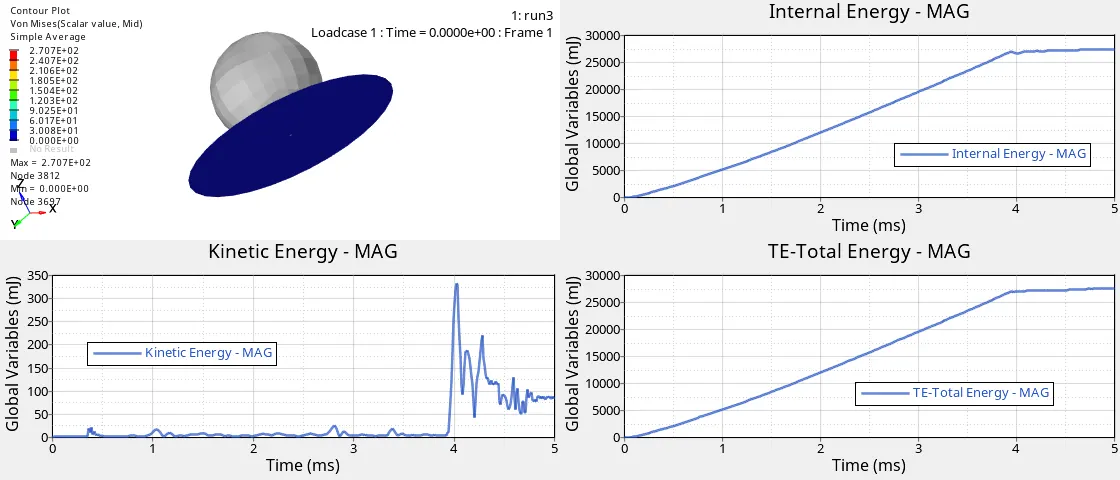
Fig : Vonmises Stress Contour Plot and Energy Plot for Case-3
7. From the above plot we observed that,
- In Vonmises Stress Contour, Rigid ball is impact on Aluminium Plate which maximum stress 2.707E+02 Mpa is applied.
- When there is no Failure Card, Elements Starts to delete based on EPS_p_max value and Internal Energy rise upto 27500 mJ and after that deformation will occur so internal energy becomes constant.
- There is no Reference Strain rate(`epsi_o`) due to absence of Failure Card , So it refers the EPS_p_max value and When Ep reaches Ep_max value, Element starts to fail and there is no deformation will occur and that scattering of elements possess some Kinetic Energy and it will be high (325 mJ) during the time of element .
- Total Energy is the sum of all Energy, Whenever Kinetic energy losses & Internal Energy gains, Total energy should be stable. But in this case There is less Kinetic Energy will be created due to vibration. So Total Energy(27825 mJ) is similar to Internal Energy.
CASE-4 :
1. In case-4, Use the same FAILURE_JOHNSON_0000 rad file and Go to the Materials and Delete EpS_p_max value.
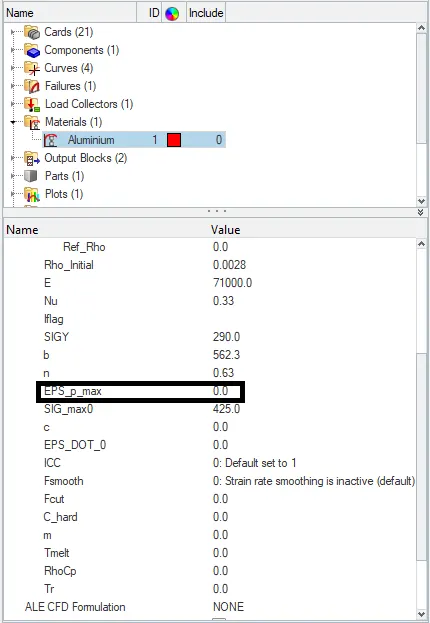
Fig : Deleting EPS_p_max
2. After that, run the simulation by keeping other parameters as default.
3. Go to Analysis-->Radioss option and Save the input file in new folder and set options and run the simulation.
4. After that, Go to the Folder which Simulation file has been saved and Open the FAILURE_JOHNSON_0001.out File and Check the Energy Error, Mass Error, Total Number of Cycles and Simulation Time.
5. In this Case Energy Error is 1.1% and Mass Error is 0%. Total Number of cycles for this simulation is 49304 and time taken for total Simulation is 60.54s.
6. For Plotting the Vonmises Stress Contour Plot and Energy Plot, Same steps to be followed as previous case.
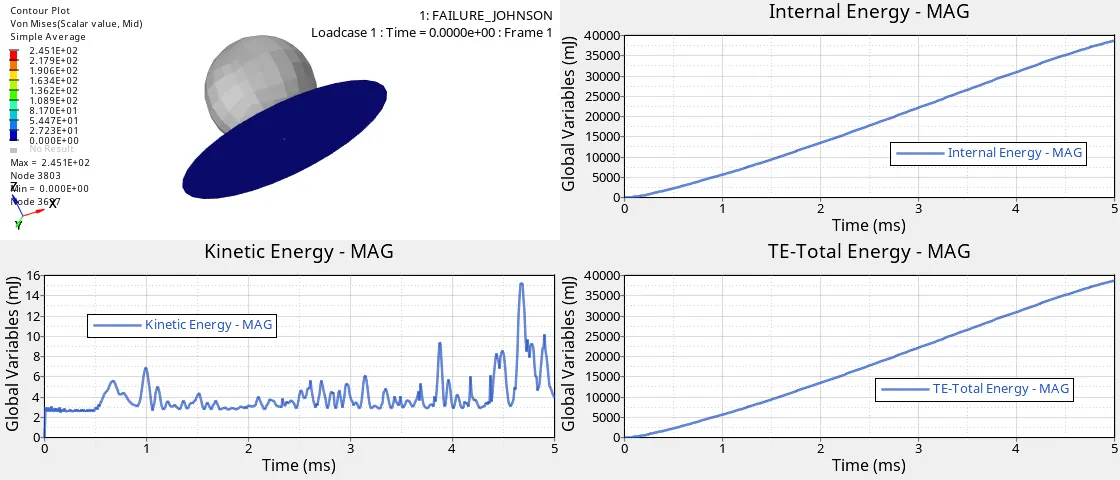
Fig : Vonmises Stress Contour Plot and Energy Plot for Case-4
7. From the above plot we observed that,
- In Vonmises Stress Contour, Rigid ball is impact on Aluminium Plate which maximum stress 2.451E+02 Mpa is applied.
- In previous Case-3, Internal Energy rise upto defined EPS_p_max value and becomes constant. But in this case EPS_p_max = 0, there is no element failure Point is defined. So that Internal Energy keeps on increasing (38000 mJ).
- When EpS_p_max value is not defined, Internal Energy is keep on Increasing, Less Kinetic Energy will be created due to Vibration in the Aluminium Plate and Kinetic Energy of the system is very low (15 mJ).
- When EPS_p_max = 0, there is no yield Point is defined. So Internal Energy is keep on Increasing, Less Kinetic Energy will be created due to vibration. So Total Energy(38015 mJ) is similar to Internal Energy.
CASE-5 :
1. In case-5, Use the same FAILURE_JOHNSON_0000 rad file and Convert Material Model LAW2(Elasto-Plastic) to LAW1(M1_ELAST) with same Density(Rho), Young's Modulus(E) and Poison's Ration(Nu).
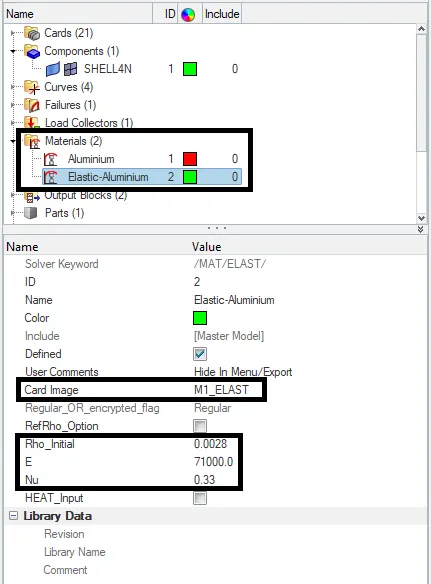
Fig : Creating M1_ELAST
2. After that, Go to Components-->Mat_Id Optin and select the Material using M1_ELAST.
3. Go to Analysis-->Radioss option and Save the input file in new folder and set options and run the simulation.
4. After that, Go to the Folder which Simulation file has been saved and Open the FAILURE_JOHNSON_0001.out File and Check the Energy Error, Mass Error, Total Number of Cycles and Simulation Time.
5. In this Case Energy Error is 1.3% and Mass Error is 0%. Total Number of cycles for this simulation is 47969 and time taken for total Simulation is 57.81s.
6. For Plotting the Vonmises Stress Contour Plot and Energy Plot, Same steps to be followed as previous case.
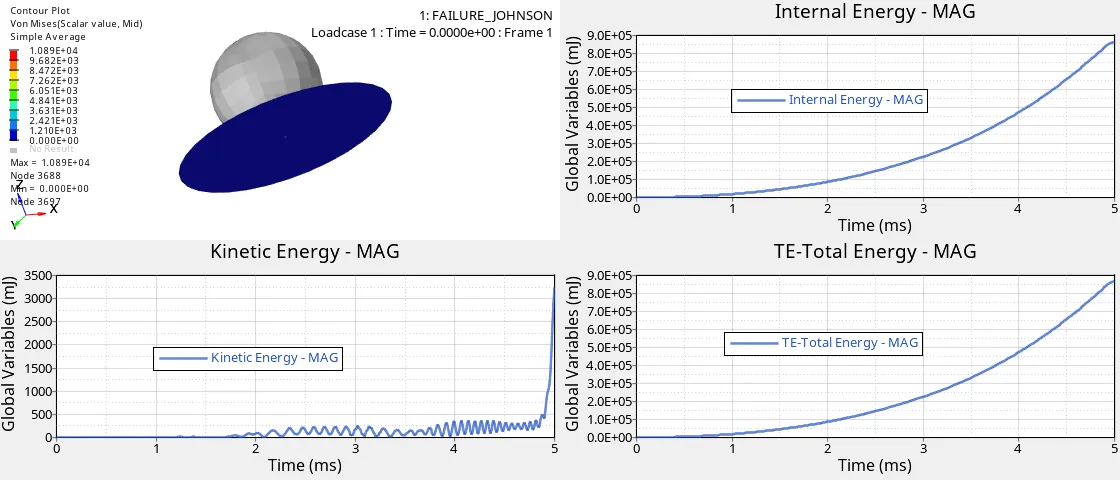
Fig : Vonmises Stress Contour Plot and Energy Plot for Case-5
7. From the above plot we observed that,
- In Vonmises Stress Contour, Rigid ball is impact on Aluminium Plate which maximum stress 1.089E+04 Mpa is applied.
- Material Law1(MI-ELAST) is used to model purely elastic materials. The material stiffness is determined by only two values: the Young's modulus (E), and Poisson's ratio ( Nυ">υ ). The shear modulus (G) can be computed using E and Nu :
`G = E/(2(1+Nu))`
While Rigid ball is impact on the Aluminium Plate, Internal Energy starts to gain energy of the system due to changes in its internal state. Using LAW1, Small Deformation only occur. There is no Plastic Region in Material Law1. So Internal Energy will be high (8.50E+05 mJ) in Elastic Region.
- Using Law1 Elastic type, There is no Element Crack or Element Deletion will occur. So less Kinetic Energy will occur due to vibration. After reaching the Elasticity peak point, it will come back to original state, at the time Kinetic Energy will be high (3250 mJ).
- Using Law1 Elastic Type,Inetrnal Energy gains and less Kinetic Energy will be created in Elastic Region. So Total Energy(8.825E+05 mJ) is similar to Internal Energy.
CASE-6 :
1. In case-6, Use the same LAW27_0000.rad file and run the simulation with material model as M27_PLAS_BRIT.
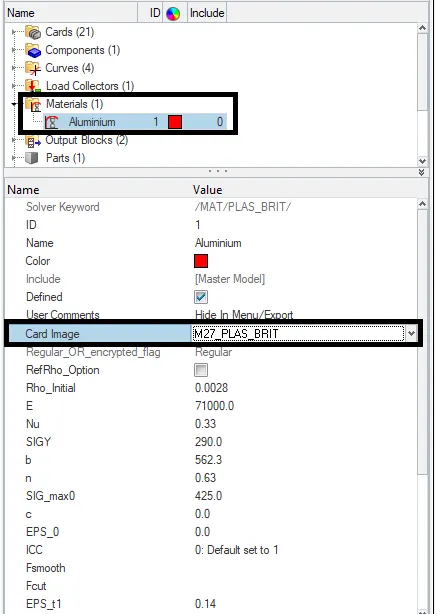
Fig : M27_PLAS_BRIT Card
2. Go to Analysis-->Radioss option and Save the input file in new folder and set options and run the simulation.
3. After that, Go to the Folder which Simulation file has been saved and Open the LAW27_0001.out File and Check the Energy Error, Mass Error, Total Number of Cycles and Simulation Time.
4. In this Case Energy Error is -7.1% and Mass Error is 0%. Total Number of cycles for this simulation is 41113 and time taken for total Simulation is 48.83s.
5. For Plotting the Vonmises Stress Contour Plot and Energy Plot, Same steps to be followed as previous case.
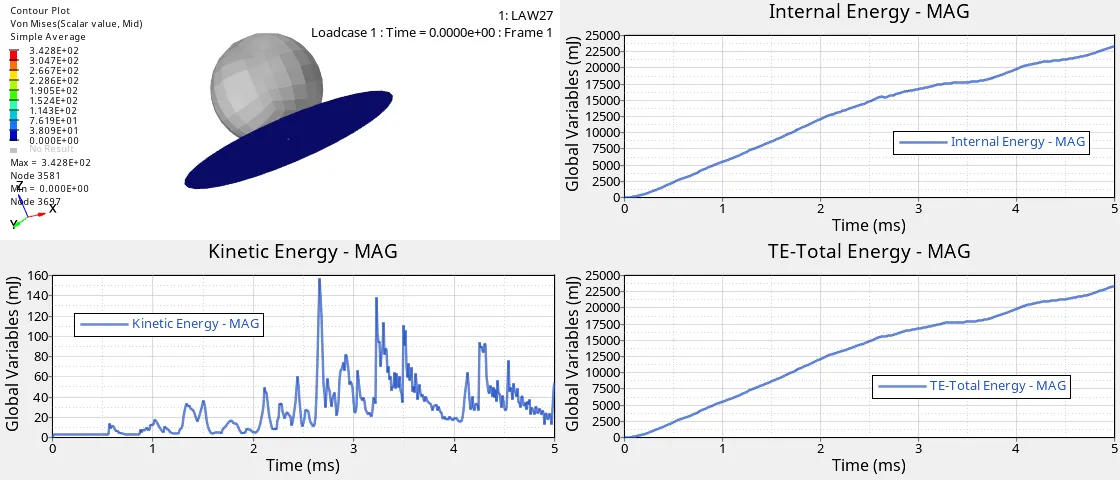
Fig : Vonmises Stress Contour Plot and Energy Plot for Case-6
6. From the above plot we observed that,
- In Vonmises Stress Contour, Rigid ball is impact on Aluminium Plate which maximum stress 3.428E+04 Mpa is applied.
- In Law27(PLAS_BRIT) model, the material behaves as a linear-elastic material when the equivalent stress is lower than the plastic yield stress. For higher stress values, the material behavior is plastic and the stress is calculated using Plastic Strain and Strain rate. Based on defined stress value `epsi_t,epsi_m`, Elements will fail and when it reaches `epsi_f` elements will be removed and So Internal Energy rised upto 24000 mJ.
- Based on `epsi_t,epsi_m,epsi_f`, Elements starts to fail and elements will be removed. When Scattering of Elements possess some Kinetic Energy and it will be high (158 mJ) during the time of reaching element fail.
- We know that Total Energy is the sum of all Energy, Whenever Kinetic energy losses & Internal Energy gains, Total energy should be stable. But in this case There is less Kinetic Energy and Internal Energy will be high. So Total Energy(24158 mJ) is similar to Internal Energy.
CASE-7 :
1. In case-7, Use the same FAILURE_JOHNSON_0000 rad file and Convert Material Model LAW2(Elasto-Plastic) to LAW36(M36_PLAS_TAB) and set the values as per given condition.
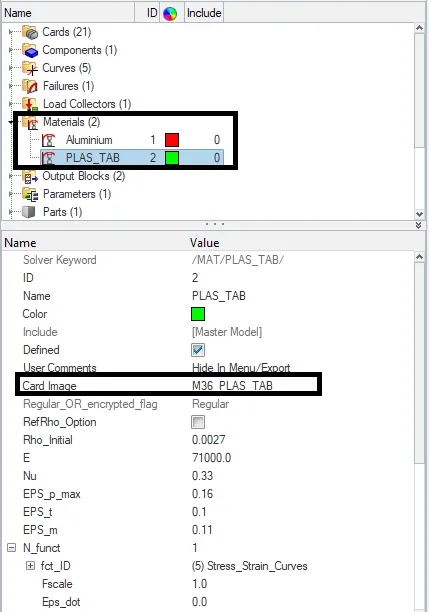
Fig : M36_PLAS_TAB
2. Go to Curves option and create the curve using given X and Y values and click Update.
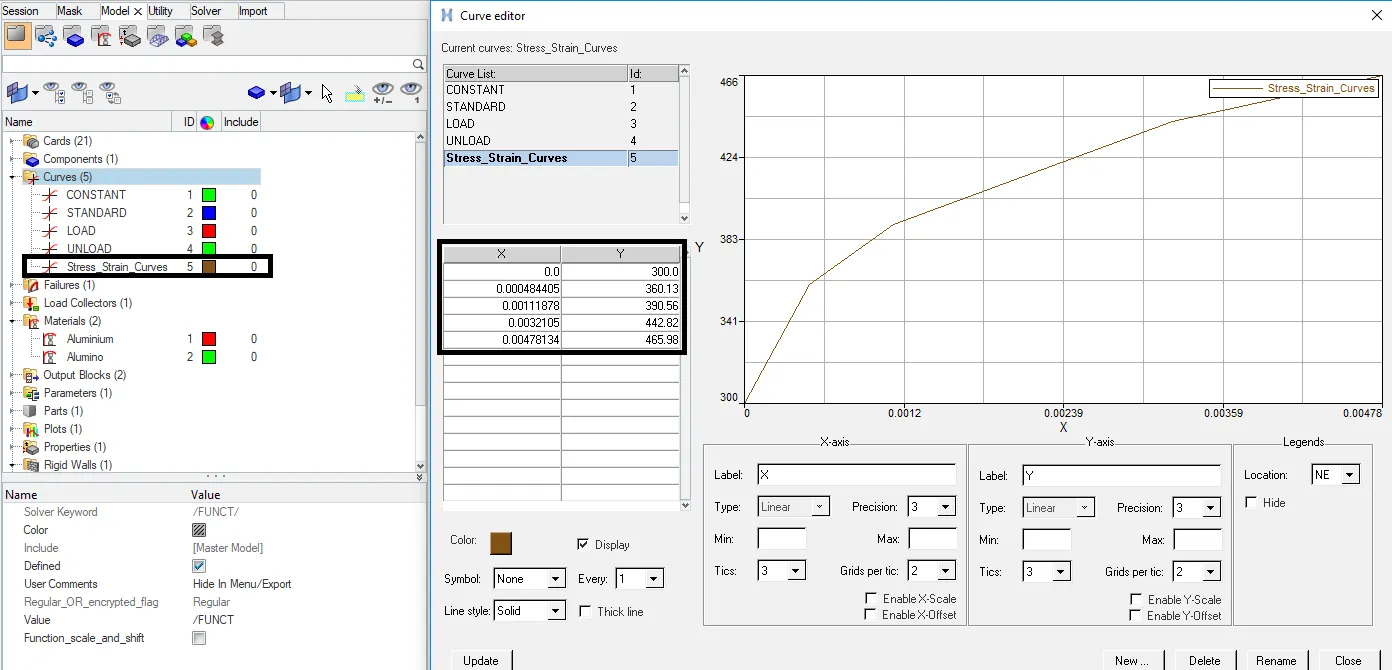
Fig : Stress-Strain Curve
3. Go to Analysis-->Radioss option and Save the input file in new folder and set options and run the simulation.
4. After that, Go to the Folder which Simulation file has been saved and Open the FAILURE_JOHNSON_0001.out File and Check the Energy Error, Mass Error, Total Number of Cycles and Simulation Time.
5. In this Case Energy Error is -1.3% and Mass Error is 0%. Total Number of cycles for this simulation is 53155 and time taken for total Simulation is 62.01s.
6. For Plotting the Vonmises Stress Contour Plot and Energy Plot, Same steps to be followed as previous case.
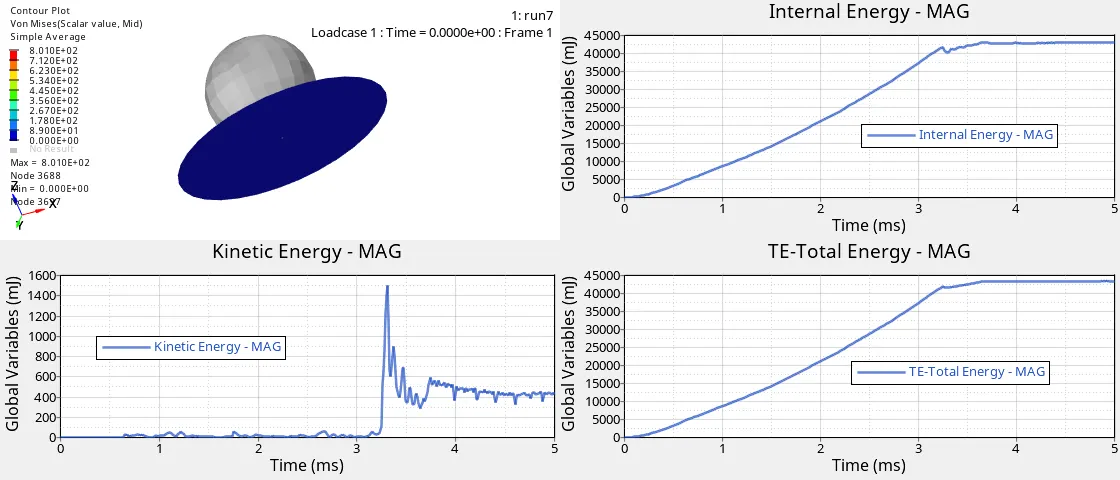
Fig : Vonmises Stress Contour Plot and Energy Plot for Case-7
7. From the above plot we observed that,
- In Vonmises Stress Contour, Rigid ball is impact on Aluminium Plate which maximum stress 8.010E+04 Mpa is applied.
- Law36(PLAS_TAB) models an isotropic elasto-plastic material using user-defined functions for the work-hardening portion of the stress-strain curve (for example, stress vs. plastic strain) for different strain rates. When the Elements Starts to fail based on the given Experimental Stress-Strain Curves and Internal Energy will rise upto 43000 mJ and becomes constant , after that no deformation occurs.
Law36(PLAS_TAB) models an isotropic elasto-plastic material, When the Elements Starts to fail based on the given Experimental Stress-Strain Curves and Internal Energy will become constant at 43000 mJ and after that no deformation occurs.
- Bassed on Experimental Stress-Strain Curves, Elements starts to fail and Scattering of Elements possess some Kinetic Energy and it will be high (1500 mJ) during the time of Eelement fail.
- We know that Total Energy is the sum of all Energy, Whenever Kinetic energy losses & Internal Energy gains, Total energy should be stable. But in this case There is less Kinetic Energyand Internal Energy will be high. So Total Energy(44500 mJ) is similar to Internal Energy.
COMPARISON OF CASE-1 & CASE-2 :
Case-1 : Vonmises stress & Energy Plot Case-2 : Vonmises stress & Energy Plot
|
Case-1 : Using Ixfem=0 |
Case-2 : Using Ixfem = 1 |
|
In Vonmises Stress Contour, Rigid ball is impact on Aluminium Plate which maximum stress 2.752E+02 Mpa is applied. |
-In Vonmises Stress Contour, Rigid ball is impact on Aluminium Plate which maximum stress 2.951E+02 Mpa is applied. |
| In Material Law2(Elasto-Plastic Material) Using Ixfem=0, element will be deleted after reaches the rupture criteria , no stress will be applied on the Aluminium Plate and Internal Energy will rise upto 27000 mJ and become constant. Because its loses its Elasticity and Changed into Plastic region. | - In this case XFEM is activated (Ixfem=1), the failure criteria will lead to element cracking instead of element or layer deletion. Dadv will be used if existing crack arrives to a boundary of an element (Dadv=1). In XFEm Formulation Elements Starts to crack after reaching the Reference Strain rate, elements starts to crack and Internal Energy will gain energy upto 31000 mJ and become constant. |
| Based Reference Strain Rate(`epsi_o`) in Failure Card, Elements starts to fail and there is no deformation will occur and elements starts to scatter and that scattering elements possess some Kinetic Energy and it will be high (180 mJ) during the start time of element deletion. | Based Reference Strain Rate(`epsi_o`) in Failure Card, Elements starts to crack and there is no deformation will occur and elements starts to scatter and that scattering elements possess some Kinetic Energy and it will be high (215 mJ) during the time of sudden crack is created. |
| - We know that Total Energy is the sum of all Energy, Whenever Kinetic energy losses & Internal Energy gains, Total energy should be stable. But in this case There is less Kinetic Energy is created during deformation. So Total Energy is (27180 mJ), it is similar to Internal Energy. | - Total Energy is the sum of all Energy, Whenever Kinetic energy losses & Internal Energy gains, Total energy should be stable. But in this case There is less Kinetic Energy will be created . So Total Energy(31215 mJ) is similar to Internal Energy. |
COMPARISON OF CASE-3 & CASE-4 :
Case-3 : Vonmises stress & Energy Plot Case-4 : Vonmises stress & Energy Plot
|
Case-3 : No Failure Card & Only EPS_p_max |
Case-4 : Only Failure Card & No EPS_p_max |
|
In Vonmises Stress Contour, Rigid ball is impact on Aluminium Plate which maximum stress 2.707E+02 Mpa is applied. |
In Vonmises Stress Contour, Rigid ball is impact on Aluminium Plate which maximum stress 2.451E+02 Mpa is applied. |
| When there is no Failure Card, Elements Starts to delete based on EPS_p_max value and Internal Energy rise upto 27500 mJ and after that deformation will occur so internal energy becomes constant. | In previous Case-3, Internal Energy rise upto defined EPS_p_max value and becomes constant. But in this case EPS_p_max = 0, there is no element failure Point is defined. So that Internal Energy keeps on increasing (38000 mJ). |
| There is no Reference Strain rate(`epsi_o`) due to absence of Failure Card , So it refers the EPS_p_max value and When Ep reaches Ep_max value, Element starts to fail and there is no deformation will occur and that scattering of elements possess some Kinetic Energy and it will be high (325 mJ) during the time of element deletion. | When EpS_p_max value is not defined, Internal Energy is keep on Increasing, Less Kinetic Energy will be created due to Vibration in the Aluminium Plate and Kinetic Energy of the system is very low (15 mJ). |
| Total Energy is the sum of all Energy, Whenever Kinetic energy losses & Internal Energy gains, Total energy should be stable. But in this case There is less Kinetic Energy will be created due to vibration. So Total Energy(27825 mJ) is similar to Internal Energy. | When EPS_p_max = 0, there is no yield Point is defined. So Internal Energy is keep on Increasing, Less Kinetic Energy will be created due to vibration. So Total Energy(38015 mJ) is similar to Internal Energy. |
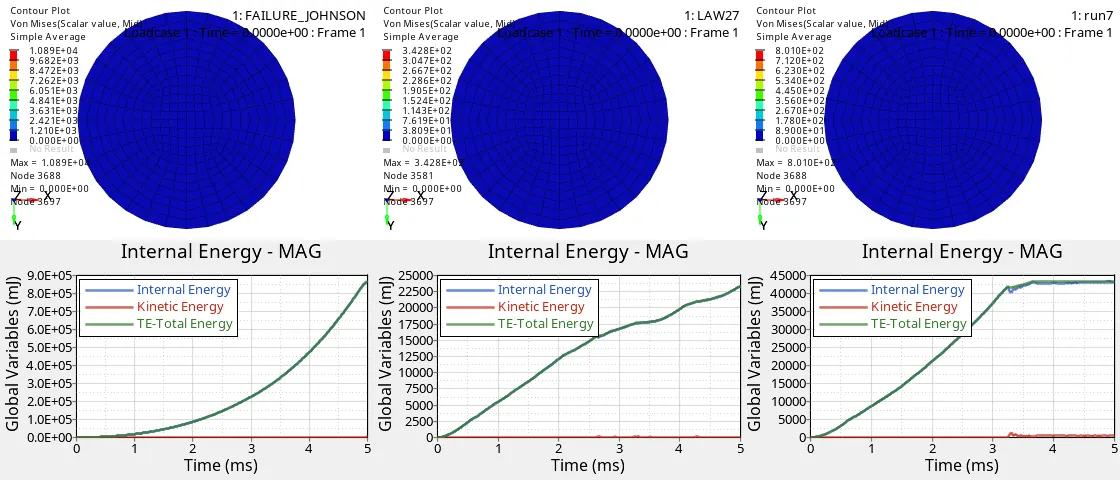
COMPARISON OF CASE-5, CASE-6 & CASE-7 :
Case-5 : Vonmises stress & Energy Plot Case-6 : Vonmises stress & Energy Plot Case-7 : Vonmises stress & Energy Plot
| Case-5 : Using Law1(M1_ELAST) | Case-6 : Using Law27(PLAS_BRIT) | Case-7 : Using Law36(PLAS_TAB) |
|
In Vonmises Stress Contour, Rigid ball is impact on Aluminium Plate which maximum stress 1.089E+04 Mpa is applied. |
In Vonmises Stress Contour, Rigid ball is impact on Aluminium Plate which maximum stress 3.428E+04 Mpa is applied. |
In Vonmises Stress Contour, Rigid ball is impact on Aluminium Plate which maximum stress 8.010E+04 Mpa is applied. |
|
Material Law1(MI-ELAST) is used to model purely elastic materials. Using LAW1, Small Deformation only occur. There is no Plastic Region in Material Law1. So Internal Energy will be high (8.50E+05 mJ) in Elastic Region. |
In Law27(PLAS_BRIT) model, the material behaves as a linear-elastic material when the equivalent stress is lower than the plastic yield stress. Based on defined stress value `epsi_t,epsi_m`, Elements will fail and when it reaches `epsi_f` elements will be removed and So Internal Energy rised upto 24000 mJ. | Law36(PLAS_TAB) models an isotropic elasto-plastic material, When the Elements Starts to fail based on the given Experimental Stress-Strain Curves and Internal Energy will rise upto 43000 mJ and becomes constant , after that no deformation occurs. |
| Using Law1 Elastic type, There is no Element Crack or Element Deletion will occur. So less Kinetic Energy will occur due to vibration. After reaching the Elasticity peak point, it will come back to original state, at the time Kinetic Energy will be high (3250 mJ). | Based on `epsi_t,epsi_m,epsi_f`, Elements starts to fail and elements will be removed. When Scattering of Elements possess some Kinetic Energy and it will be high (158 mJ) during the time of reaching element fail. | Bassed on Experimental Stress-Strain Curves, Elements starts to fail and Scattering of Elements possess some Kinetic Energy and it will be high (1500 mJ) during the time of Eelement fail. |
| Using Law1 Elastic Type,Inetrnal Energy gains and less Kinetic Energy will be created in Elastic Region. So Total Energy(8.825E+05 mJ) is similar to Internal Energy. | We know that Total Energy is the sum of all Energy, Whenever Kinetic energy losses & Internal Energy gains, Total energy should be stable. But in this case There is less Kinetic Energy and Internal Energy will be high. So Total Energy(24158 mJ) is similar to Internal Energy. | We know that Total Energy is the sum of all Energy, Whenever Kinetic energy losses & Internal Energy gains, Total energy should be stable. But in this case There is less Kinetic Energyand Internal Energy will be high. So Total Energy(44500 mJ) is similar to Internal Energy. |
RESULT :
| CASE | MODEL | LAW | CHANGING PARAMETERS | ENERGY ERROR (in %) | MASS ERROR(in %) | TOTAL NUMBER OF CYCLES | SIMULATION TIME (in sec) | VONMISES Max. STRESS CONTOUR (Mpa) | Max. INTERNAL ENERGY(mJ) | Max. KINETIC ENRGY(mJ) | Max. TOTAL ENERGY(mJ) |
| 1 | Failure_Johnson_0000.rad | Law2(PLAS_JOHNS) | Default Parameter | 0.8 | 0 | 49380 | 57.94 | 2.75E+02 | 27000 | 180 | 27180 |
| 2 | Failure_Johnson_0000.rad | Law2(PLAS_JOHNS) | Ifail_sh = 1, Dadv = 1 and Ixfem = 1 | 4.1 | 0 | 49217 | 65.33 | 2.951+02 | 31000 | 215 | 31215 |
| 3 | Failure_Johnson_0000.rad | Law2(PLAS_JOHNS) | Deleting Failure Card | 0.8 | 0 | 49408 | 58.42 | 2.71E+02 | 27500 | 325 | 27825 |
| 4 | Failure_Johnson_0000.rad | Law2(PLAS_JOHNS) | EPS_p_max = 0 | 1.1 | 0 | 49304 | 60.54 | 2.45E+02 | 38000 | 15 | 38015 |
| 5 | Failure_Johnson_0000.rad | Law1(M1_ELAST) | LAW2 to LAW1 | 1.3 | 0 | 47969 | 57.81 | 1.09E+04 | 8.50E+05 | 3250 | 8.825E+05 |
| 6 | LAW27_0000.rad | Law27(PLAS_BRIT) | Default Parameter | -7.1 | 0 | 41113 | 48.83 | 3.43E+02 | 24000 | 158 | 24158 |
| 7 | Failure_Johnson_0000.rad | Law36(PLAS_TAB) | Experimental stress-strain curve created | -1.3 | 0 | 53155 | 62.01 | 8.01E+02 | 43000 | 1500 | 44500 |
CONCLUSION :
- By using Radioss in Hypermesh, Simulation was run for 7 cases using given Model and Material Properties,
- Case-1 : Using Law2(PLAS_JHOHNS) Material Model default parameters(Ixfem=0),
- Case-2 : Changed Failure Card as Ifail_sh=1, Dadv=1, Ixfem=1,
- Case-3 : Deleted Failure Card,
- Case-4 : EPS_p_max = 0,
- Case-5 : Law2(PLAS_JOHNS) Material Model Converted to Law1(M1_ELAST),
- Case-6 : Using Law27(PLAS_BRIT) Material Model default parameters,
- Case-7 : Using Law36(PLAS_TAB) with creating experimental Stress-Strain Curves.
- Results were compared between Case-1&2, Case3&4 and Case5,6&7 and Vonmises Stress & Energy results were plotted.