Assignment 3-2D Element Formulation Challenge
OBEJECTIVE: To Run the analysis of the given model with the default property and recomended property parametres, and plot graphs and compare the result bor both the cases.
PROCEDURE:
Step1: Importing the give file to the GUI
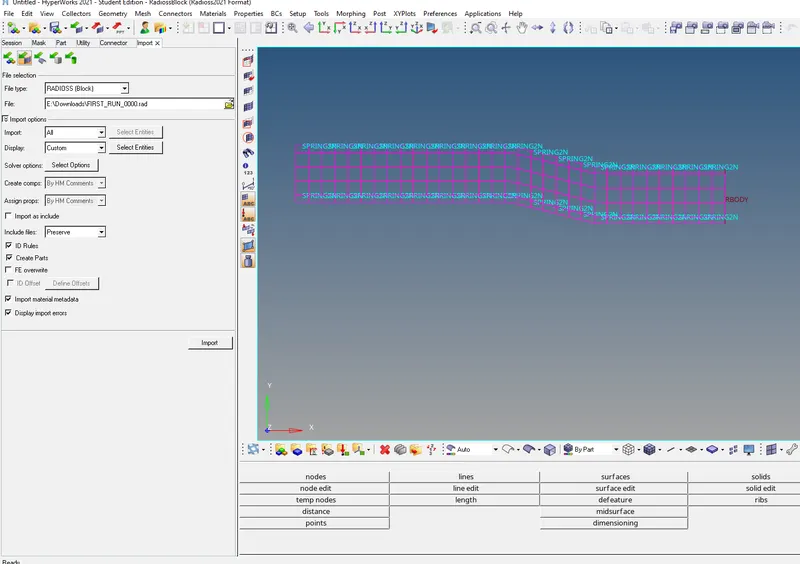
- File>Import> Selecting the file type 0000.rad>Export.
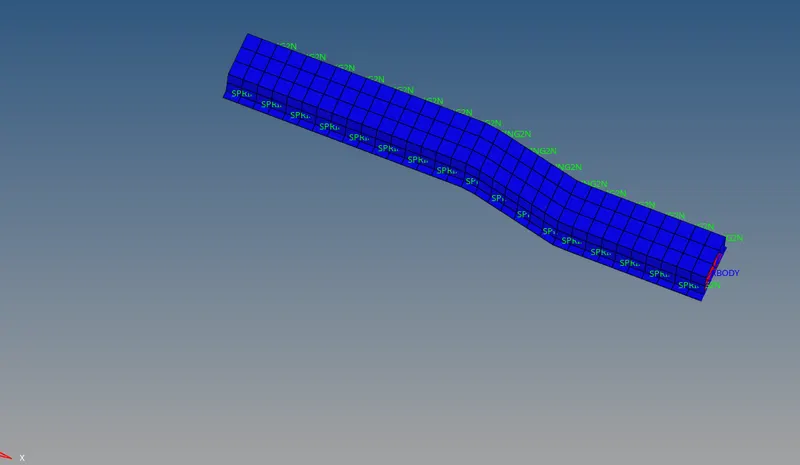
- Turning on the shaded Geometry for better view.
Step2: To Change the Run time to 55ms.
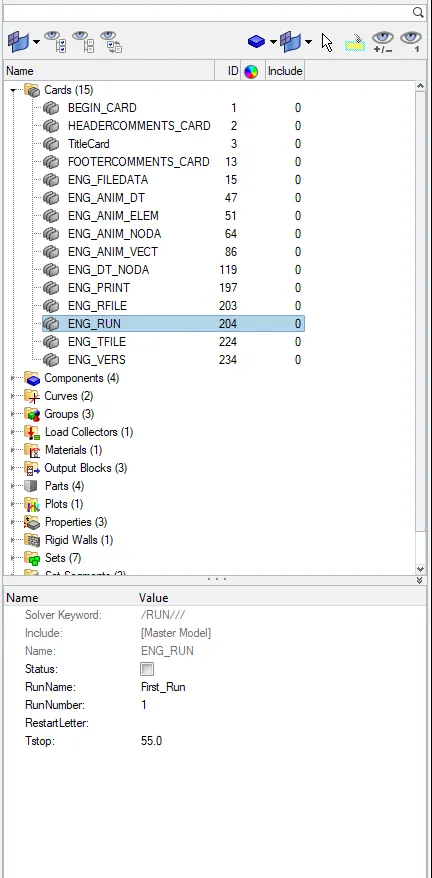
- Cards>ENG_RUN>Tstop=55ms
Step3: Selecting the animation steps for the simulations.
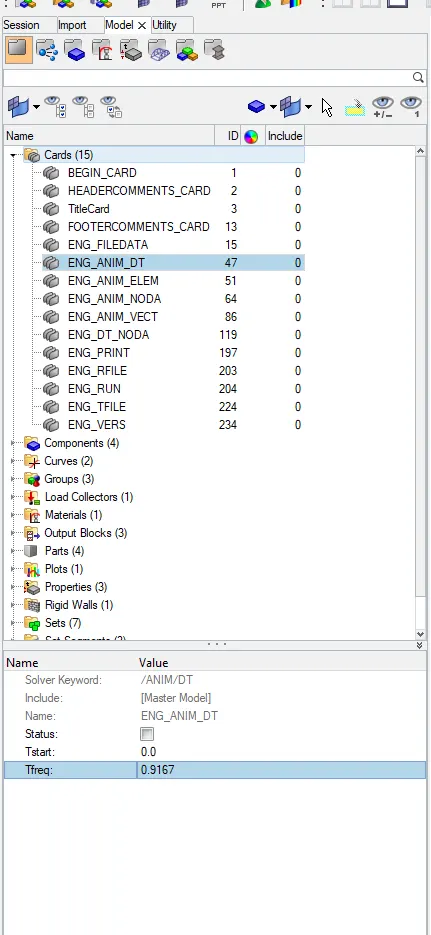
- Animation=60
Formula for Tfreq= Tstop/ no of Animation.
= 55/60
= 0.9167ms
- Cards>ENG_AnimDT>Tfreq=0.9167ms
Case1;
Step3: Runing the Simulation with the default property parametres.

- Choosing the destination to save the simulation files.
- -nt 4 it is the command which will use all the 4 cores to run the simulation.
- Analysis>Radios>saving the file>Radioss.
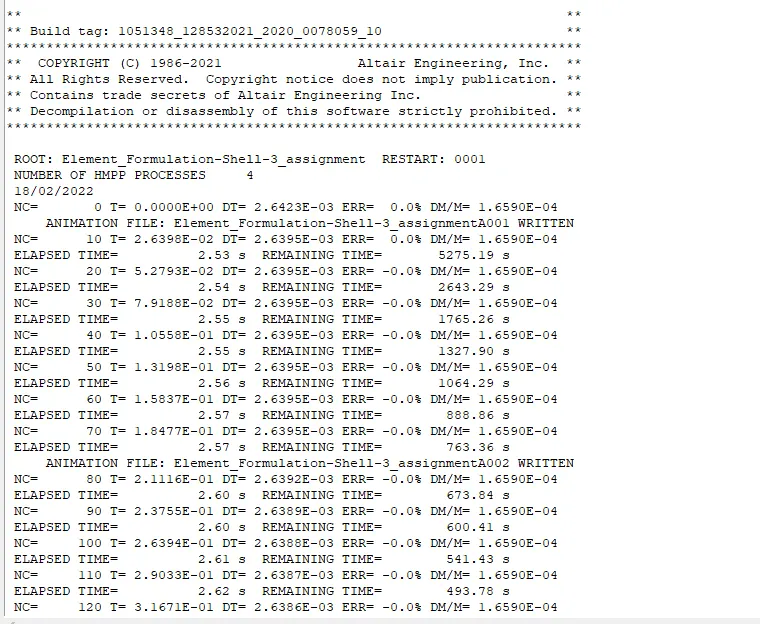
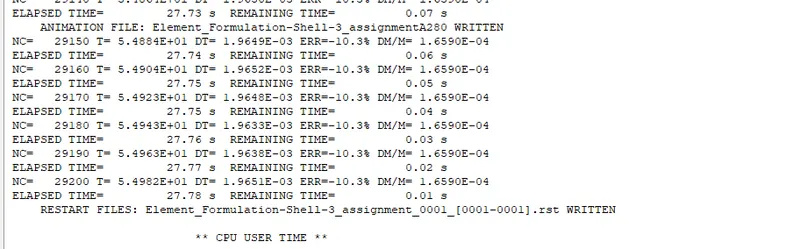
- From the above result the energy error varies from -0.00% to -10.3% which is in the acceptable range
- The mass energy did not vary and remained constant throughout.
- The mass error percentage obtained is 0.001% which less than 2% which is acceptable range
Step4: Since all the Errors are falling under acceptable range now ploting Plot rigid wall forces, internal energy, hourglass energy, contact energy, total energy of the simulations.
- Now to plot the graph, Hypergraph 2D.

- Now selecting T01 file obtained from the analysis folder
- Global variable> selecting internal energy, hourglass energy, contact energy, total energy and kinetic energy to be ploted >Mag>Apply.
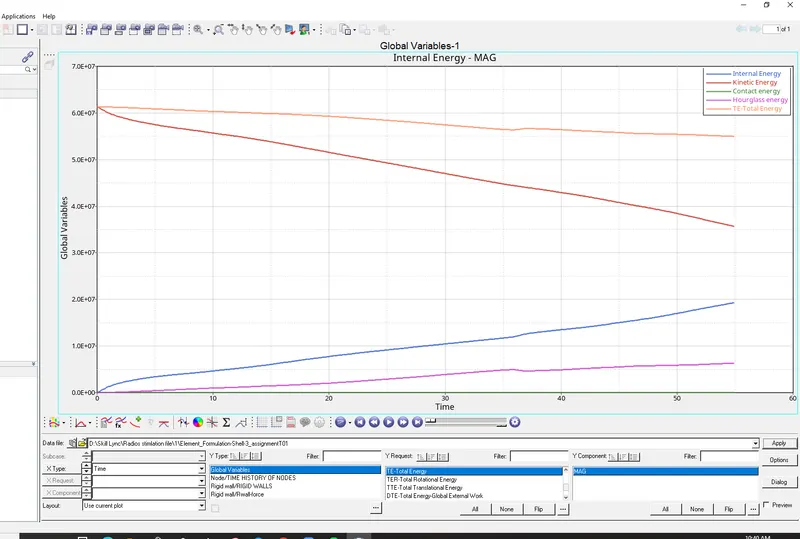
- From the above graph we observe following result
- Internal Energy: This energy is developed in the tube when it is crashed into the rigid wall and deforms this causes the internal energy to increases
- Kinetic Energy:This energy is developed when the tube is in motion,The kinetic energy decrease as the tube hits the wall decelerates.
- Contact Energy: This energy is the interface energy developed between the tube and the rigid wall.
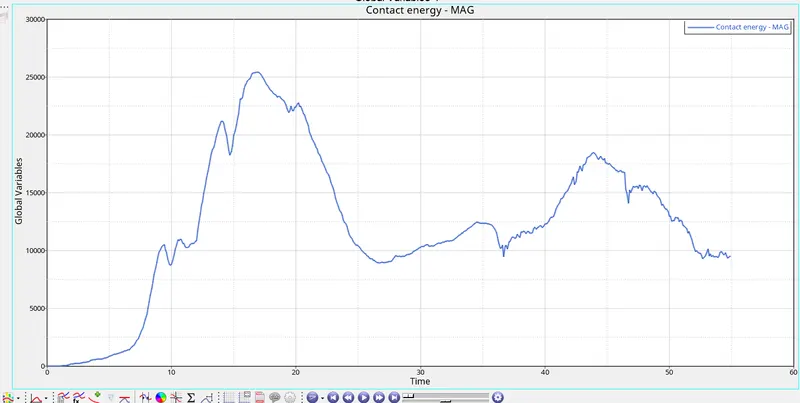
- Energy is 0 before the contact and energy increase as the tube comes in contact with wall an reduces when tube deforms as the area of the contact reduces.
- Hourglass Energy: Energy is developed to resist hour glass mode, The energy is slightly increasing.
- Total energy: Is sum of internal energy, kinetic energy, contact energy, hourglass energy..etc in the model, the total energy is reduce slightly.
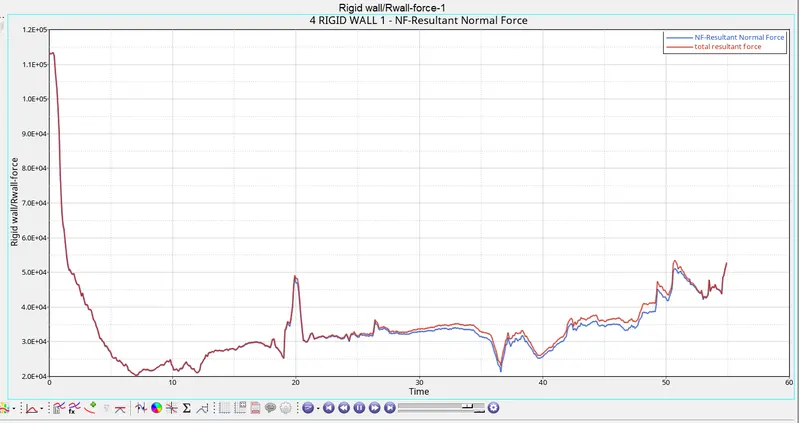
- Rigid wall forces: Are the forces that is developed when the tube is in contact with the Rigid wall.
Step 5: To Run the Animation or stimulation.

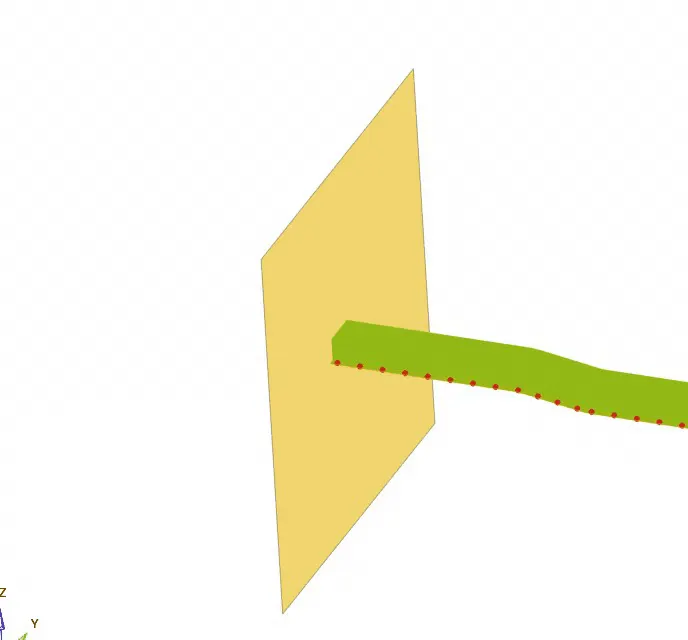
- Hyper view> selecting the h3d file to run the animation from the analysis file>apply.
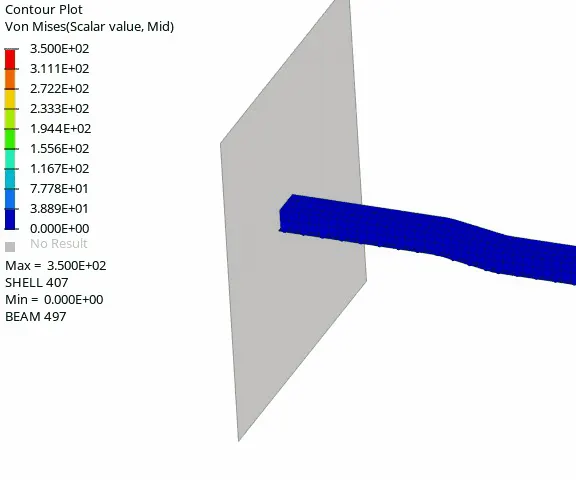
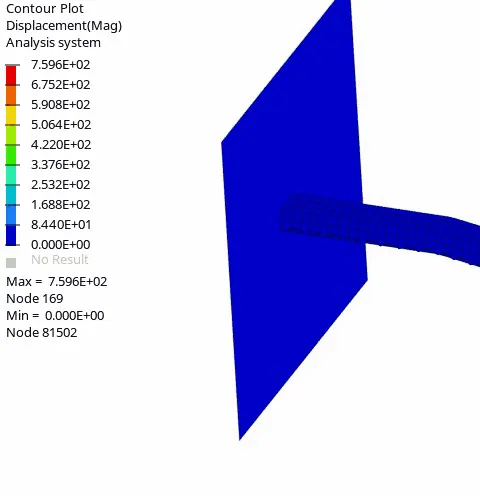
To plot Von mises and displacement stress using contour Plot .

Contour option>selcting the result type>apply.
Case2:
Step6:
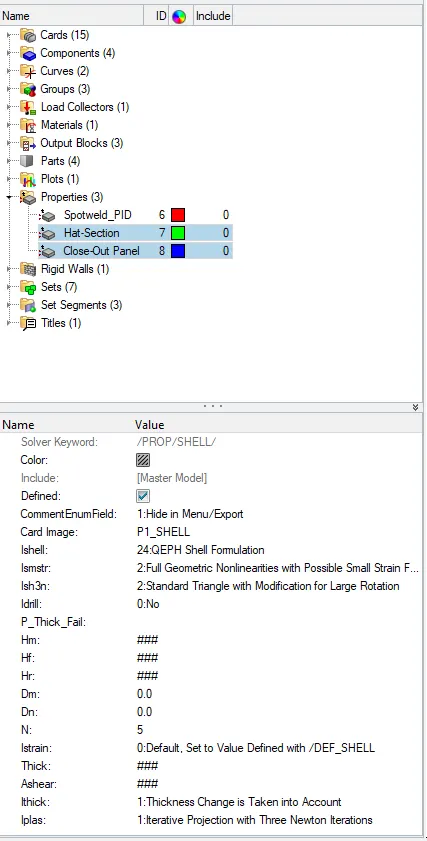
Now Changing the property with the given parameter.
| Parameters | Comment | |
|
Ishell =24 |
QEPH 4 nodes shells are best combination of cost and accuracy. | |
|
Ismstr=2 |
Full geometric nonlinearities (default)with possible small strain formulation activation in RADIOSS Engine. | |
|
Ish3n=2 |
Standard 3 noded shell (C0)with modification for large rotation(default) |
|
| N=5 | Number of integration points set to 5 for accuracy bending. | |
|
Ithick=1 |
Thickness change is taken into account for accuracy. |
|
|
Iplas=1 |
Iterative plasticity for good accuracy. |
- Changing the Property Card.
Step7: Runing the Simulation with the Given property parametres. flowing the same procedure.
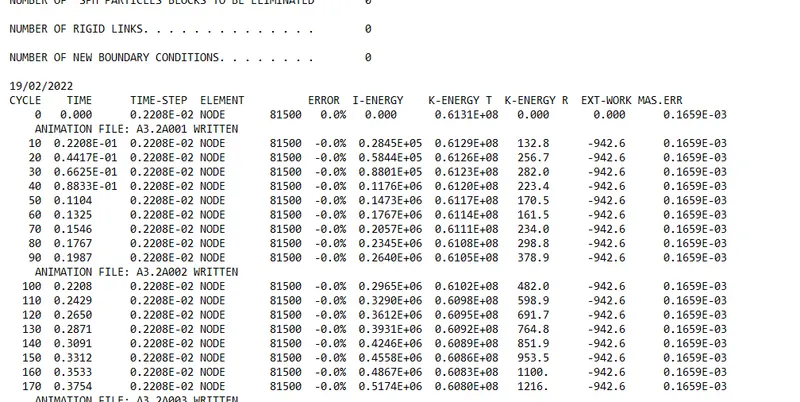
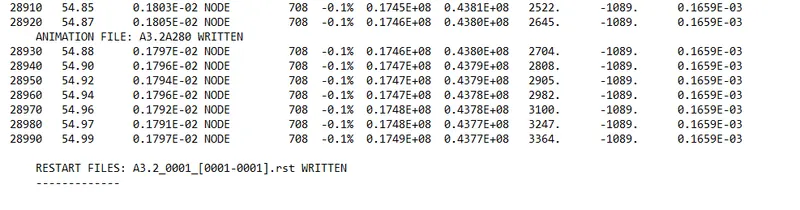
- From the above result the energy error varies from -0.00% to -0.1% which is in the acceptable range
- The mass energy did not vary and remained constant throughout.
- The mass error percentage obtained is 0.001% which less than 2% which is acceptable range
Step8: Since all the Errors are falling under acceptable range now ploting Plot rigid wall forces, internal energy, hourglass energy, contact energy, total energy of the simulations.
- Now to plot the graph, Hypergraph 2D.
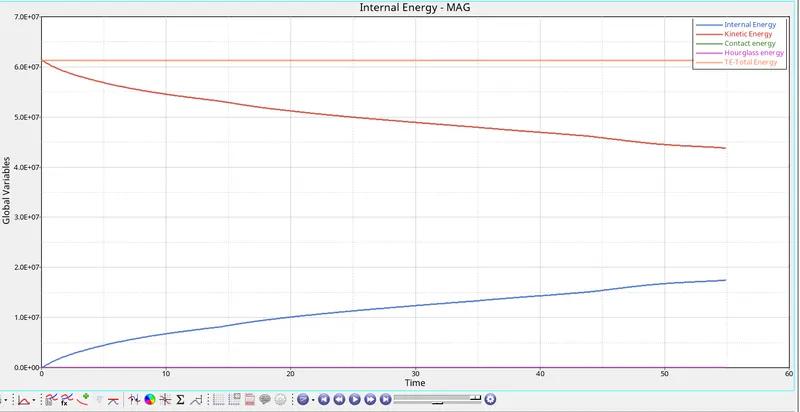
- From the above graph total energy is constant.
- The kinetic energy is decreasing.
- The internal energy is increasing
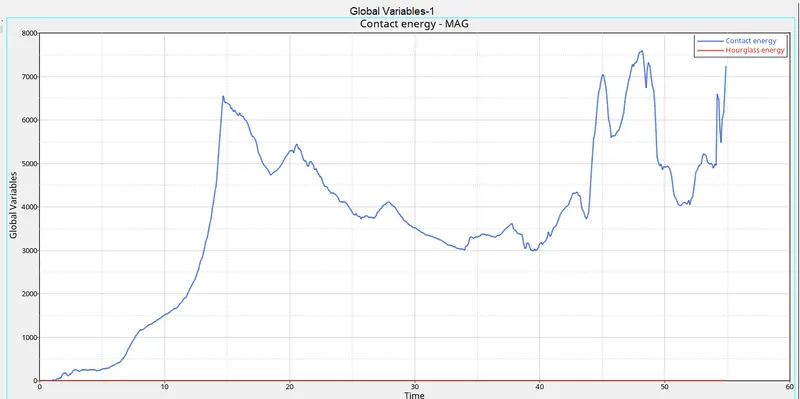
- From the above graph Hour glass energy is zero
- The contact energy is fluctuating.
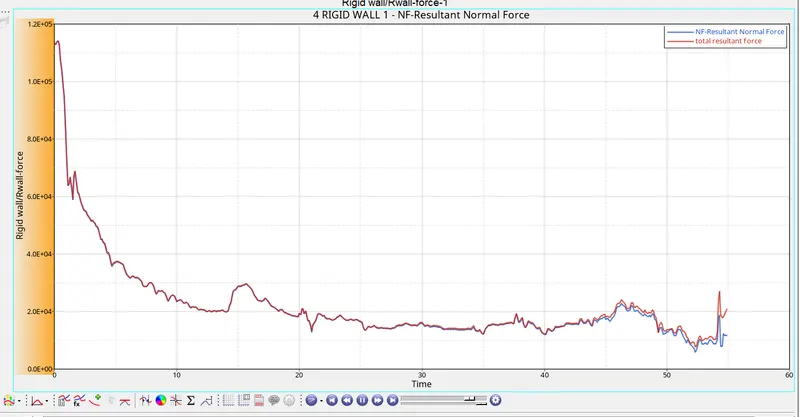
- From the above graph Rigid wall forces is decreasing.
Step9: To Run the Animation or stimulation.
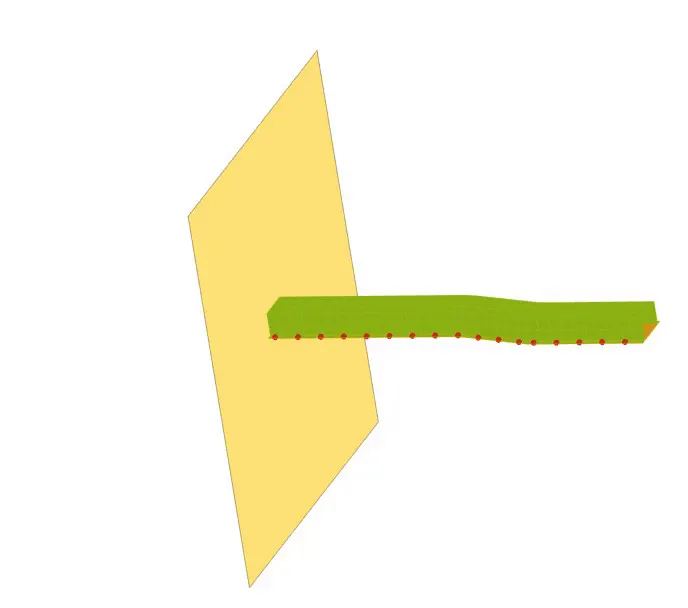
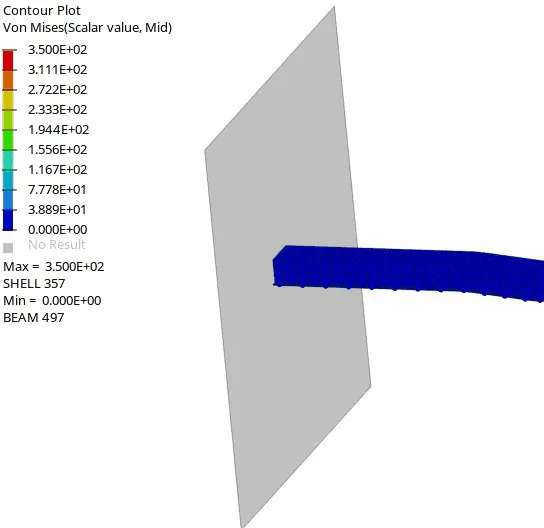
To plot Von mises and displacement stress using contour Plot .
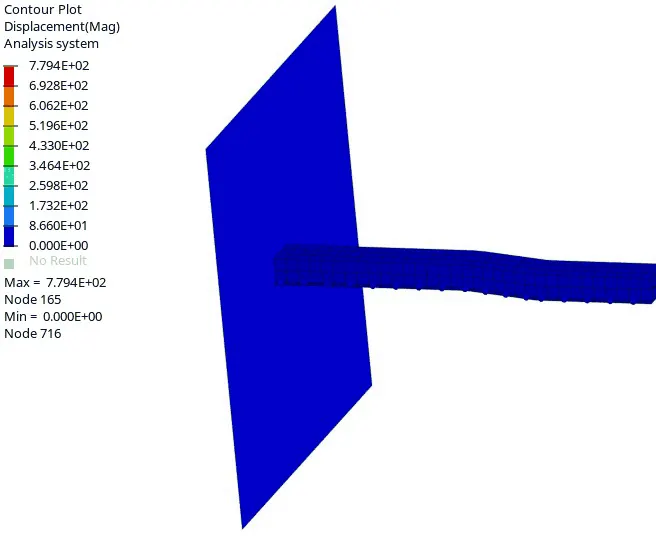
Now comparing the results Of case1 and case2;
| Results to be compared | Case 1: With default Property Paramater | Case 2: With Given property Paramater |
| Energy error | -0.0% to 10.3% | -0.0% to -0.1% |
| Kinetic energy | 0.6131E+08mj | 0.6129E+08mj |
| Internal energy | 0.3512E+05mj | 0.2845+05mj |
| Hour Glass energy | 6.30E+06 | 0 |
| Von mises stress | 3.500E02MPA | 3.500MPA |
| Displacement | 7.596E+02 | 7.794E+02 |
- From the above table we can see that energy error has been reduced when the given parameter is added.
- There kinetic and internal energy has reduced when the given parameter is added
- Hour Glass energy is reduced to zero when the given parameter is added.
- The displacement is also increased.
- The result are accurate in case 2 when the parameter is added.
- When we campare the simalation in case2 the difornation looks natural.
Steps to avoid Hourglass:
- To choose Full or Reduced integration Method
- To refine the mesh
- To add stiffness to the node.