Assignment 3
AIM & OBJECTIVE:
The main idea is to run the simulation of a crash beam and to introduce the element properties and compare the results obtained from the both.
PROCEDURE:
STEP1) Change the user profile to Radioss block.
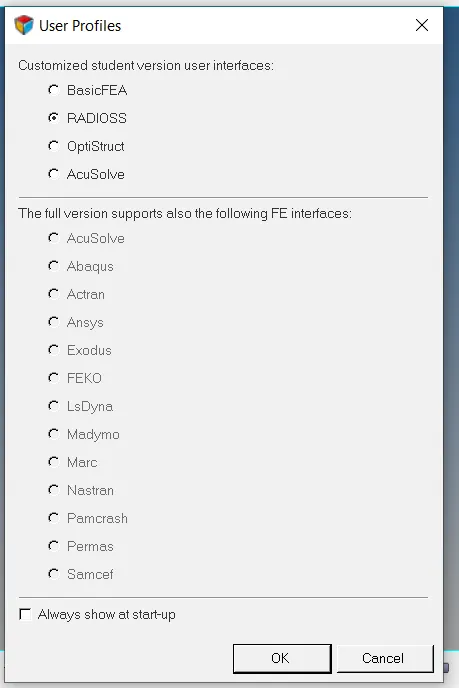
FIG 1. USER PROFILE
STEP 2) Import the model using Import solver deck option. Change to shaded view from wireframe mode.
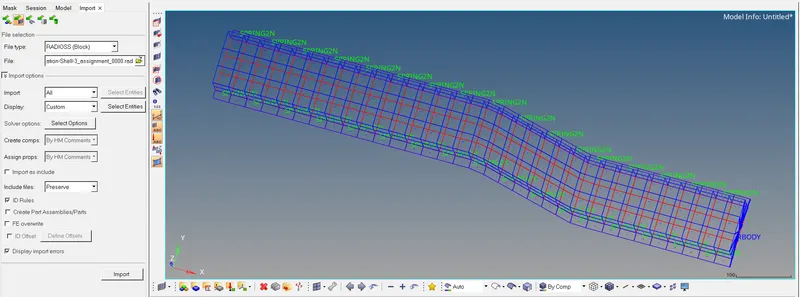
FIG 2. IMPORTING MODEL
STEP 3) Select the engine card & change the run time, Tstop to 55 as shown below.
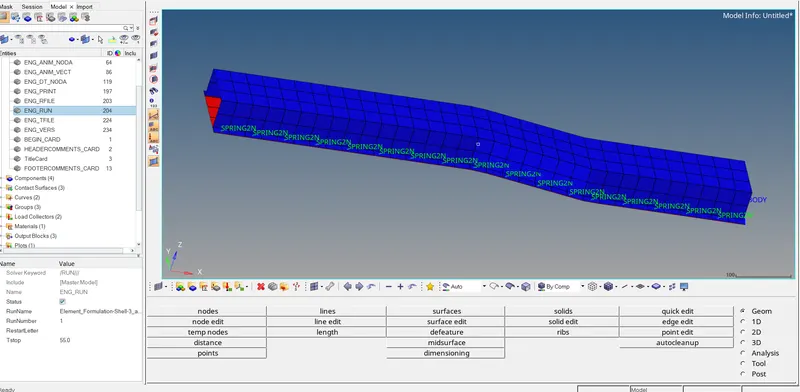
FIG 3. RUN TIME INPUT REPRESENTATION
STEP 4) Select the Engine animation card & also update the animation steps, Tstart during simulation to minimum value of 25.
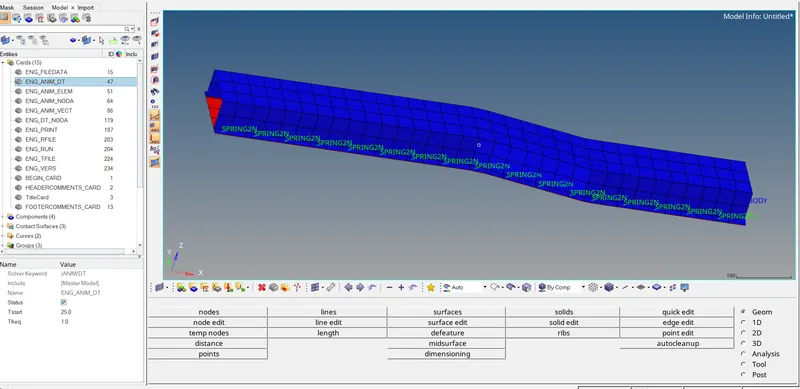
FIG 4. ANIMATION STEP INPUT REPRESENTATION
STEP 5) Use Analysis > Radioss option to start the simulation.

FIG 5. RADIOSS PANEL REPRESENTATION
STEP 6) Select the starter rad type file and make sure include connectores option is checked in and use -nt 4 in option as shown & simply select radioss button.

FIG 6. RADIOSS PANEL REPRESENTATION
STEP 7) After simulation the below window will be popped out to indicate that simulaion has ended.
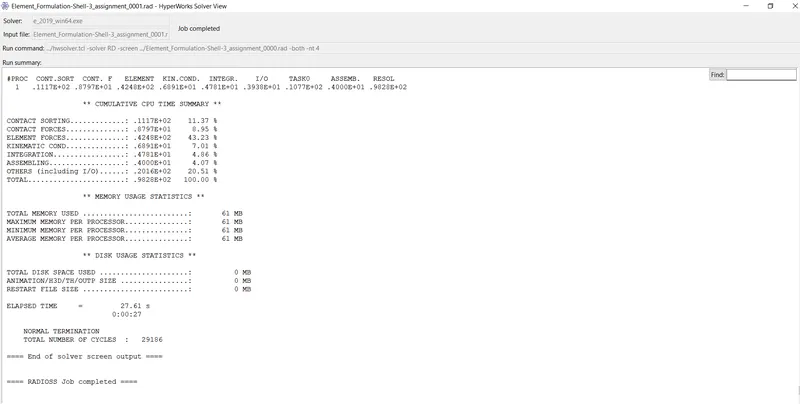
FIG 7. RADIOSS PANEL REPRESENTATION
STEP 8) Select the hyperview button as shown or click the results button from the runned simulation window.
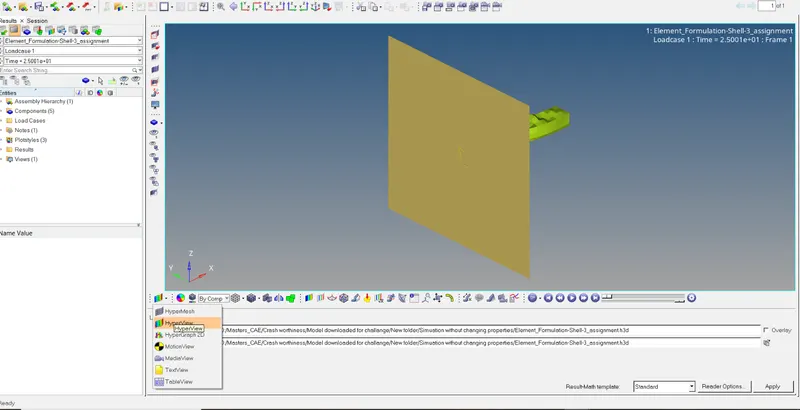
FIG 8. HYPERVIEW PANEL REPRESENTATION
STEP 9) Select the contour option to display the results of the simulation in contour plot mode.
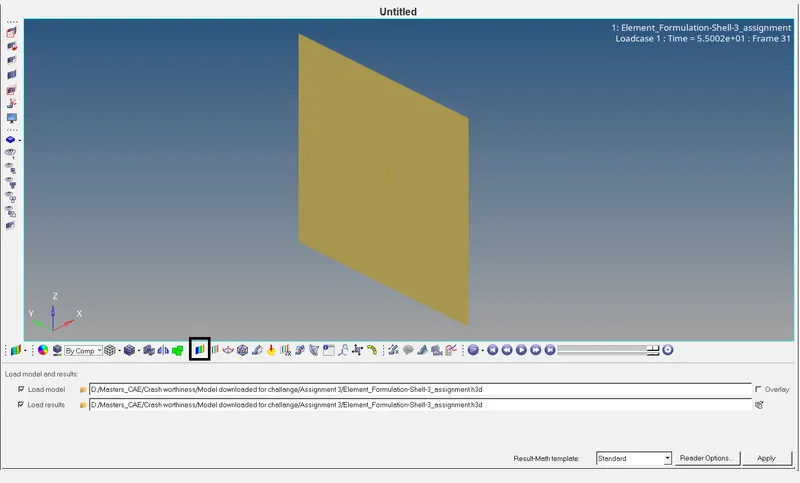
FIG 9. CONTOUR OPTION REPRESENTATION
STEP 10) Select the hourglass energy in the reult type and hit apply buttton to get the plot results of the simulation with respect to hourglass energy.
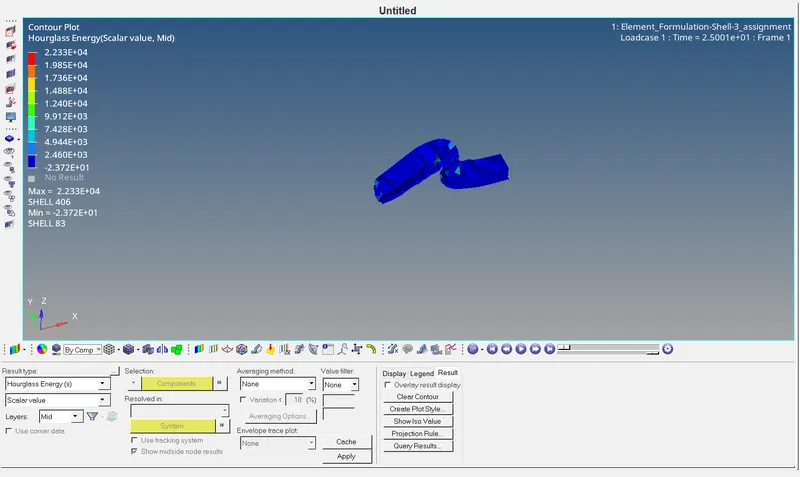
FIG 10. HOURGLASS ENERGYPLOT RESULTS REPRESENTATION
STEP 11) Similarly get the contour results for dispalcement & von mises stress.
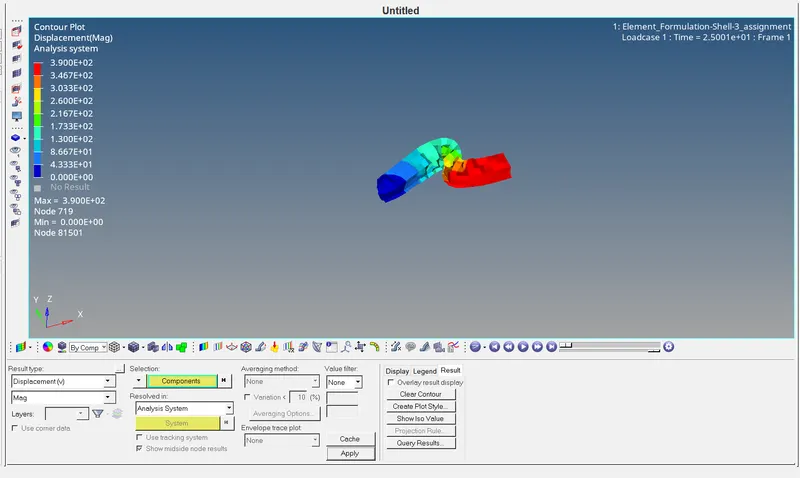
FIG 11. DISPLACEMENT RESULTS REPRESENTATION
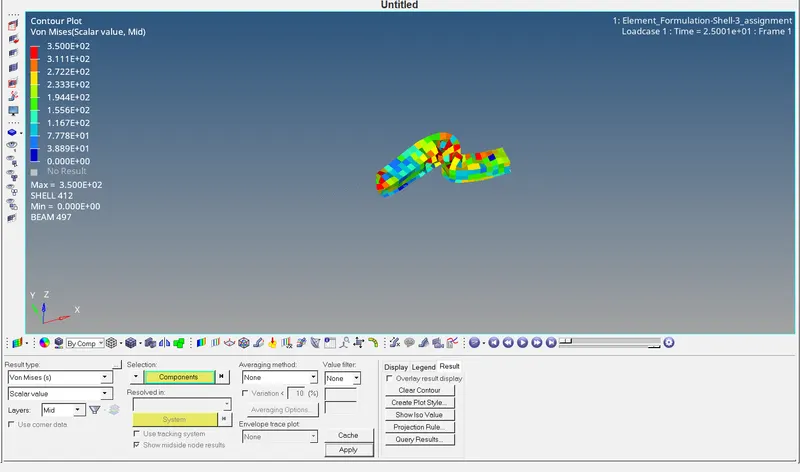
FIG 12. VON MISES RESULTS REPRESENTATION
STEP 12) Select Hypergraph 2D option to plot the results in graph model.
FIG 13. HYPERGRAPH 2D OPTION REPRESENTATION
STEP 13) Select the T01 file in the data file option and select Global variables, internal energy, kinetic energy or hourgalss energy, MAG in Y type, Y request, Y Component respectively.
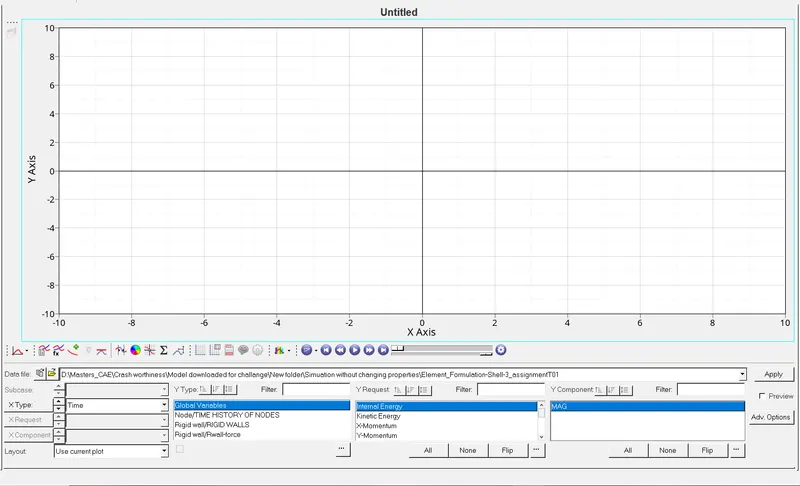
FIG 14. HYPERGRAPH 2D REPRESENTATION
STEP 14) Select all the parameters in Y request for which graph has to be plotted.
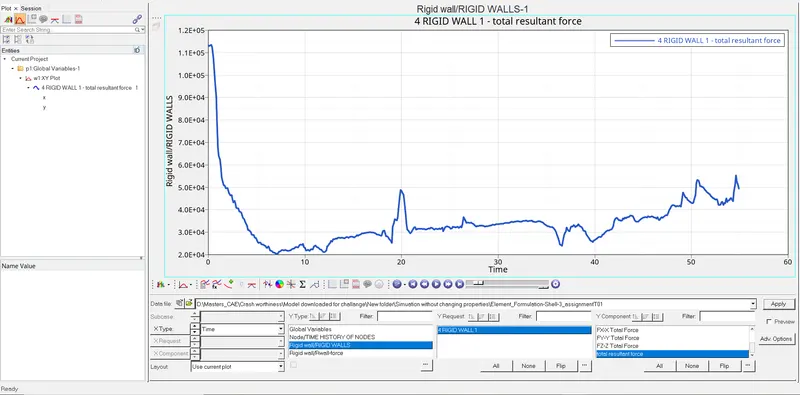
FIG 15. RIGID WALL REPRESENTATION
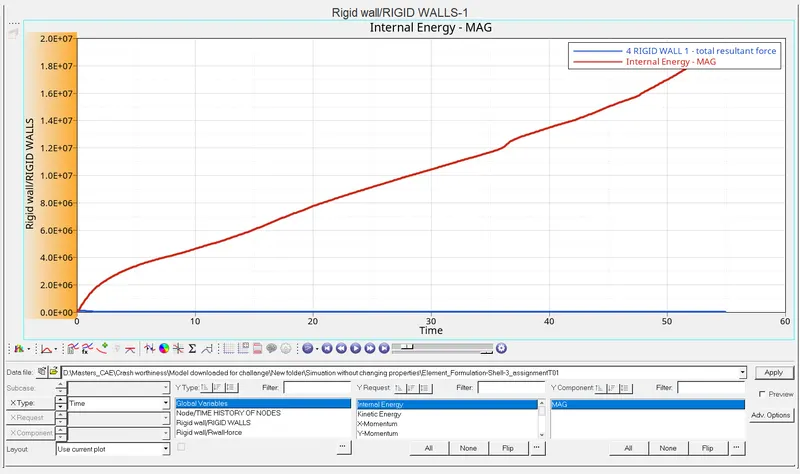
FIG 16. INTERNAL ENERGY REPRESENTATION
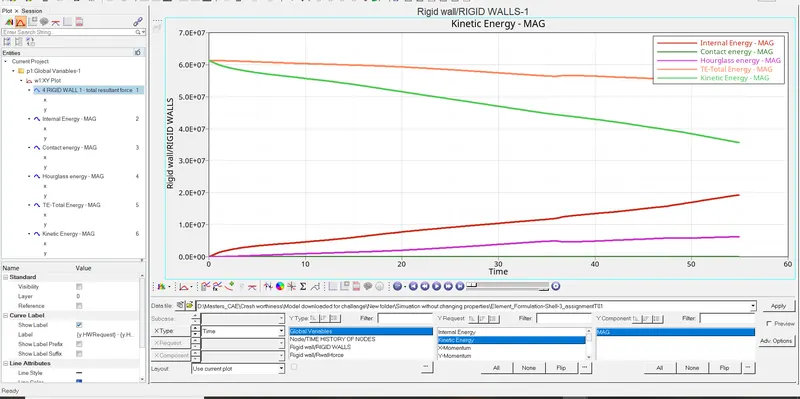
FIG 17. KINETIC ENERGY REPRESENTATION
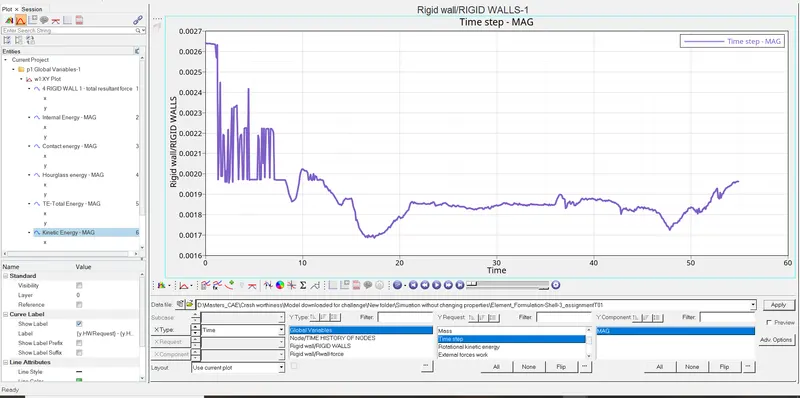
FIG 18. TIMESTEP REPRESENTATION
STEP 15) Similary repeat the above steps with change in element properties like IQEPH, Iplas, Ithick etc... to get the refined results for the same crash beam.
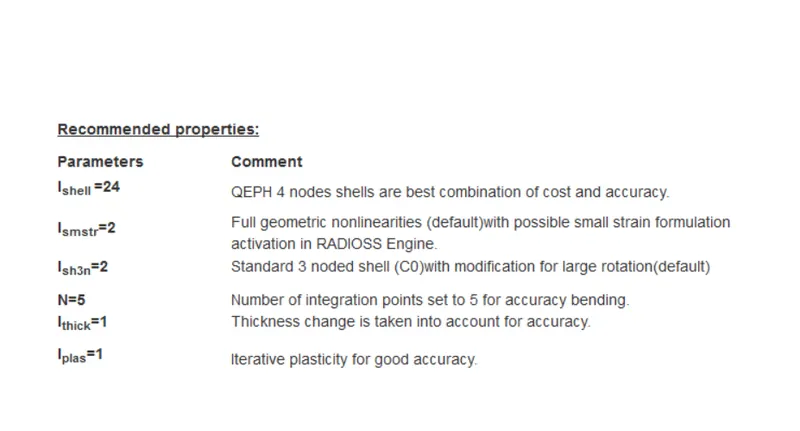
FIG 19. CHANGE IN SHELL PARAMETERS
STEP 16) Select the hat section under properties and change the element properties as shown in the above image. Similarly do for close-out panel.
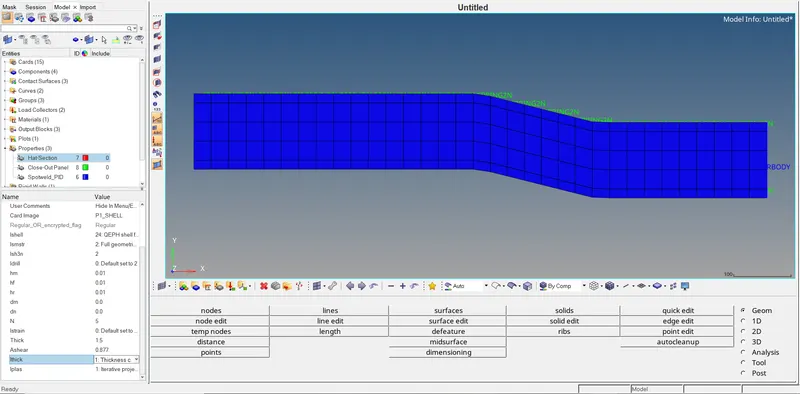
FIG 20. SHELL ELEMENT PROPERTIES
STEP 17) Similarly do take plot contour and graph results.
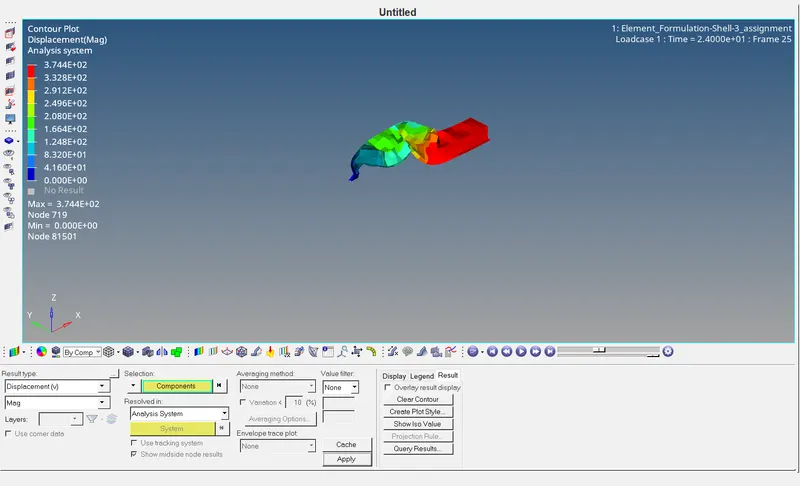
FIG 21. CONTOUR DISPLACEMENT RESULTS
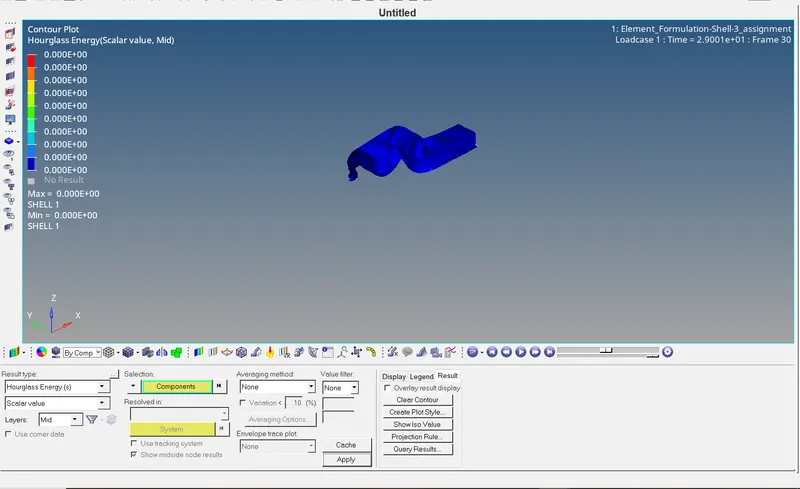
FIG 22. CONTOUR HOURGLASS ENERGY RESULTS
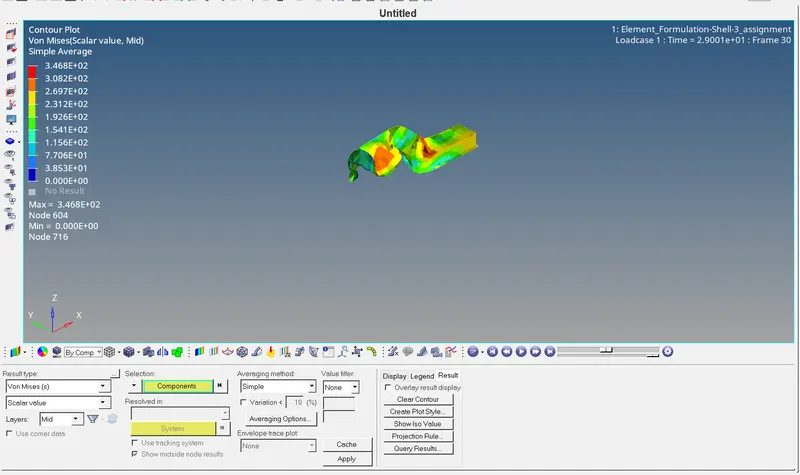
FIG 23. CONTOUR VON MISES RESULTS
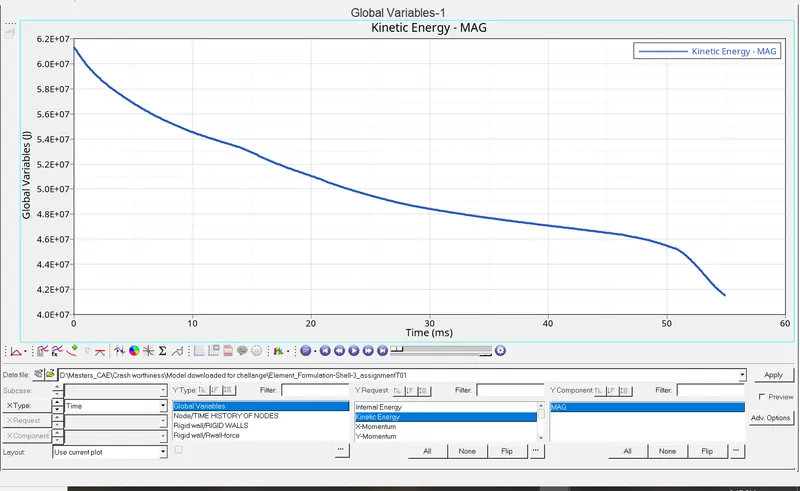
FIG 24. KINETIC ENERGY PLOT RESULTS
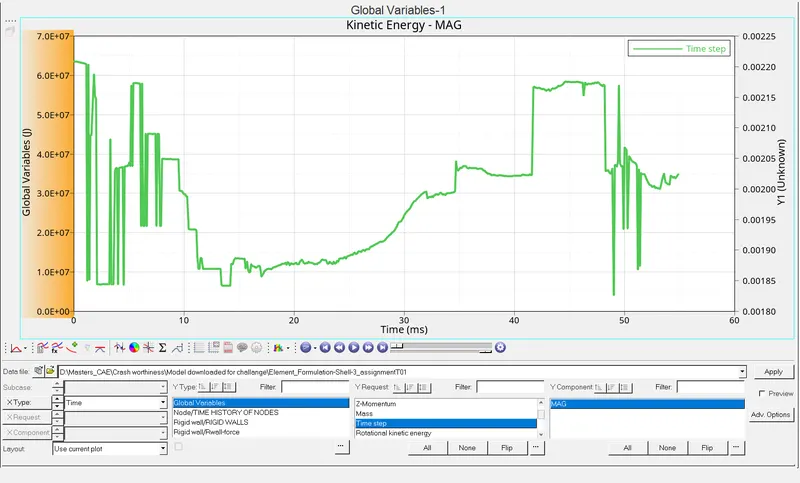
FIG 25. TIME STEP PLOT RESULTS
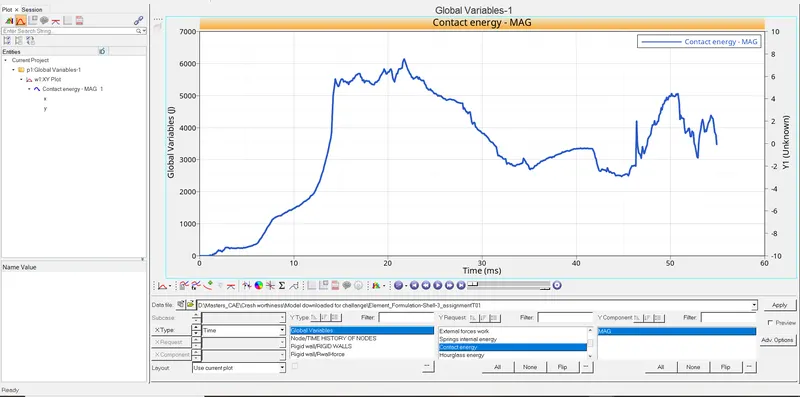
FIG 26. CONTACT ENERGY PLOT RESULTS
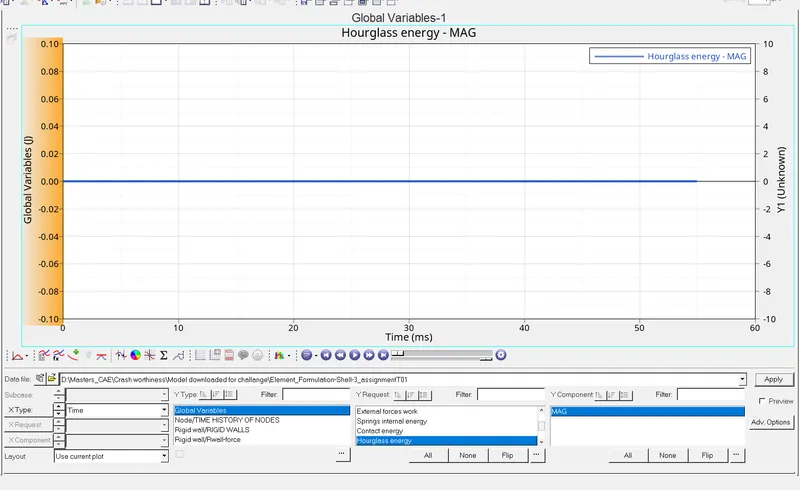
FIG 27. HOURGLASS ENERGY PLOT RESULTS
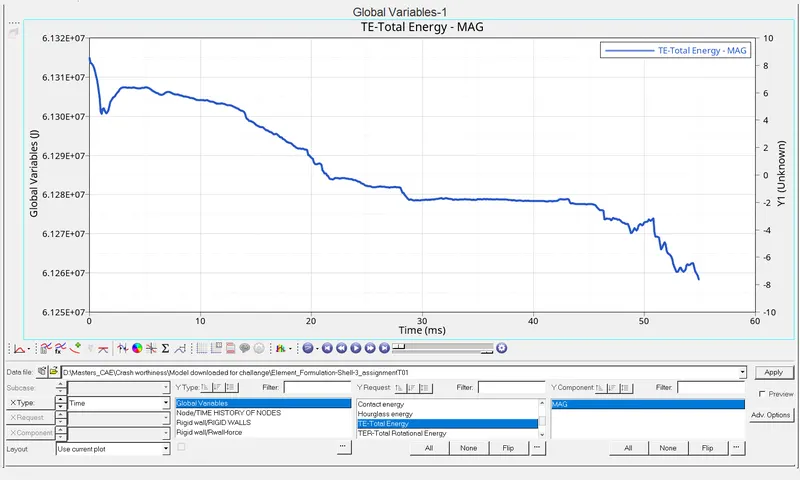
FIG 28. TOTAL ENERGY PLOT RESULTS
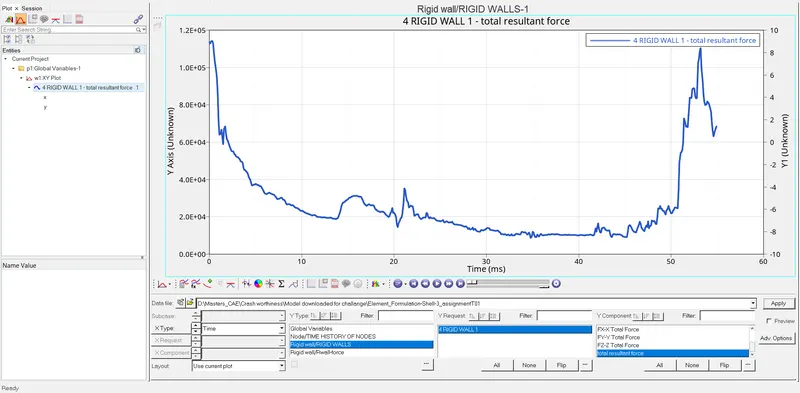
FIG 29. RIGID WALL PLOT RESULTS
COMPARSION OF RIGID WALL FORCE:
FIG 30. RIGID WALL PLOT RESULTS WITH FORMULATION INCLUDED FIG 31. RIGID WALL PLOT RESULTS WITHOUT FORMULATION INCLUDED
COMPARSION OF TIME STEP:
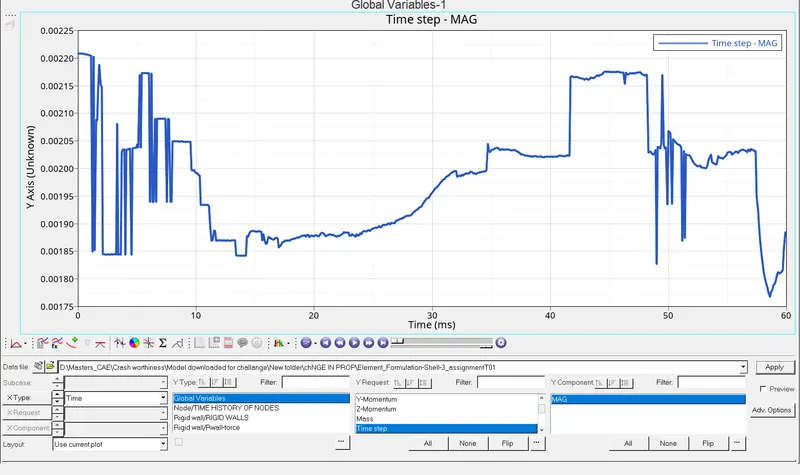 FIG 32. TIME STEP PLOT RESULTS WITH FORMULATION INCLUDED FIG 33. TIME STEP PLOT RESULTS WITHOUT FORMULATION INCLUDED
COMPARSION OF CONTACT ENERGY:
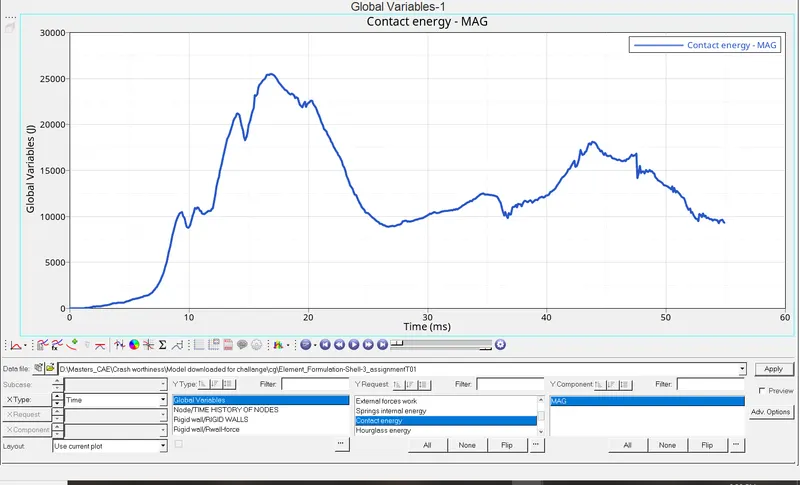
FIG 34. CONTACT ENERGY PLOT RESULTS WITH FORMULATION INCLUDED FIG 35. CONTACT ENERGY PLOT RESULTS WITHOUT FORMULATION INCLUDED
COMPARSION OF HOURGLASS ENERGY:
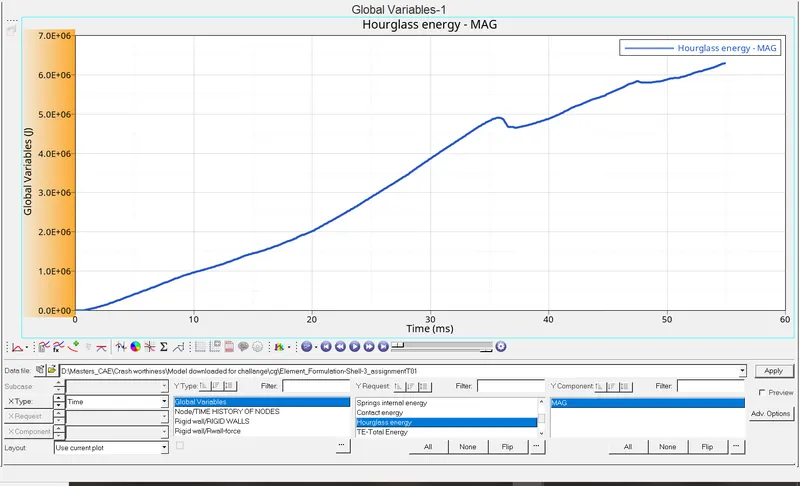
FIG 36. HOURGLASS ENERGY PLOT RESULTS WITH FORMULATION INCLUDED FIG 37. HOURGLASS ENERGY PLOT RESULTS WITHOUT FORMULATION INCLUDED
HOURGLASS ENERGY:
When the structure gets deform, normally stress will be activated in that particular structure. when this stress doesn't have effect on the structure that is getting deformed or no stress is recorded, then the sructure is said to be in hourglass mode. This can be identified from the pictorial presented above.
INTRODUCTION OF SHELL FORMULATION:
The effect of stress can be made null by intoducing shell formulation called Ishell = 24 (QEPH). This method is called Physical Stabilization method. Here the stiffness is introduced directly at the material level, which reduces the effect of the stress.
METHOD OF CONTROLLING HOURGLASS:
1) PERTUBATION ( Viscous method ) - In this method, a dapming force is added to the deformed node which in turn induces stiffness to stabilize the deformation.
2) Physical stabilization ( Stiffness method ).
COMPARSION OF TOTAL ENERGY OF THE SIMULATION:
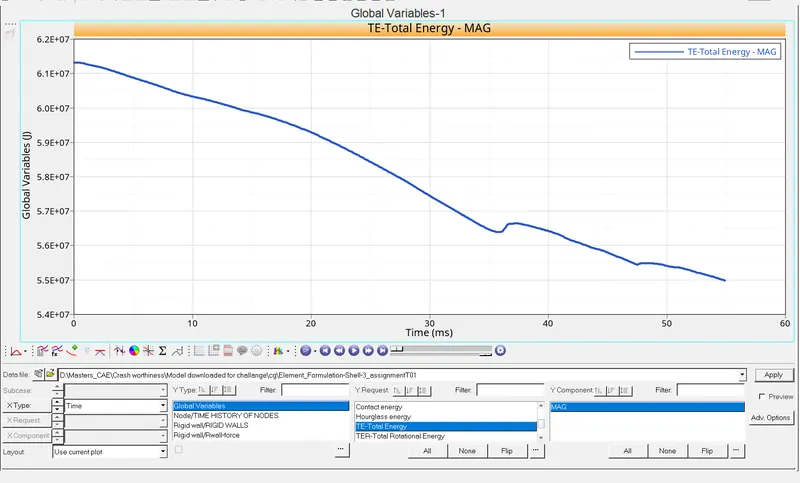
FIG 38. TOTAL ENERGY PLOT RESULTS WITH FORMULATION INCLUDED FIG 39. TOTAL ENERGY PLOT RESULTS WITHOUT FORMULATION INCLUDED
Fom all the above comparison given, when the initial velocity is given at the rigid end velocity makes the crash beam to accelerate towards the rigid wall. While accelerating, the crash beam shrinks due to the resistance (wall) applied at other end. This shrinkage makes internal structure to deform which give rises to various results as plotted above.
RESULT & CONCLUSION:
Thus the crash beam has been simulated with the given criteria & the 2D element formulation, to compare the results & contour values of both the simulation.