crash Tube SImulation
AIM:
To RUN the simulation in the given model with and without properties and compare the energy and plot graphs according to the Given Conditions.
PROCEDURE:
Importing File into Radioss,
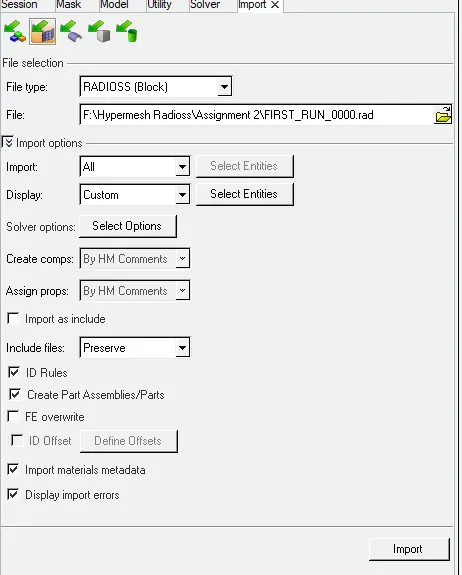
- Select IMPORT SOLVER DECK>S select the radioss file of the previous loaded assignment > Import
- The model will be visible on the screen after choosing Import
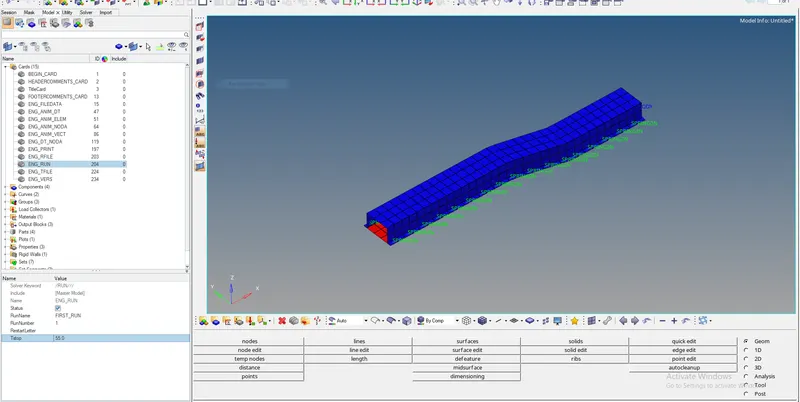
* From the engine card change the run time as 55 second as given in the data.
* For the Animation steps the avg 50 is taken and frequency is calculated by the following equation.
Frequency Calculation:
Frequency = Termination End Time/ Steps Required
Frequency =55/50
F=1.1
CASE 1:
* Running the simulation without any changes in properties, basic simulation
* choose ANALYSIS and create a new folde to save the simulating files specifically.
* And give -nt 4 for performing analysis as it represents no of threads and 4 cpus combined for running the operation
choose radioss.

The solver runs and the Hyperworks solver file gets displayed.


* From the above output after simulation we can able to find energy and mass error.
as Energy error = -10.30%
MASS ERROR = 0.1659E-03
* From the above results the 3D ANIME FILE can be veiwed inHYPER VEIW mode
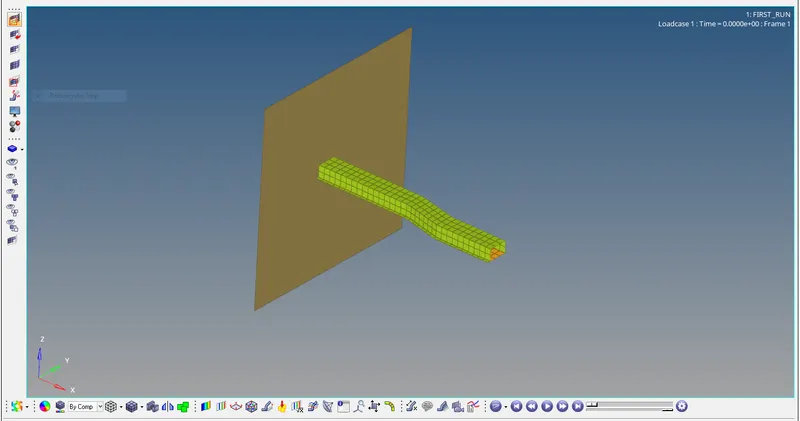
The below attached model is the gif of the model without properties:
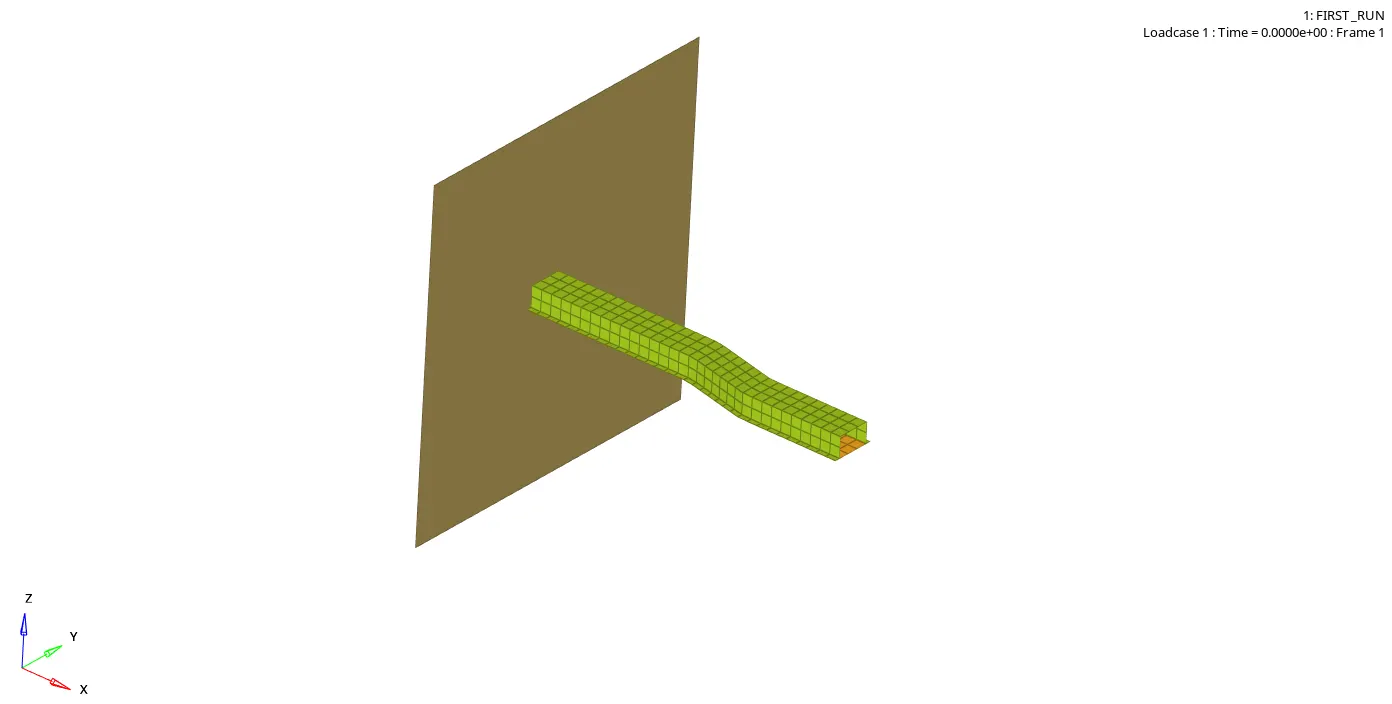
* After doing the 3d simulation the screen is splitted in to 3 parts for veiwing results of the model in Graphical representation.
* The screen is splitted using Page window layout optiion which is right below the preferences option in the totl bar and choose 3 layouted page.
* For veiwing graph Hypergraph 2D option is choosed .this used to represent graphical form for the results
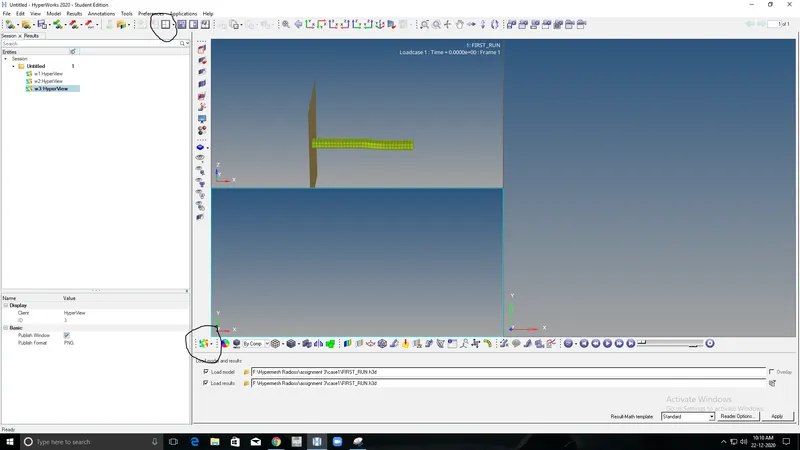
* The Circled Option are used to create page layout and to veiw in Hyper graphic mode.
* Select an segment in the Hypergraphic mode and Select TO1 file which stores The graphical data from the CAse 1
* Select an seperate layout for rigid walls and energy for better understanding.
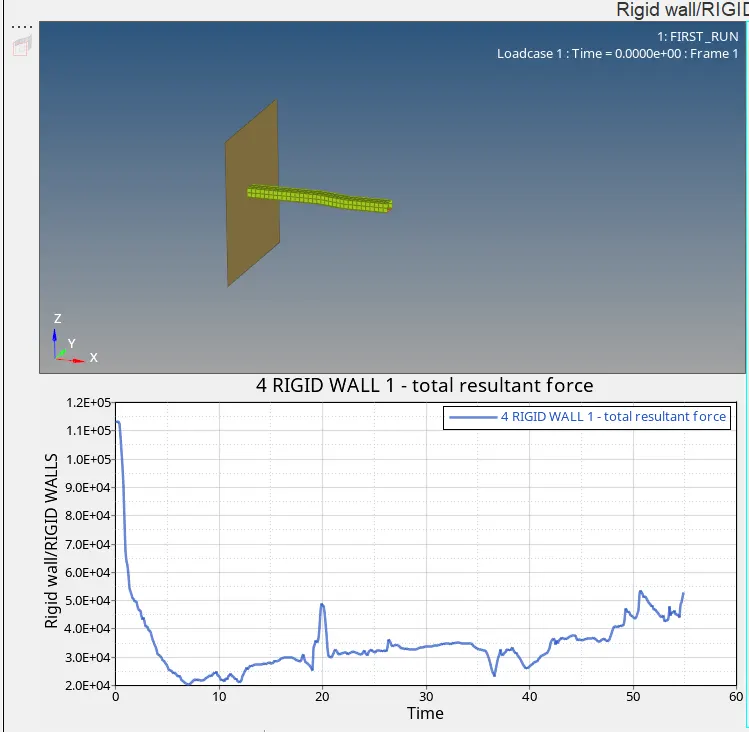
* For Rigidwalls select:Rigid walls> Rigid wall 1 > total resultant force and choose apply.

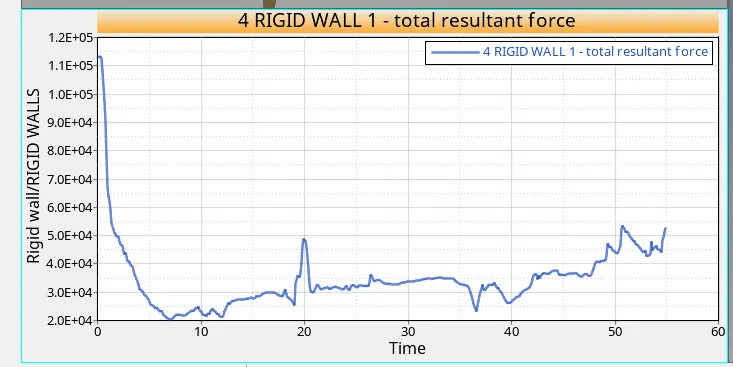
* Since the bar is attached with the wall the energy starts from the point above 1.1E+05. due to sudden impact and the force starts decreasing.
* select the energies to be plotted and displayed in the graph sheet.
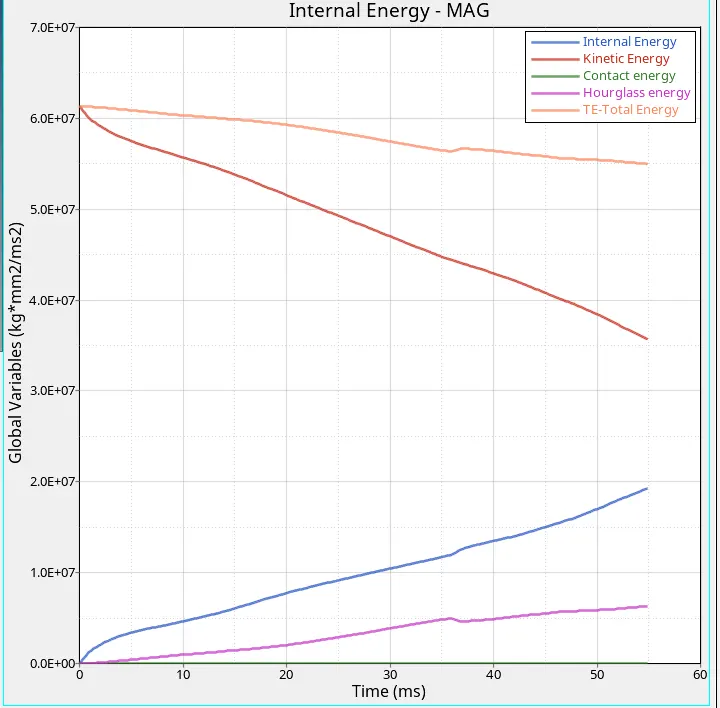
* for energies Choose: Global variables > Internal energy, kinetic energy, total energy, hourglass energy,contact energy> Mag and choose apply.

GRAPHICAL DESCRIPTION.
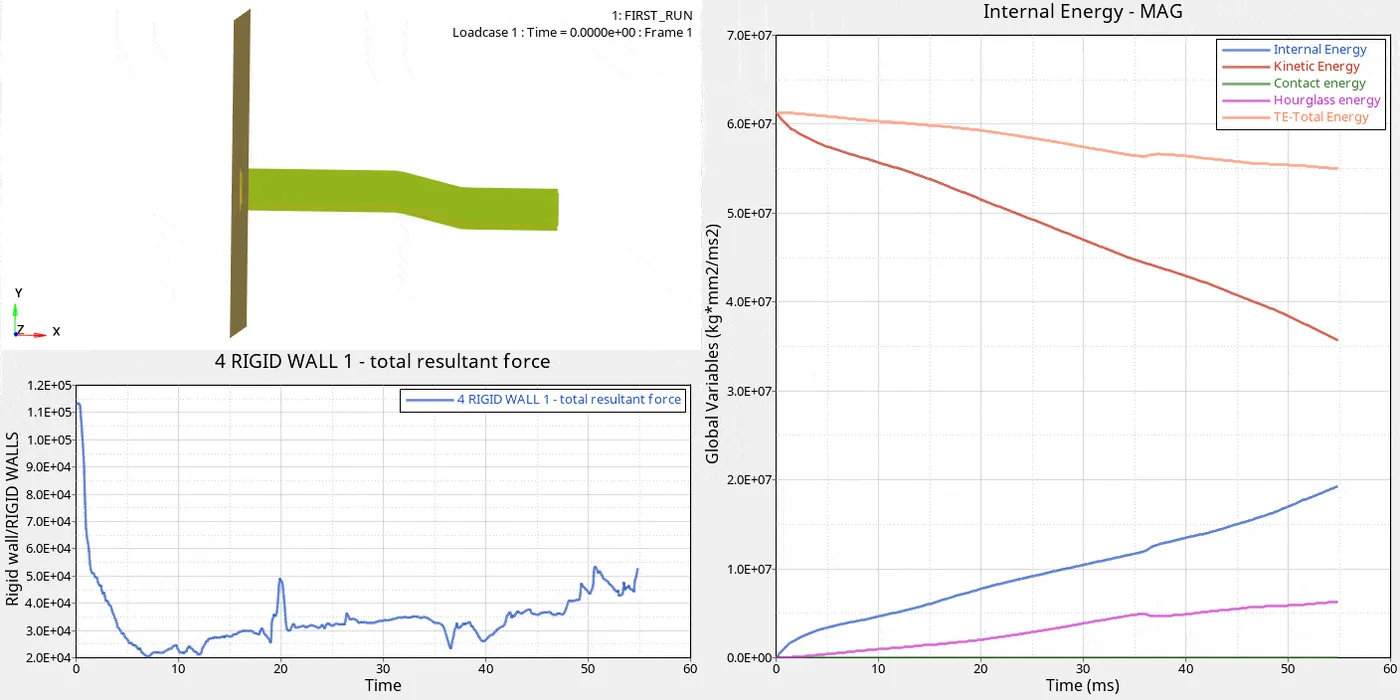
* Using Hypergraph 2D, we plot Energy Characteristics (Internal, Kinetic, Hourglass, Contact,Total Energy)and Rigid wall characteristics (Resultant Force)
* The Internal energy was 0 initially, later it increases change in work done, approximated 2.0E+07
* kinetic energy is maximum at the initial condition, after crashing in rigid wall, it slows down and 4.0E+04
* Total energy is the sum of KE+HE+IE, which should be a flat line, decreases due to hourglass energy deflection approximated to 5.5E+07
* Contact energy is found be 0 Throughout the process.
The above mentioned process is explained clearly using the gif below:
CASE 2: wITH PROPERTIES
GIVEN PARAMETERS :
Recommended Parameters are to be given as input, for the same components, in which input datas are,
| Parameters | Comment |
|
Ishell =24 |
QEPH 4 nodes shells are best combination of cost and accuracy. |
|
Ismstr=2 |
Full geometric nonlinearities (default)with possible small strain formulation activation in RADIOSS Engine. |
|
Ish3n=2 |
Standard 3 noded shell (C0)with modification for large rotation(default) |
| N=5 | Number of integration points set to 5 for accuracy bending. |
|
Ithick=1 |
Thickness change is taken into account for accuracy. |
|
Iplas=1 |
Iterative plasticity for good accuracy. |
Edit the Given Parameters in the Properties card as per given values in both Hat-section and close out pannel
*Same properties is used for both Hat Section and closed out panel.
* And same procedure is to be followed on analysis done on previous model.

* From the Output file its clear that the Energy Error = -0.1% and Mass Error =0.1659E-03
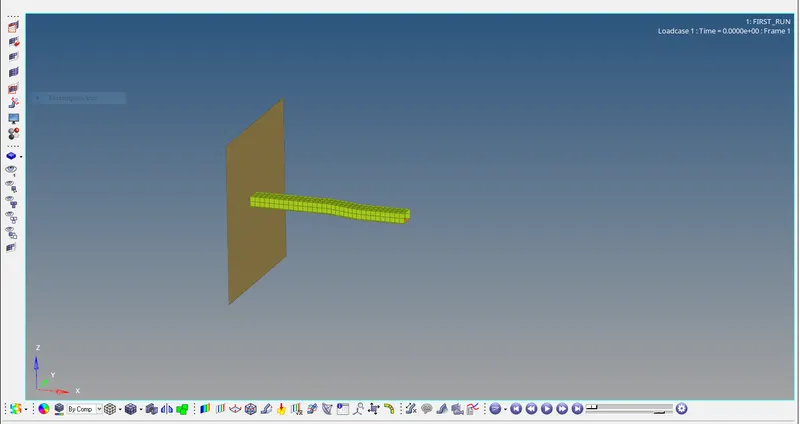
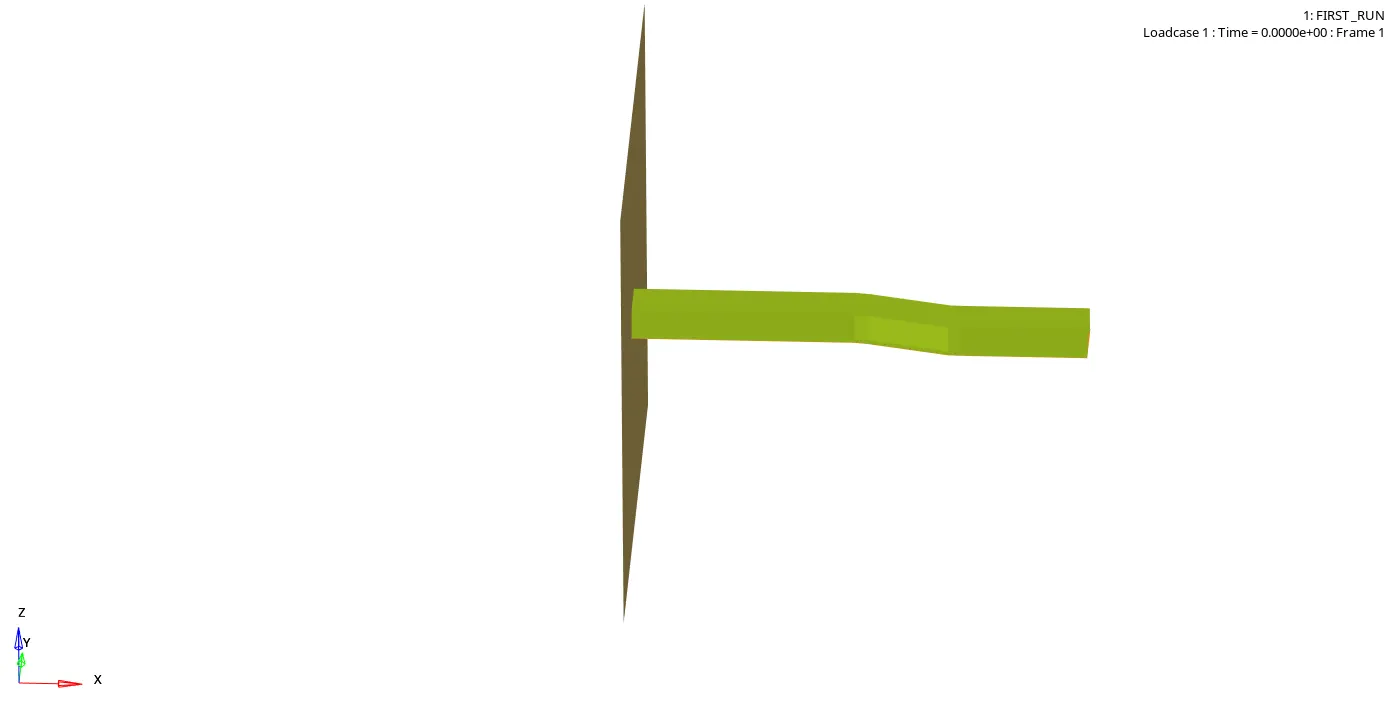
* Click on Resullts, to view animated view of the model
* This model is loaded with properties.
* As Done Above Split the screen layout using page window layout option for graphical representation.
* select hypergraph 2D option
* select an layout and import the graph from TO1 FILE in case 2 with properties folder this time.
* give the boundary conditions for rigid walls as same as the process done above.
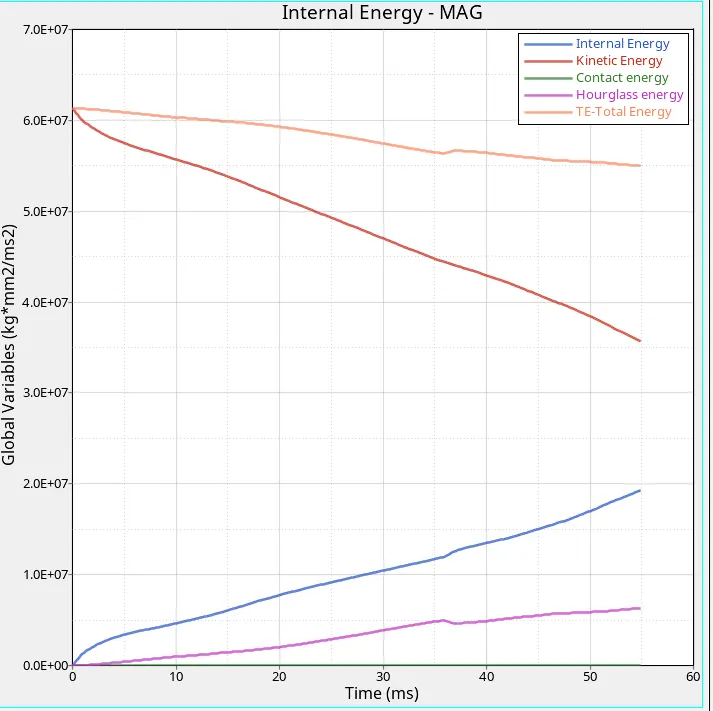
For energy choose all the energies to be plotted and give the magnitude and choose apply.
GRAPH DESCRIPTION:
* Using Hypergraph 2D, we plot Energy Characteristics (Internal, Kinetic, Hourglass, Contact,Total Energy)and Rigid wall characteristics (Resultant Force)
* The Internal energy was 0 initially, later it increases change in work done, approximated 1.7E+07
* kinetic energy is maximum at the initial condition, after crashing in rigid wall, it slows down and 4.4E+04
* Total energy is the sum of KE+PE+IE, which is a flat line, due to optimization of hourglass energy in modified element property found to be stable.
* Contact energy is found be 0 Throughout the process.
.0 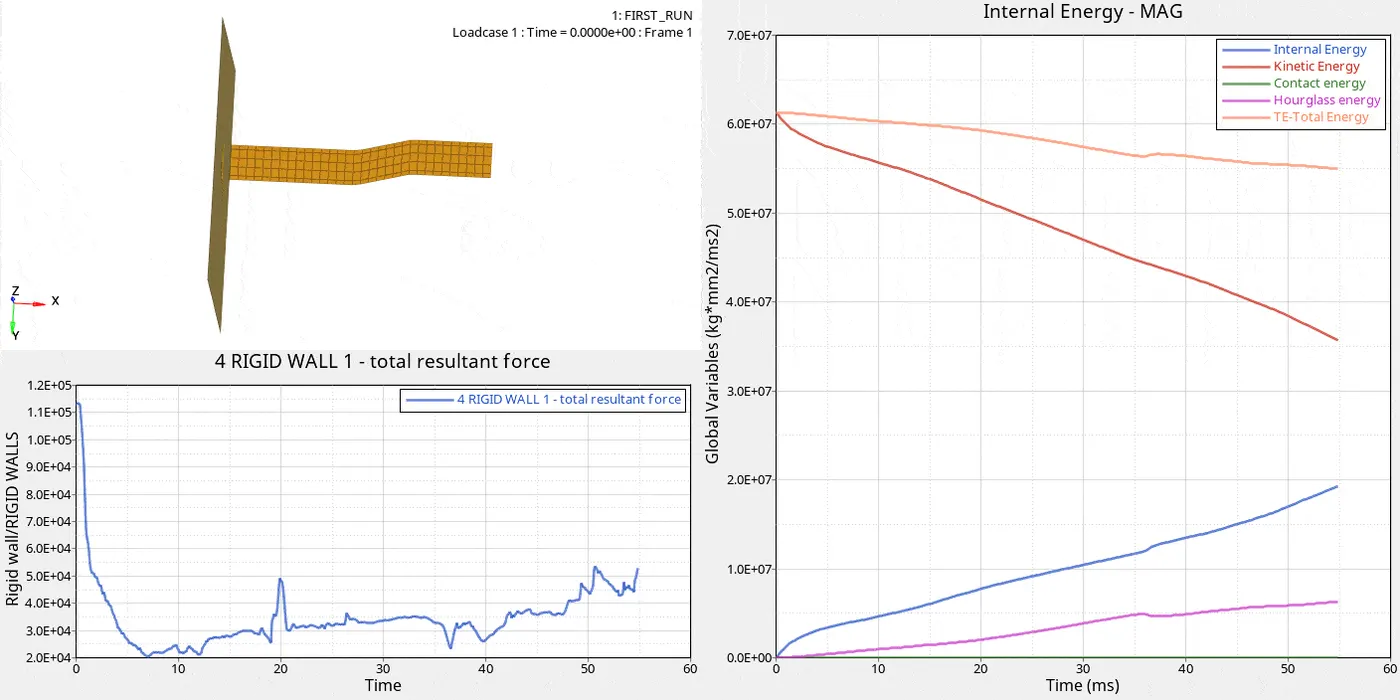
ENERGY ERROR AND MASS ERROR :
ENERGY ERROR :
When the elements are subjected to deformation, there will be multiple forces acting on the elements, the elements will undergo change in shape, which is unrealistic, without proper shape, in which system induces some opposite forces to rectify the deformation that is induced by hour glass energy, is known as Energy error.
- "If the error is negative, it means that some energy has been dissipated.
In case of under integrated elements (Belytschko shells, solids with 1 integration point), the Hourglass energy can also explain a negative Energy Error since it is not counted in the energy balance. The normal amount of Hourglass energy is about -10% to -15%".
- "If the error is positive, there is an energy creation.
In case of using QEPH shell formulation (Ishell=24) or fully integrated elements, the Energy Error can be slightly positive since there is no Hourglass energy and the computation is much more accurate. An error of +1% or +2% is acceptable
If the positive energy error is greater than 2%, the source of this energy has to be identified. Incompatible kinematic conditions can lead to such a situation".
MASS ERROR:
When there is an energy error affecting the elements, the solver usually add up or removes mass according to the requirement involuntarily, that caused mass error. Usually mass error upt 2-3% is considered to be acceptable.
Comparing both models , we arrive for the conclusion is that,
Energy Error = -10.3% (Without Modification) & -0.1% (With Modification)
Mass Error =0.1659E-03 (Without Modification) & 0.1659E-03(With Modification) i.e, 0.0001659 < 2-3% and is neglible
Falls under limit of acceptance.
HOUR GLASS COMPARISON:
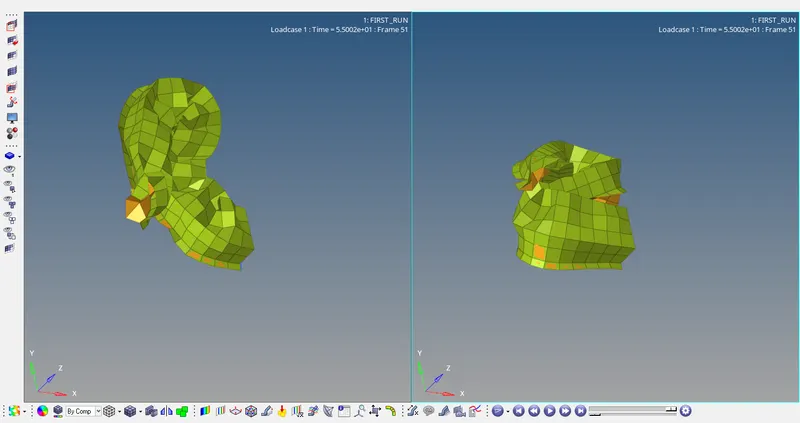
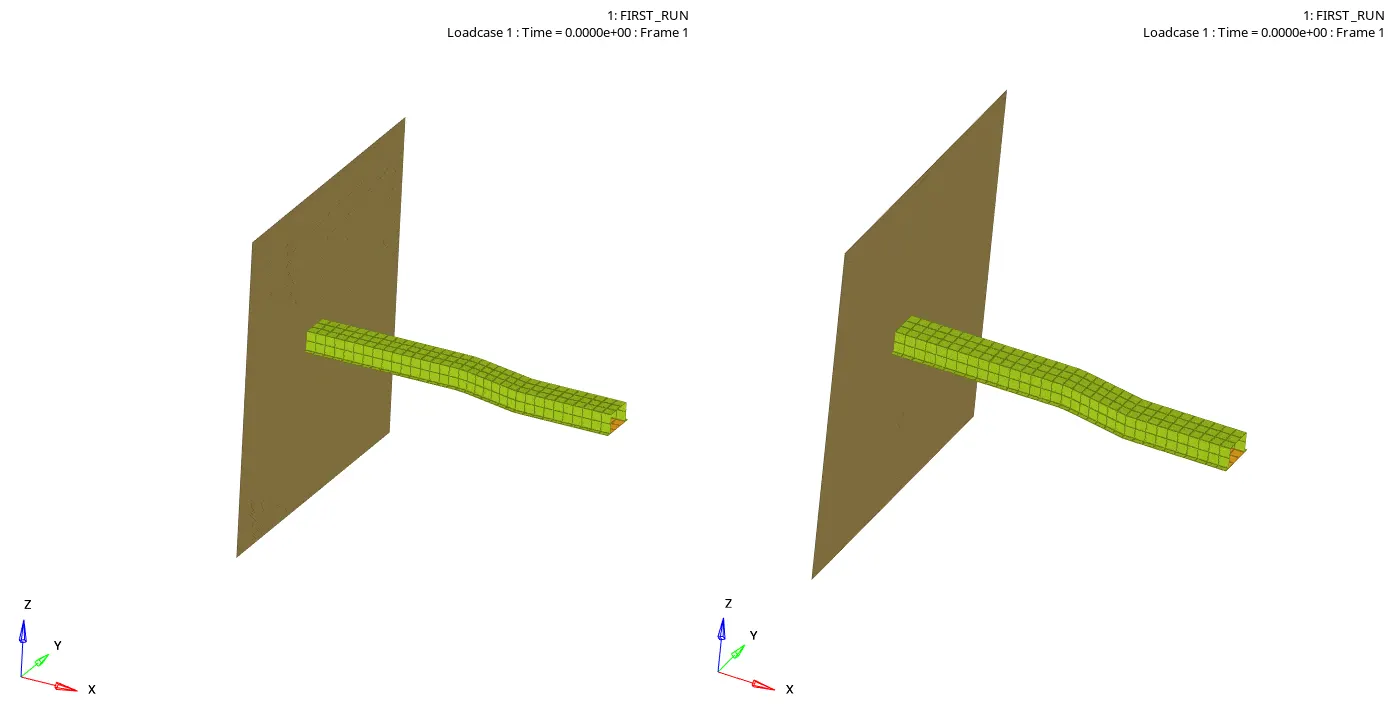
1) without properties. 2) with properties.
HOURGLASS treatment in QEPH:
The GIF shows the comparison of elemental deformation between Q4(1 to 4) Vs QEPH(24) way of processing the deformation that occurs. We can find QEPH retains its structure, that by processing the data by using stiffness method. The QEPH is also known as Improved Under Integrated method.In QEPH the stifness factor is directly added to the material so that it is more accurate than Q4 and also less in cost in compared with fully integrated Whereas, on other hand Q4 is an default way of hypermesh to process the data, which is quicker and less accurate, and we can see the elemental structures getting broken, which is not ideal.
COMPARISON OF DATAs PROCESSED WITHOUT AND AFTER MODIFICATION:
- The Internal energy on default conditions is approx 2.0E+07, whereas on Modifying the properites we get 1.7E+07
- kinetic energy on default conditions is approx 4.0E+04, whereas on Modifying the properites we get 4.4E+04
- Total energy is the sum of KE+PE+IE, which should be a flat line is not achieved, on modified model, due to optimization of hourglass energy in modified element property found to be stable.
- Contact energy is found be 0 Throughout the process on both the simulations.
These comparisons are projecting that the integration conditions , by means of which data is been processed and manages. QEPH is better in processing the data than Q4.Strain formulation method induced.Continous thickness data taken into account are the factors that created better impact.