Study of vehicle models 'EV_defaults_in' and 'PRIUS_Jpn_defaults_in' using advisor tool.
Aim:
Study of vehicle models 'EV_defaults_in' and 'PRIUS_Jpn_defaults_in' using advisor tool.
Objectives:
1.
To study and analyze the EV_defaults_in vehicle model.
2.
Conducting gradeability test with PRIUS_Jpn_defaults_in.
Introduction:
An advanced vehicle simulator model called ADVISOR has been developed at the National Renewable Energy Laboratory to allow system-level analysis and trade-off studies of advanced vehicles.
Because of ADVISOR's fast execution speed and the open programming environment of MATLAB/Simulink, the simulator is ideally suited for doing parametric studies to map out the design space of
potential high fuel economy vehicles (3X) consistent with the goals of the Partnership for New Generation of Vehicles (PNGV).
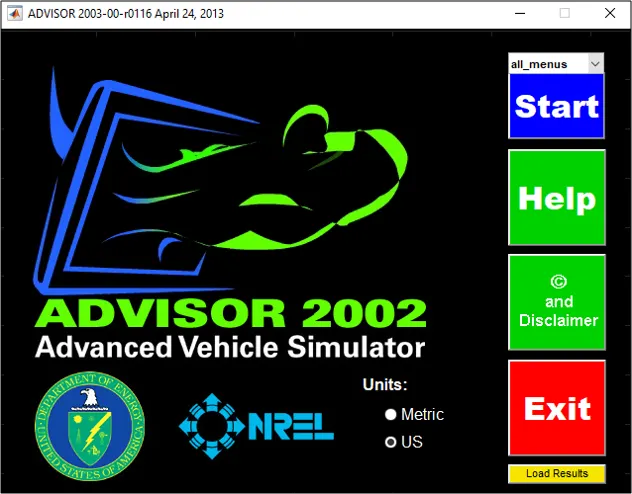
Figure01: Initializing interface of ADVISOR 2002 tool.
The model was created in support of the hybrid vehicle subcontracts with the auto industry for the Department of Energy. ADVISOR approximates the continuous behavior of a vehicle as a series of
discrete steps during each of which the components are assumed to be at steady state. That is, at each time step, the effects of changing current, voltage, torque, and RPM are neglected. This
allows efficiency or power loss tables, which are generated by testing a drivetrain component at a fixed torque and RPM (and current and voltage, if applicable), to be used to relate the power
demands of the components at each time step. A significant advantage of using a model that is in the Simulink/MATLAB environment is the flexibility and ease of changing the model, such as
replacing one control strategy or regenerative braking algorithm with another. MATLAB also allows easy plotting of results that makes detailed analysis of vehicle configurations possible. ADVISOR
is driven by the input driving profiles which can be the classic speed vs. time, such as the federal urban driving schedule (FUDS), or a speed and grade vs. time driving profile. With a given
driving profile goal, ADVISOR then works its way backwards from the required vehicle and wheel speeds to the required torques and speeds of each component between the wheels and the energy
source, which is either fuel from the hybrid power unit (HPU) or electricity from the batteries. Limits for each of the components are included, so the actual speed vs. time profile computed is
the one that is within the limits of all components and includes all component losses and vehicle drag.
What is FTP?
The EPA's (Environmental Protection Agency) Fedral Test Procedure (FTP) commonly known as FTP-75 for the city driving cycle, are a series of tests defined by EPA to measure tailpipe emissions and
fuel economy of passenger cars. (excluding light trucks and heavy duty vehicles)
City Driving (FTP-75)
Highway Driving (HWFET)
Aggressive Driving (SFTP US06)
Optional Air Conditioning (SFTP SC03)
What is Gradeability Test?
The grade test routine in ADVISOR will determine the maximum grade on which the vehicle can sustain the specified constant speed. The test routine can be accessed both from the GUI and the Matlab
command window.

Figure02: Block from ADVISOR GUI showing 'Gradeability Test' option.
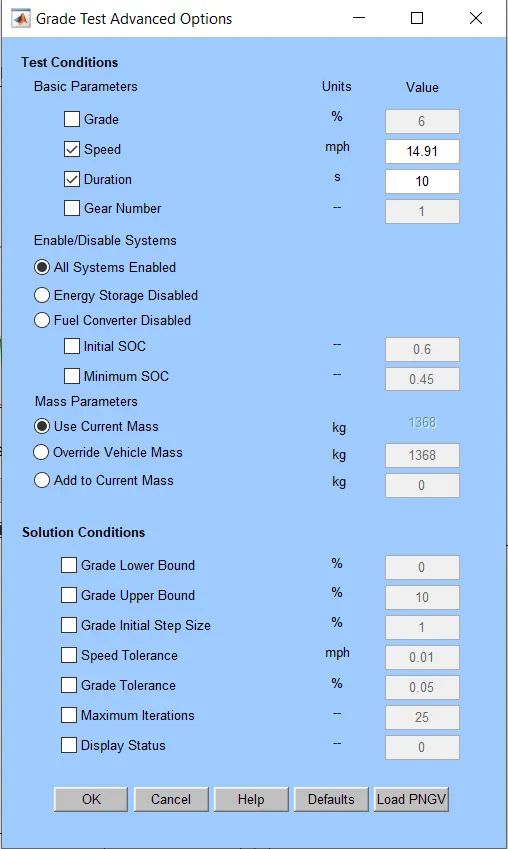
Figure03: Showing advance options for 'Gradeability Test'.
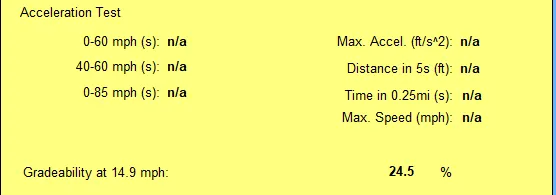
Figure04: Simulation results for 'Gradeability Test'.
From the GUI...
A grade test can be performed via the Simulation Setup window. The user can specify the parameters for the test in the Grade Test Advanced Options window which is opened by selecting Grade
Options. The test can be run with a drive cycle by selecting the Gradeability Test in the Additional Tests box, or without a drive cycle by selecting Test Procedure and then TEST_GRADE from the
pull down menu. The Grade Options window is also accessible from the Autosize Setup window.
Problem Statement:
1.
For EV_defaults_in file, if cargo mass is 500 kg with all other default conditions, can the vehicle travel for 45 km with FTP drive cycle? Conclude your observations.
2.
In the above case, try changing the battery capacity and repeat the simulation.
3.
Perform gradeability test with PRIUS_Jpn_defaults_in file
Compare your results in table and conclude.
Solution:
01.
Considering mass 500 kgs and keeping other defaults conditionsfoe EV_defaults_in.
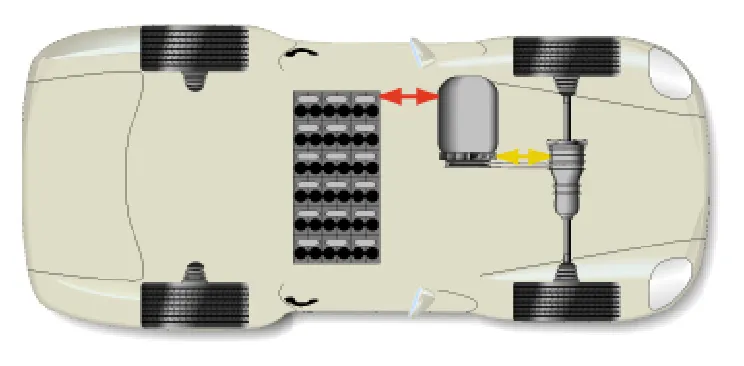
Figure05: Vehicle model for EV_Defaults as shown in the first GUI of ADVISOR tool.
Figure05 shows the vehicle model for the EV_defaults consisting of Battery, Motor or Generator axle and wheels.
It is a Forward wheel drive model. Power is transmitted from battery to axle of front wheels through the electric motor.
Specified technical specifications or types of the components can be easily selected from the drop down menu shown in the next GUI of the ADVISOR tool.
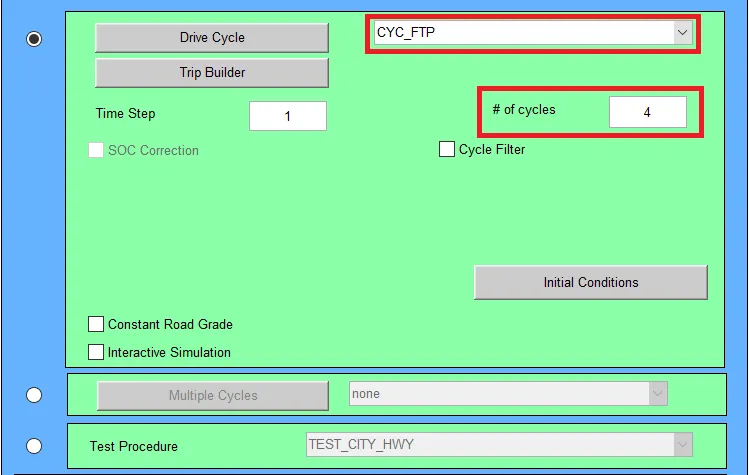
Figure06: Filling the Input parameters of selected drive cycle for selected vehicle model as shown in the first GUI of ADVISOR tool.
From the drop down menu we can select the type drive cycle we need to consider for analysis, here we selected the 'CYC_FTP' drive cycle for analysis.
According to the distance taken into consideration for analysis and total distance covered by the drive cycle we select the Number of drive cycles for analysis.
Trip builder helps us to select different types of drive cycles to create trip for the analysis if any customization is required during analysis.
We can also modify 'Time Step' for the selected drive cycle.
We can also apply the State of Charge correction if any.
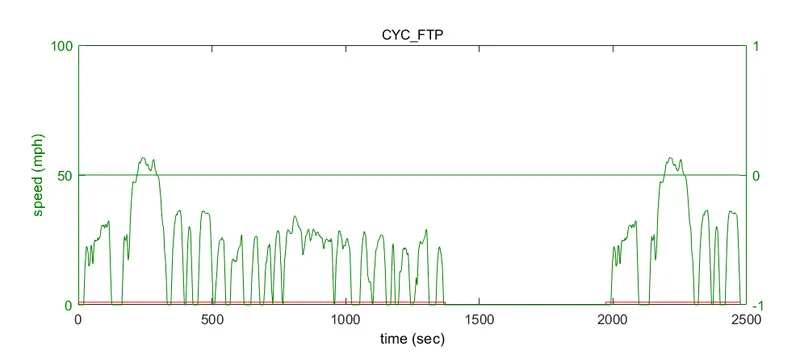
Figure07: GUI showing the Drive cycle (CYC_FTP) selected for the analysis of the specified model.
The EPA's (Environmental Protection Agency) Fedral Test Procedure (FTP) commonly known as FTP-75 for the city driving cycle, are a series of tests defined by EPA to measure tailpipe emissions and
fuel economy of passenger cars. (excluding light trucks and heavy duty vehicles)
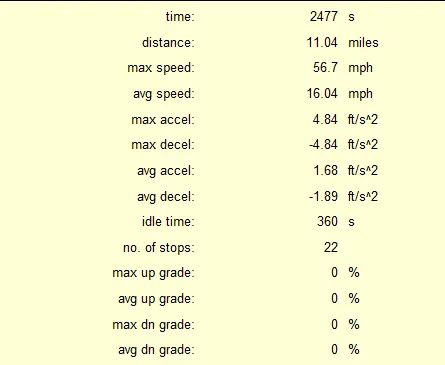
Figure08: Parameters of the selected drive cycle are shown in the above figure.
Parameters of the Specified drive cycle selected for the analysis are shown in the figure. Here the length of drive cycle is 11.04 miles (17.77 kms). And we selected total four drive cycle for the analysis so the total length of the trip for the analysis is the product of number of cycles (4) and lenght of the cycle (17.77 kms) i. e. 71.09 kms.
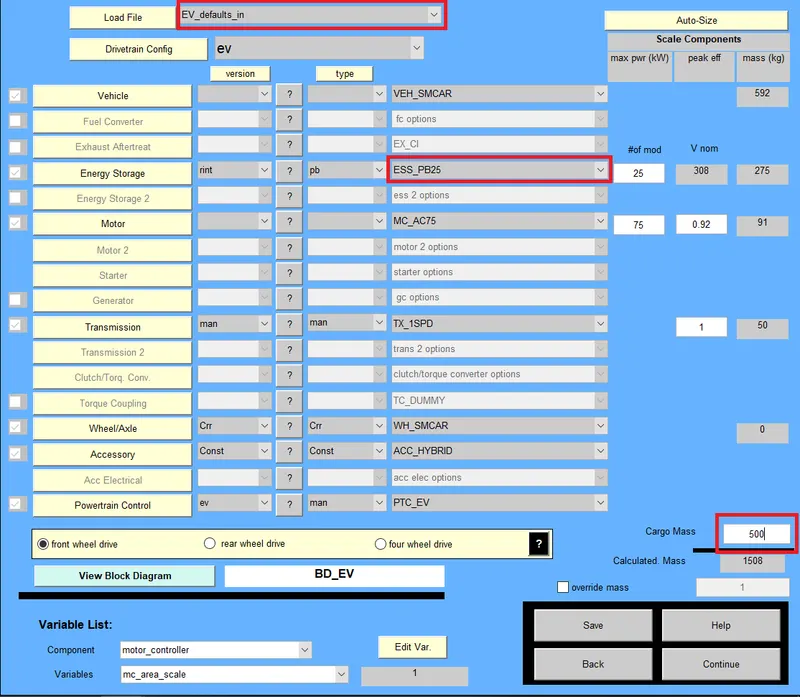
Figure09: GUI of ADVISOR tool showing the specifications of the selected components for the analysis including the vehicle model.
As shown in the figure09 we can choose the specified model of the vehicle which need to be considered for the analysis. Components, their types and specifications can also be selected by using the drop down menu of the respective components.
Following data is taken into consideration for the analysis:
Vehicle Model: EV_defaults_in
Energy Storage: ESS_PB25
Cargo Mass: 500 Kgs
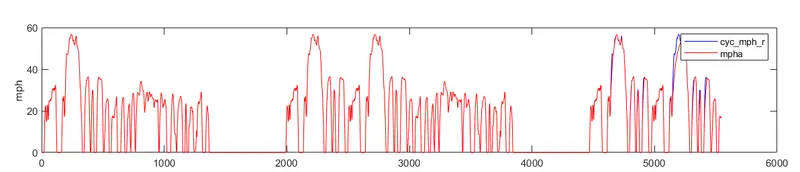
Figure10: Simulation results for the EV_defaults_in showing the drive cycle graph for the range covered by using the specified battery (ESS_PB25).
Here we can observe that results are shown only for two drive cycles that is because range of the trip exceeds the specified range of the battery. Therefore ADVISOR tool will show the results only according to the capacity of the battery or the selected components under consideration for analysis.

Figure11: Simulation results for the EV_defaults_in showing the graph of State of Charge of the battery against the time.
Figure11 shows the plot of Energy storage showing the State of Charge during the trip. Here we can observe the SOC gets to zero percentage before the trip ends that is because the range of the trip exceeds the battery range.
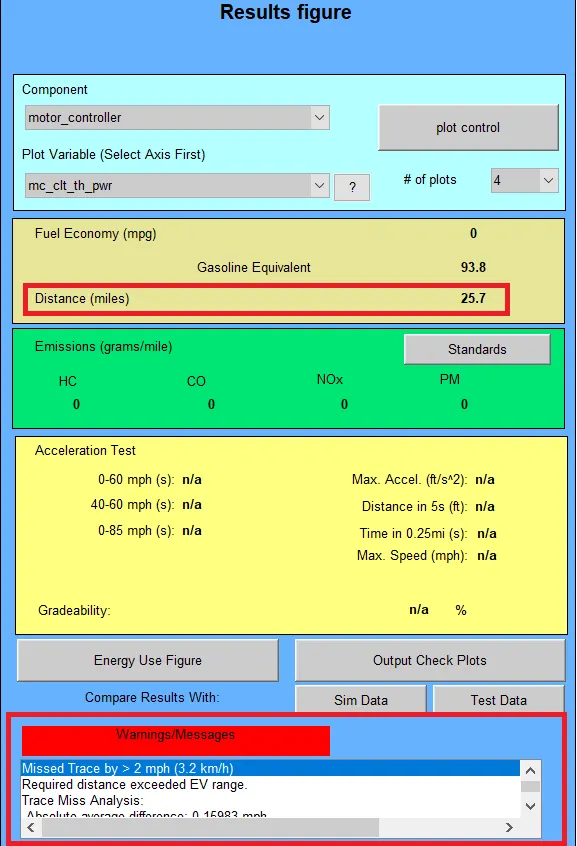
Figure12: Simulation results for the EV_defaults_in showing the controls for the simulation results.
By using the command 'Plot Control' we can modify the number of plots and can also choose the results for which we need to see the plots.
For that we have to first select the component we need to study and then we can select the results for the same to get the plot of it.
Here the distance covered by the vehicle during the trip is also shown in the figure i. e. 25.7 kms because the range of the trip exceeds the battery range.
Here as we can see the warning messages are shown for the selected specifications of the model.
Warning messages indicates the danger of failure of the model as per analysis carried out.
Ex: Required distance exceeded EV range.
To eliminates the danger of the failure we can select the componenets of the higher range to optimize the performance and get positive results.
02.
Changing the type of the Energy Storage to ESS_PB85
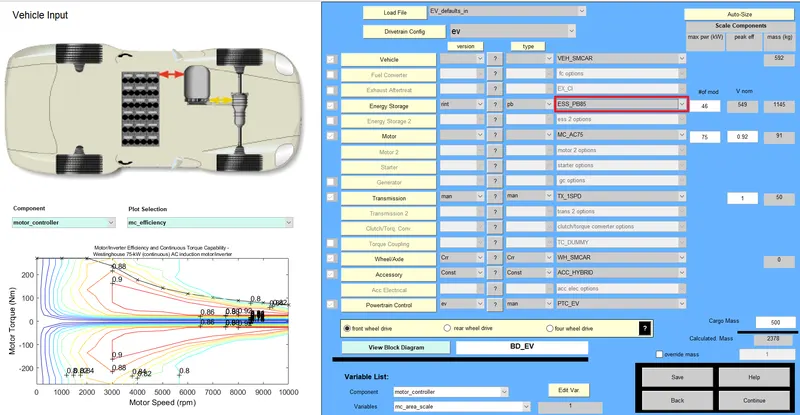
Figure13: Simulation results for the EV_defaults_in showing the specifications of the components under consideration for analysis (Energy Storage: ESS_PB85).
As we can look in the figure12 the capacity of the battery is changed to ESS_PB85 to obtain the optimum results.
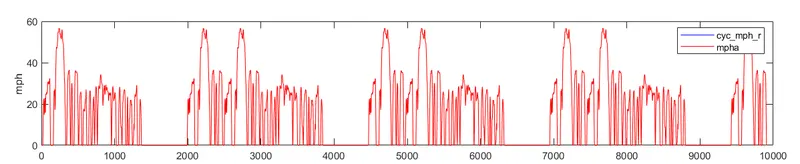
Figure14: Simulation results for the EV_defaults_in showing the drive cycle graph for the range covered by using the specified battery (ESS_PB85).
From the plot it can be concluded the vehicle model can travel the distance more than range of the trip.

Figure15: Simulation results for the EV_defaults_in showing the graph of State of Charge of the battery against the time (ESS_PB85).
So after completing the trip nearly70 percentage charge of the battery is remaining that means the range of EV is within battery range.
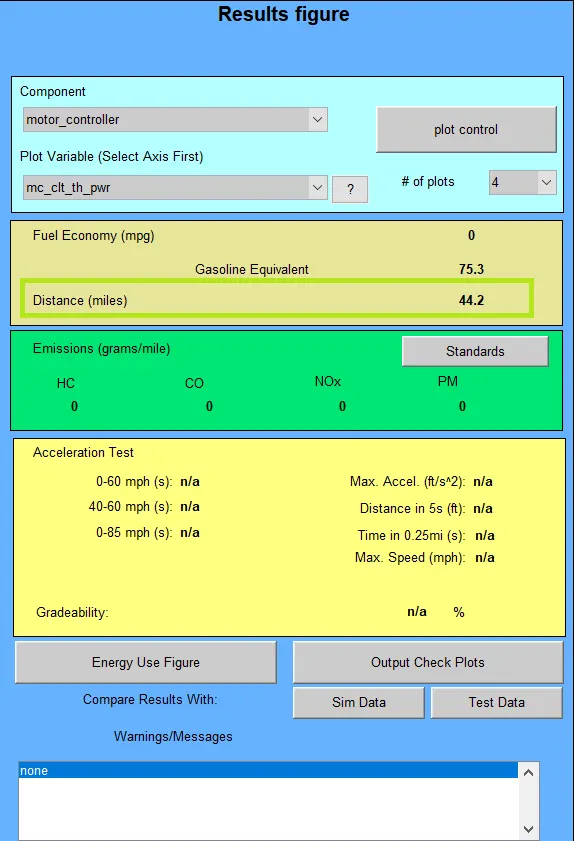
Figure16: Simulation results for the EV_defaults_in showing the controls for the simulation results (ESS_PB85).
Here as we can see there are no warning messages shown for the selected specifications of the components of the model.
That means our analysis for the selected model is successful.
03.
Perform gradeability test with PRIUS_Jpn_defaults_in file
Compare your results in table and conclude.
Figure17: Block from ADVISOR tool GUI showing 'Gradeability Test' option.
Here we confirm the Gradeability test for the analysis by choosing the 'Gradeability Test' option from the command box.
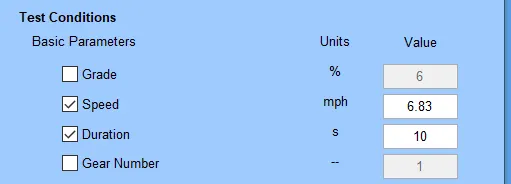
By clicking on the 'Grade Options' we will get the command box shown in the figure18 to enter the specified parameters for the Gradeability test.
Figure18: Showing advance options for 'Gradeability Test'.
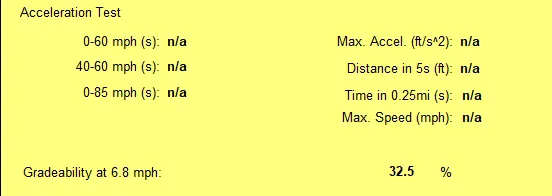
For 11 kmph:
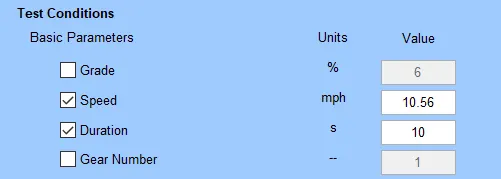
For 17 kmph:
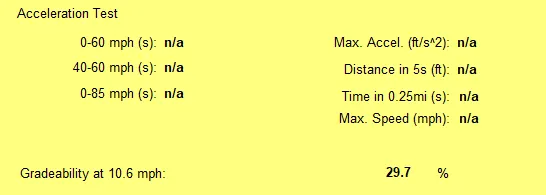
For 24 kmph:
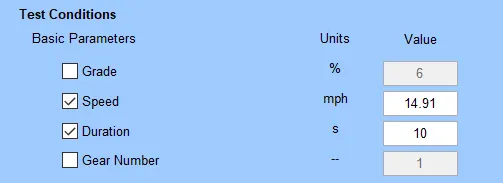
For 32 kmph:
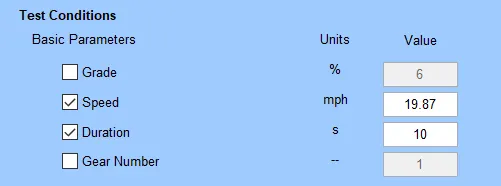
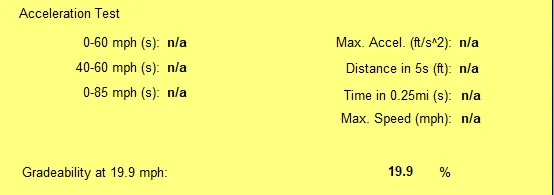
For 39 kmph:
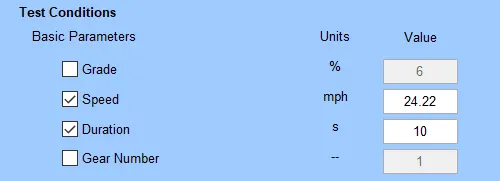
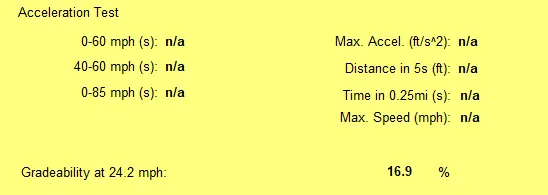
For 41 kmph:
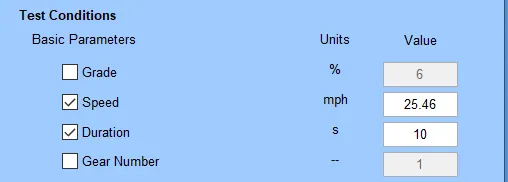
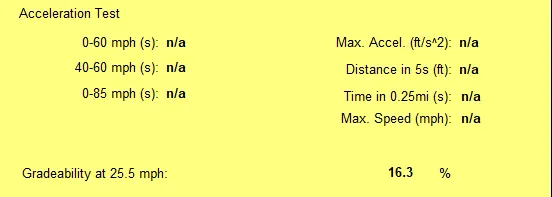
For 46 kmph:
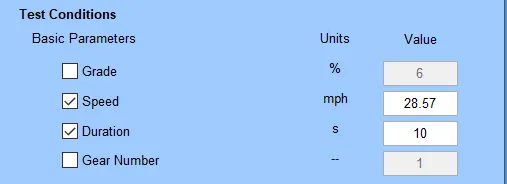
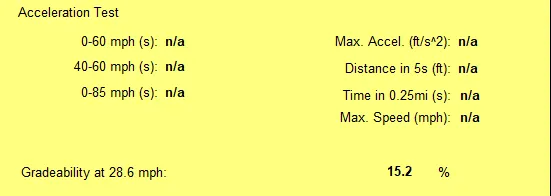
For 54 kmph:
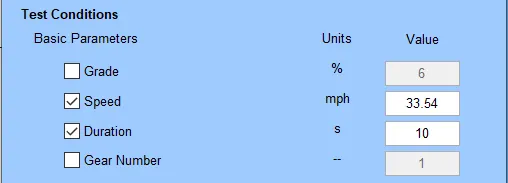
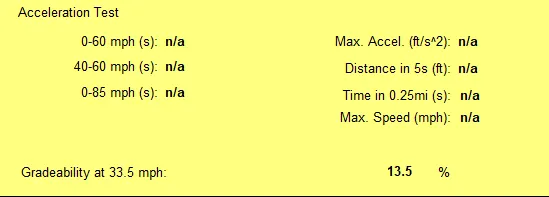
Conclusion:
From the analysis we can conclude that the range of the EV increases as the capacity of the battery increases.
Also as the speed of the vehicle increases considering all the other conditions as contsant the gradeability of the vehicle decreases that is because large amount of energy is consumed to produce the power to take vehicle at greater speed which results in the compensation of the energy required for the generation of torque, results in the lower torque and thus reduced gradeability of the vehicle.