#4 WOT Condition Part-2
Question
- What is the difference between mapped and dynamic model of engine, motor and generator? How can you change model type?
- How does the model calculate miles per gallon? Which factors are considered to model fuel flow?
- Run the HEV ReferenceApplication with WOT drive cycle. Change the grade and wind velocity in the environment block. Comment on the results.
- Keeping all other parameters same, compare the simulated results of hybrid and pure electric powertrains.
Use the "INSERT CODE SAMPLE" option to paste your code.
SUBMISSION RULES
Use the "INSERT CODE SAMPLE" option to paste your code and attach screenshots of the output. 10 points will be reduced for not doing so. Just showing the code and not explaing the results. 20 points will be reduced if this happens.
If your program or model fails to compile then you will score 0, in that particular challenge. This is applicable only for challenges where you are asked to code or submit the model files
Create a zip file with all the necessary .m files model files etc. in google drive and them as a single zip file.
Copying code from others - If you copy code from others, your score will be 0. If you copy from others on more than 1 assignments your challenges will no longer be graded. You can still access the course but your challenges will not be graded.
If you have attached links to images or videos, make sure that they work before you hit submit. At the time of grading broken links will not be taken into account.
Once graded future submissions will not be valid
Make sure you provide open links while attaching Google Sheets file
Make sure you follow the constraints given in the question, violating them will results in 0 marks.
GENERAL INSTRUCTIONS:
The codes, plots, images, GIFs, and videos should be submitted only through the answer box.
Use the Google Drive to share only the cad models or other answers which couldn't be done through the answer box.
NOTE:
Violating the above instructions will lead to ZERO marks.
Link sharing should be enabled while sharing the Google Drive link, else the challenge will be awarded ZERO marks.
Your Answers
- What is the difference between mapped and dynamic model of engine, motor and generator? How can you change model type?
|
Type |
Implementation |
When to Use |
|
|---|---|---|---|
|
Mapped |
|
Model uses a set of steady-state lookup tables to characterize engine performance. The tables provide overall engine characteristics, including actual torque, fuel flow rate, BSFC, and engine-out exhaust emissions. |
|
|
Dynamic |
|
Model decomposes the engine behavior into engine characteristics that are separated into lower-level components. By combining components in this way, the models capture the dynamic effects. |
|
We can change from mapped to dynamic or vice versa using the path passenger car-electric plant-motor. Inside the motor block we have the option as shown in figure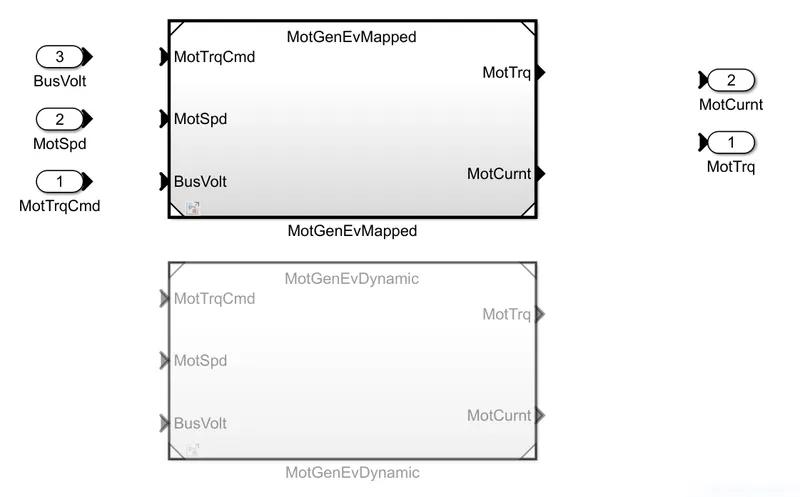
2.How does the model calculate miles per gallon? Which factors are considered to model fuel flow?
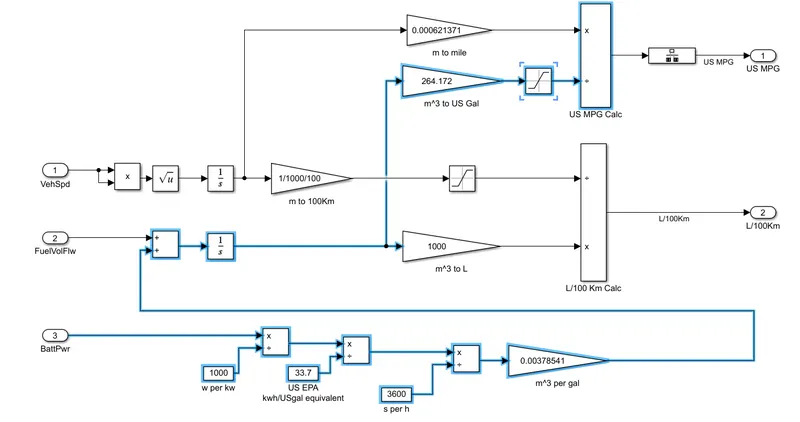
Initially Battery power in wh is converted into Kwh by dividing by 1000. then the battery power in Kwh is divided by a constant 33.7 which is obtained by 1GGE(Gasoline gallon equivalent)=33.7Kwh.
Now Kwh/gallon is divided by 3600 (1hr =3600s) which is again multiplied by a factor 0.00378541(1US Gallon=0.00378541m3).
Now the m3 per gallon is multiplied by 264.172 to get Milespergallon(MPG)
3.Run the HEV ReferenceApplication with WOT drive cycle. Change the grade and wind velocity in the environment block. Comment on the results.
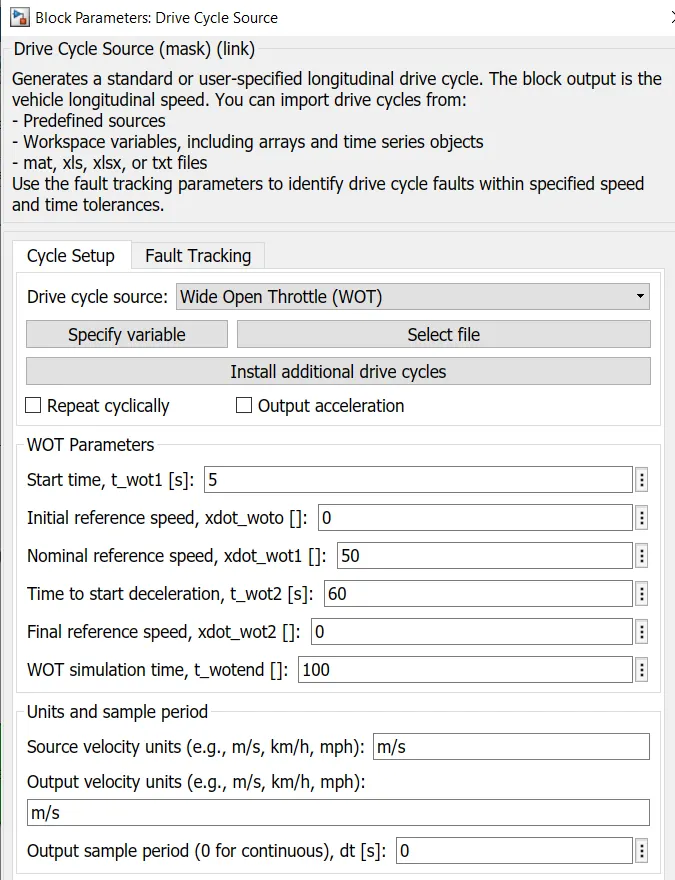
The WOT drive cycle with 50m/s speed in 60seconds is given with a total simulation time of 100s.
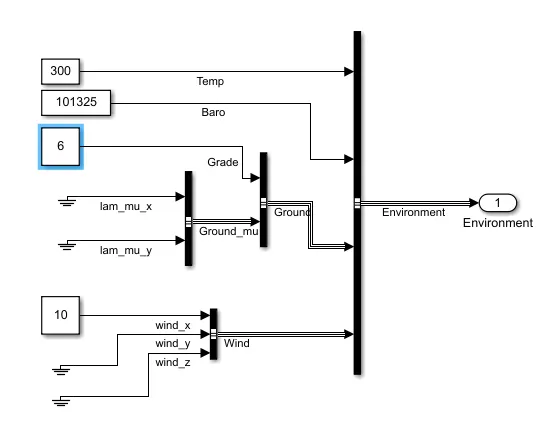
The gradeabilty of 6degree and wind velocity of 10m/s is given in environment block.
The obtained results are
The first plot shows the input drive cycle Vs the actual drive cycle. The acceleration starts at 5seconds and is increasing gradually but at 60s the top speed reached is around 80mph but our expected speed is 111mph. The system failed to reach the given WOT.
The second plot shows the battery current, Initially once the acceleration starts the battery current is around 500A till 21s because after 21s only the engine starts operating which is shown in orange line in 3rd plot. After 21s the battery discharge current is around 200A till 60s and then becomes zero because the vehicle speed becomes zero.
The battery SOC decreases rapidly at 500A discharge duration and the decreases gradually at 200A discharge region after that there is aincreases in SOC due to regenrative braking.
Fuel economy is measured in miles per gallon (or in electric vehicles, miles per gallon gasoline equivalent (MPGe)), and refers to how far a car can go using a set amount of fuel. Since this is the inverse of fuel consumption, the larger the value, the better the rating. Sometimes, the term fuel efficiency is used. From plot 4, the fuel economy is 8MPGe max.
4.Keeping all other parameters same, compare the simulated results of hybrid and pure electric powertrains.
Under same conditions, the performance of HEV and EV are compared below.
| HEV | EV | |
| Top Speed reached at 60s | 80mph | 68mph |
| Max Discharge current | 500A | 200A |
| SOC at 60s | 60% | 75% |
| Motor max speed | 9500rpm | 7000rpm |
| Fuel economy | 8MPGe | 25MPGe |