The Basics of the Powertrain NVH: Part 2
The powertrain is the most prominent source of vibrations that affects the driving experience for the people on board. Analysis of these vibrations is essential to help enhance that experience.
 Navin Baskar·16 Nov 2020·5 min read
The Basics of the Powertrain NVH: Part 2
Part 1 of this series shows how the analysis of the powertrain's NVH performance depends on being able to differentiate the source and type of vibration. After cornering the relevant parameters, the powertrain's performance is then simulated using various software available on the internet.
Analysis of Structure Borne Noise Excitations
The analysis of the noise that emerges due to various components of the powertrain shows that it has its respective path of vibration, and the response is registered at discrete locations inside the vehicle.
- Sources:
The sources include the combustion force, the gear mesh transmission error, the camshaft's torsional vibration, the dynamic imbalance of the rotating components, and the exhaust region.
- Paths:
The paths that the noise sources take are the powertrain mounts, the driveline, the exhaust hangers, and the suspension system.
- Responses:
The responses are recorded from the driver or passenger, the exhaust boom, and the vibration of the steering wheel.
The Powertrain excitations have the following frequency ranges:
- Booming ranges from 20Hz to 300Hz
- The mid-frequency level ranges from 250Hz to 1,000Hz
- The high-frequency level ranges from about 400Hz to 10,000Hz
As we reach the high-frequency range, the origin of the noise shifts from being structure-borne to airborne.
Defining the Order
The order number is defined as the number of vibrating oscillating cycles in one shaft rotation. This goes to show that the engine is considered as the primary source of noise and vibration, as the crankshaft rotation is the dominant excitation source. Hence, every automobile engine has a specific order number associated with it.
The order number is sub-categorized based on the number of imbalances occurring per cycle of the crankshaft rotation, thereby implying the following format:
Nth order vibration occurring once per revolution, where N is a natural number.
The order is directly proportional to the type of cycle the engine performs under, and in turn, the cylinder configuration.
Flowchart of the In-Depth Analysis
- The leading step to begin the in-depth analysis is to prepare an FEA (finite element analysis) model of the engine.
- After the preparation, the FEA model is then analyzed to check for the accurate frequencies and to eliminate unusual data.
- Next, the loads that the engine will be operating are predicted and generalized based on the type of simulation.
- Once the loads are optimized and finalized, the FEA vibration analysis is conducted on the model, which marks the various areas with their respective vibration intensities, and the responses are represented graphically.
- Then, the airborne analysis is conducted, and in which, the acoustic analysis is carried out if the review is necessary. The results are compared to the predetermined target.
If the results deviate from the target (if higher or lower), the entire process has to be repeated and fine-tuned until they coincide.
Software for Various Simulations with Specific Outcomes
|
Simulation |
Outcome |
Software used |
|
Powertrain FE model - build and assembly |
Engine / Transmission / Driveline FE Assembly |
Hypermesh / ANSA / Ansys |
|
Powertrain model analysis |
Powertrain bending |
Nastran / Optistruct / Ansys |
|
VTF / NTF - transfer functions |
Air borne / Structure borne vibration / Noise prediction |
Nastran / Optistruct / Ansys / Sys-noise |
|
Mount pad compliance / Mount excursions |
Structure borne vibration predictions |
Nastran / Optistruct / Ansys / Sys-noise |
|
Transmission whine / Rattle analysis |
Structure borne / Air borne analysis |
Nastran / Optistruct / Ansys / Sys-noise / Romax / Masta / Simcenter |
|
Driveline whine |
Structure borne / Air borne analysis |
Romax / Masta / Simcenter / AMEsim / SIMpack |
The given tabulation gives the idea of the ideal software to be used for the mentioned simulations to be conducted.
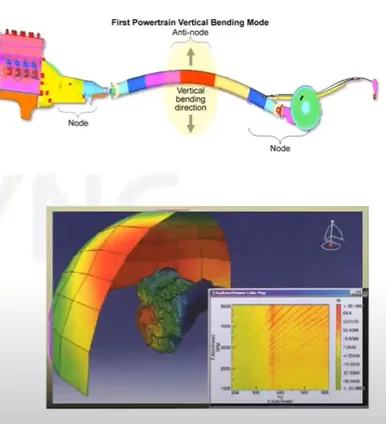
The above image is taken from various software to give an impression of how the results would appear.
Expected Results
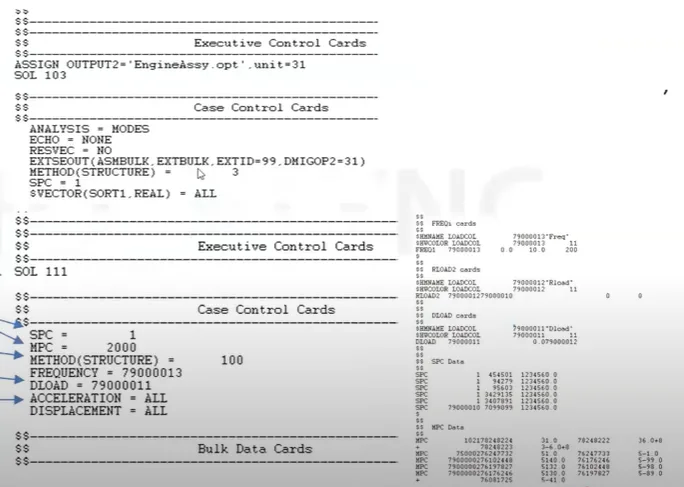
The model analysis should contain the following data:
- The boundary conditions
- The method or algorithm of the simulation
The response analysis should ascertain the following:
- The solution sequence
- The boundary conditions
- The methodology
- The input load
- The result or output
- The elaboration of damping
Case Study - A Simple Transformer
Since the analysis of automobile powertrains is an arduous task, the subject of investigation now is a simple transformer.
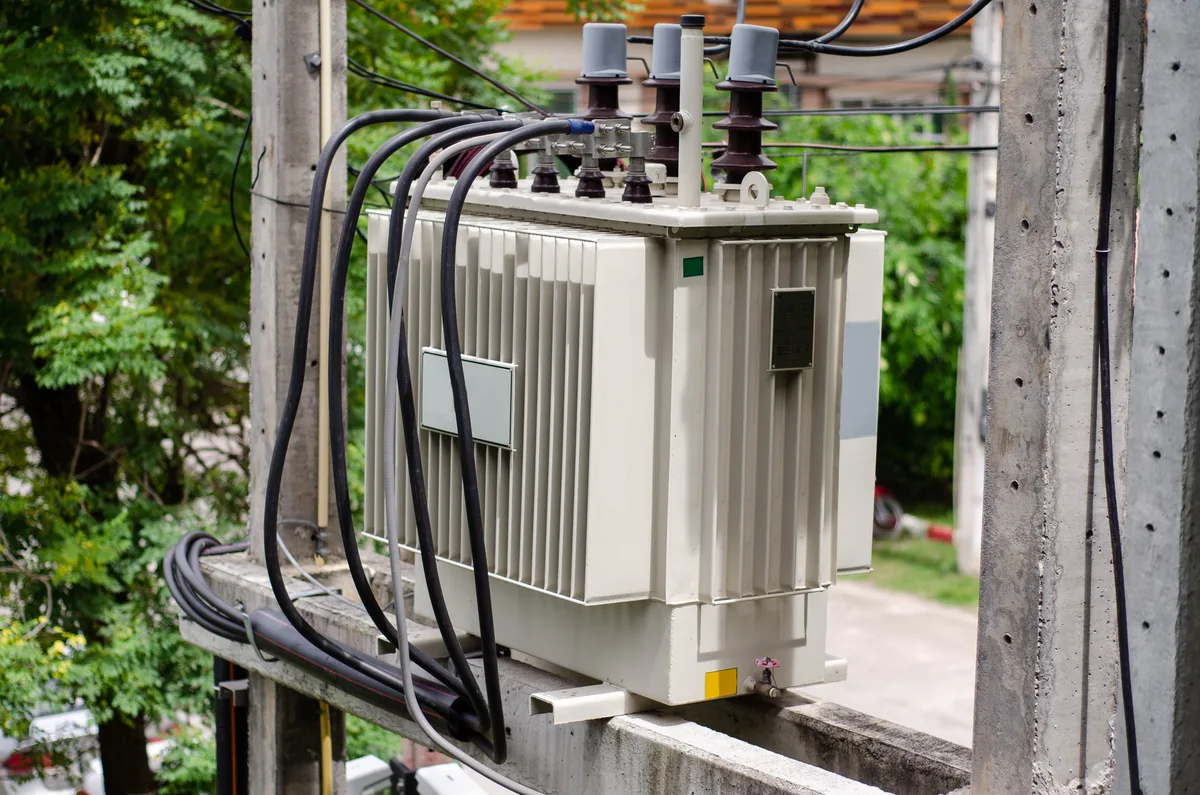
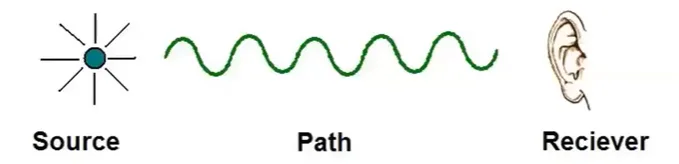
The noise will follow the illustrated way of transmission as the source is the transformer, the path being air and the poles of the affixed transformer, and the receiver being the human ear.
Source Analysis
The primary source of the acoustic noise generation in a transformer is the periodic mechanical deformation of the transformer core, influenced by fluctuating electromagnetic flux associated with these parts.
The physical phenomenon in the transformer is caused due to the following:
- The vibration of the core due to the electromagnetic forces
- The residual gaps between the core lamination that force them to strike against each other
Hence, the primary source of the vibrations is the Alternating Electromagnetic Field.
It can be further classified into:
- Electromagnetic forces
- Electromechanical forces
The vibration of the core is a result of the magnetostriction and relative transverse motion of the core lamination. This can again be sub-classified into airborne and structure-borne vibrations.
- Airborne Vibrations:
The acoustic waves are due to the fluid that is contained in the transformer tank, which is caused by the vibration of the winding coils.
- Structure-Borne Vibrations:
Structure-borne vibrations are the vibrations of the transformer mounting, which is caused by the coil winding.
Both airborne and structure-borne vibrations induce vibration in the tank, which finally causes the radiation of the noise (or tonal radiation).
Electromagnetic and electromechanical forces have an equal contribution when it comes to the core vibration. The electromechanical vibrations furthermore cause vibrations in the coil winding.
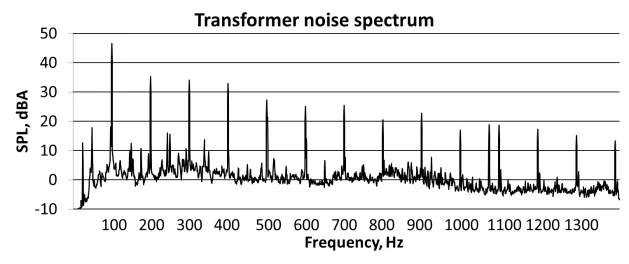
As the graph points out, as the load increases, the intensity of the noise first increases, then gradually decreases.
Steps to Reduce the Noise Intensity
The transformer can be further laminated to reduce noise levels or set up in a box configuration. This step may change an efficiently radiating vibration shape into an inefficiently radiating shape, resulting in a lower sound radiation ratio.
Another method to reduce the noise level can be Active Noise Control (ANC).
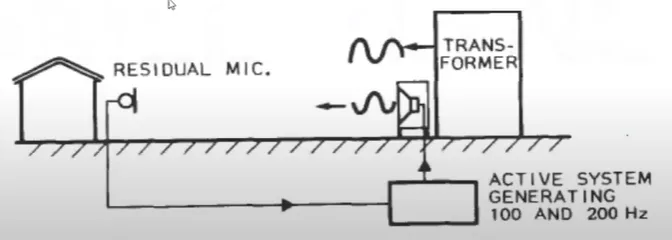
The ANC records the noise characteristics emitted from the transformer, sends the data to the active system, and then produces an opposite wave that cancels the noise wave, resulting in a noise-free environment.
Career Opportunities in This Domain
The ability to perform powertrain NVH analysis can be advantageous in countless domains that use machinery. It is so because all heavy machinery that operates undergoes some sort of vibrations that need to be kept in check.
Conclusion
The basics of NVH and powertrain, along with associated terminologies, have been discussed. The analysis has proved to be essential in developing an engine with appropriate performance requirements. The case study entails an extensive discussion on the concept of vibration and methodologies to reduce the same.
To learn more about powertrains and other exciting topics, kindly click here.