Wine Dataset - Statistical Analysis
Project 2
Using the existing datasets of red wine and white wine data, we can understand the relationships between the features and determine the quality rating of the wine based on these features.
1. Displaying the data of white wine and red wine
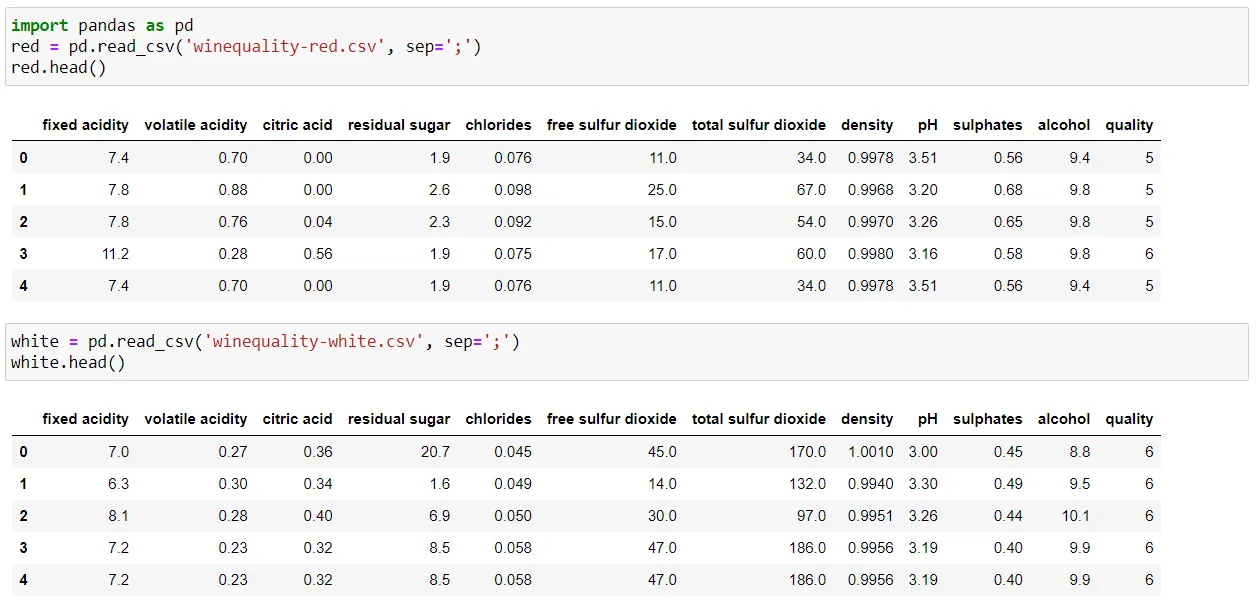
2. Size of both white wine and red wine datasets

3. The number of null in both type of wines
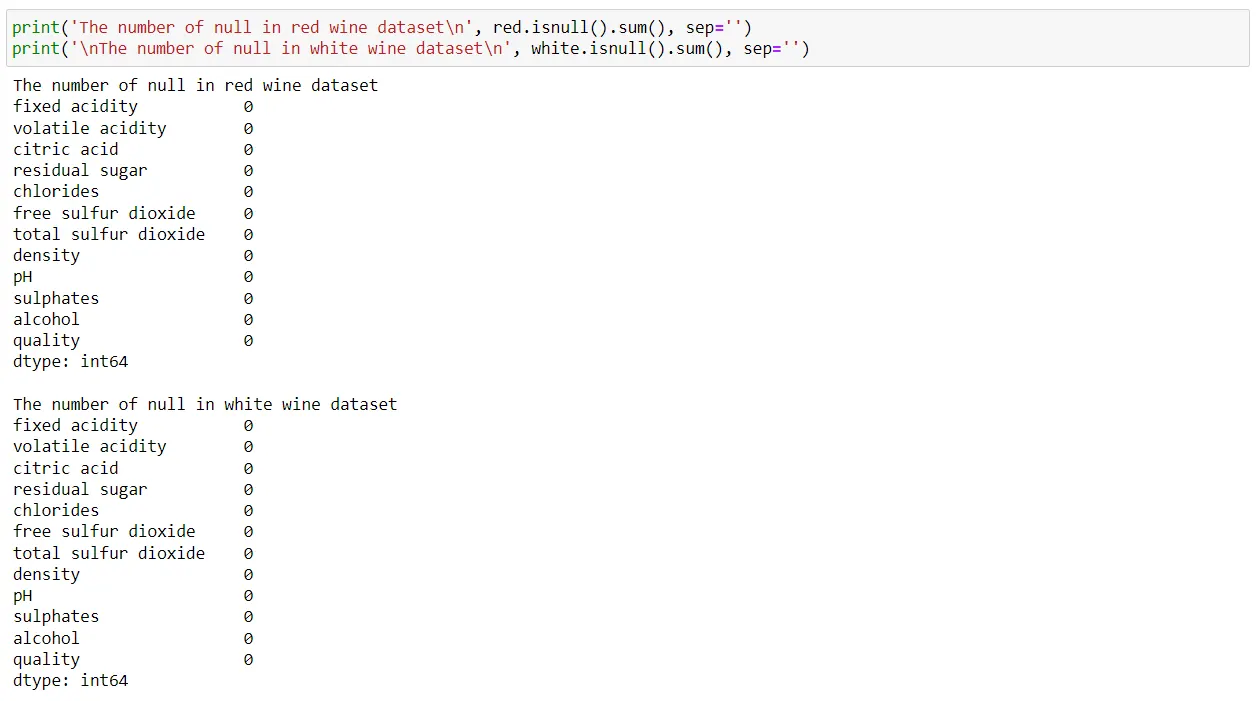
There are no null values in both the datasets
4. Checking for duplicates and removing them in both type of wine data

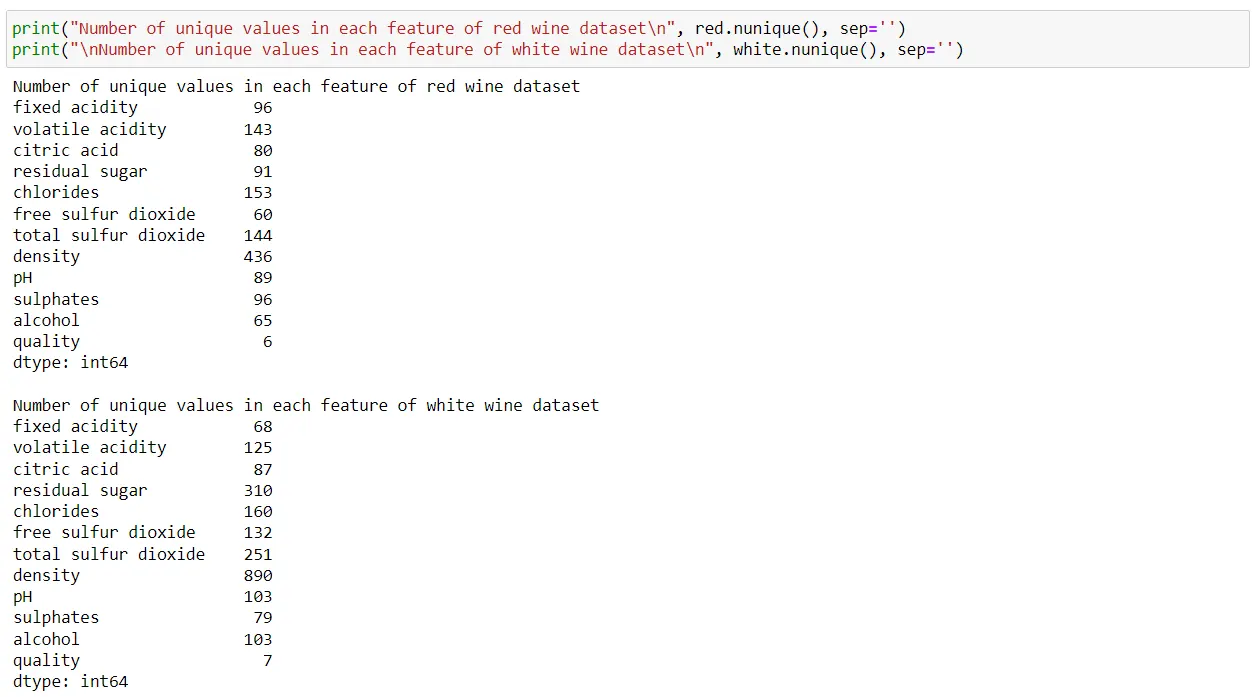
5. The number of unique values in all feature
6. The mean density of both the datasets

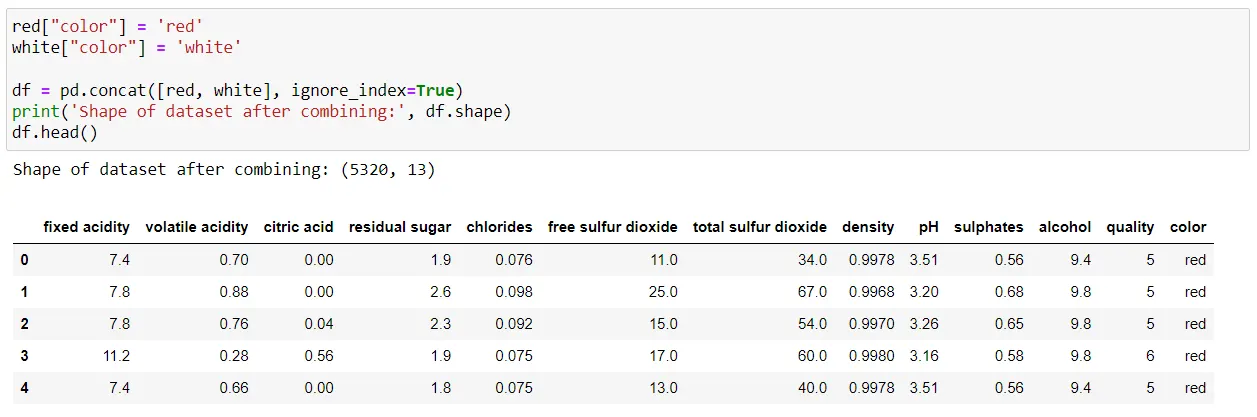
7. Combining both the datasets with color of the wine
8. Checking for null values
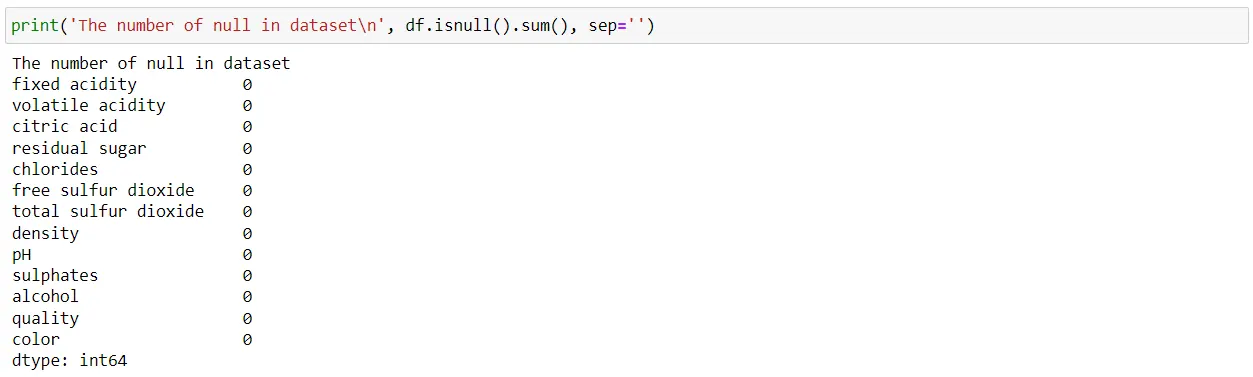
There are no null values in the dataset
9. Checking and removing the outliers
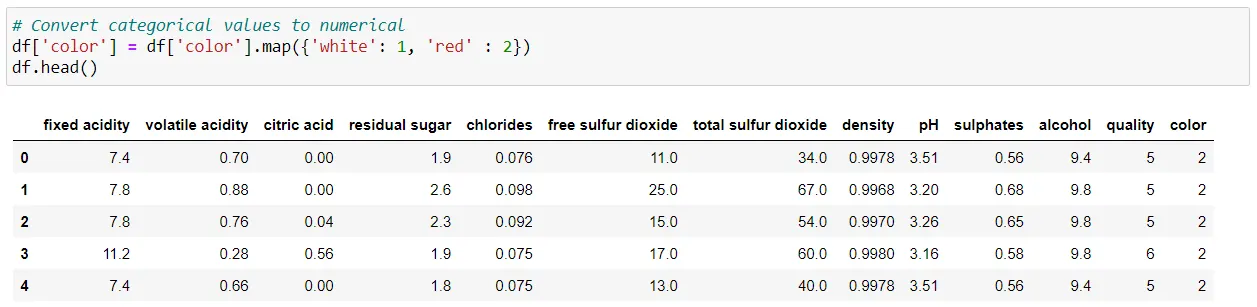
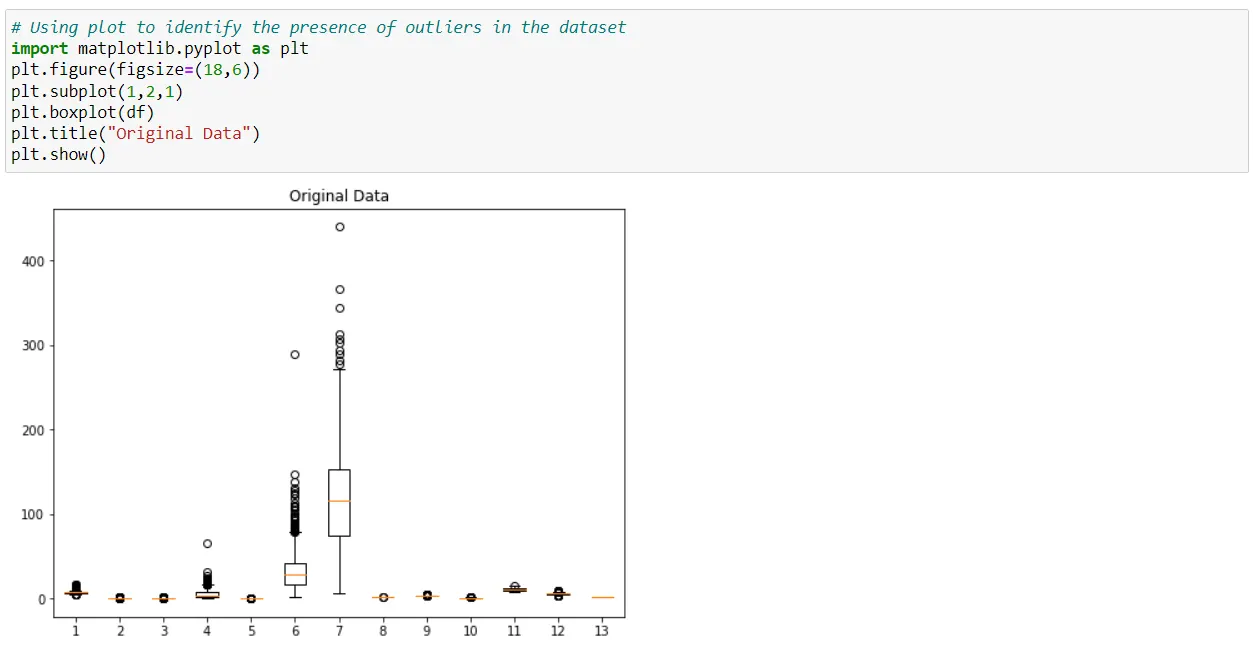
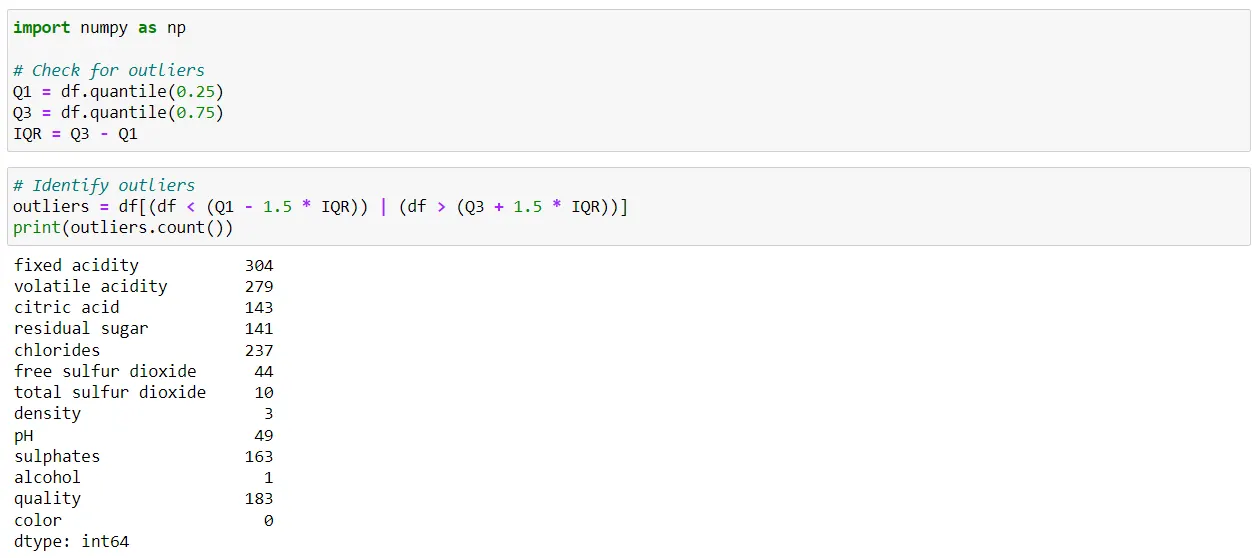
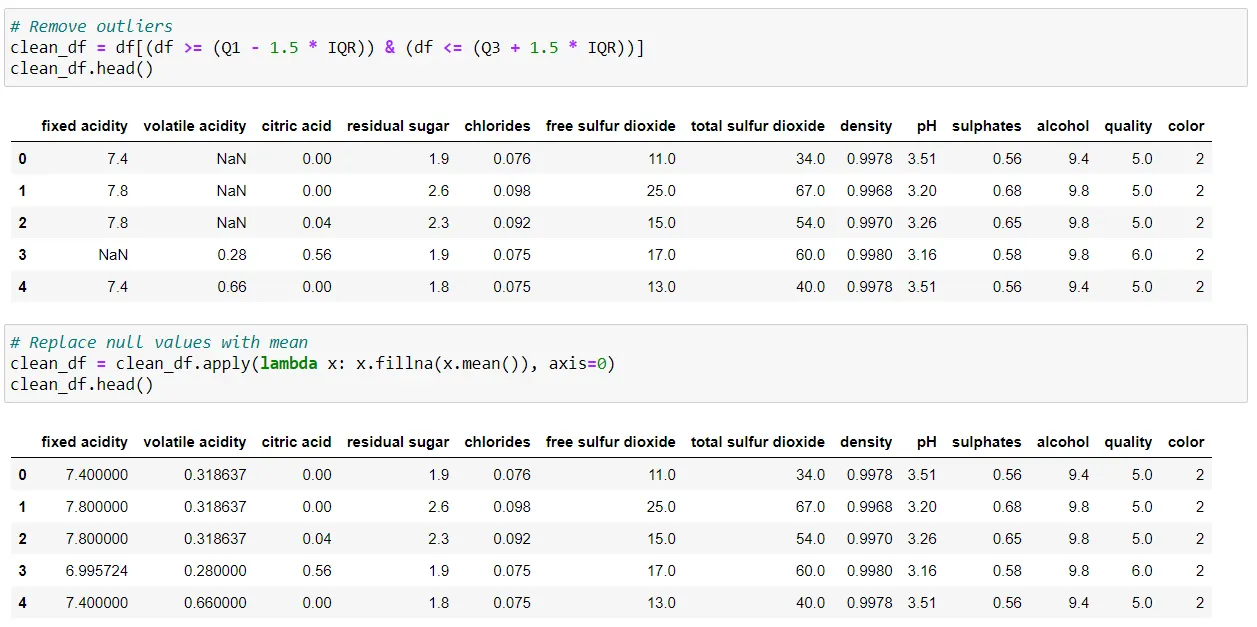
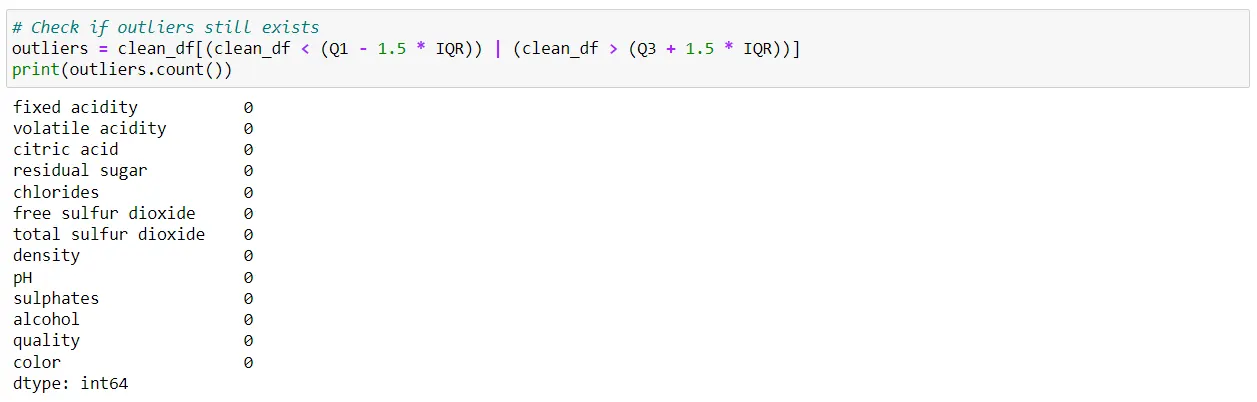
Outliers have been removed and null values were replaced with mean values in each column
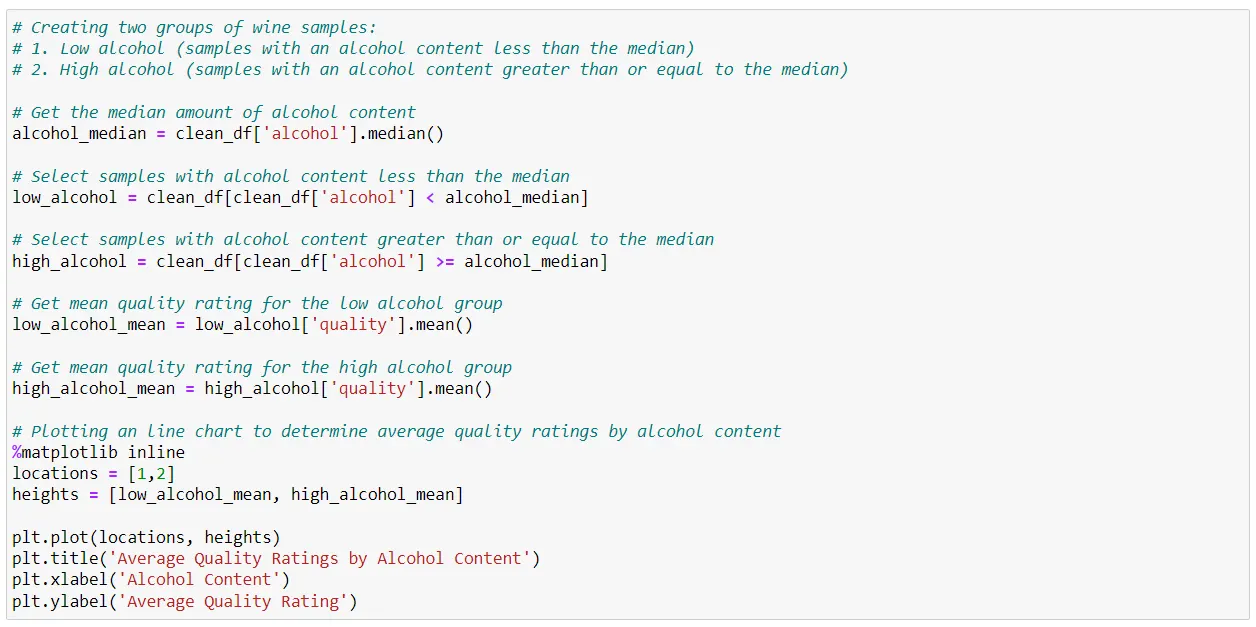
10. Comparing quality ratings based on alcohol content
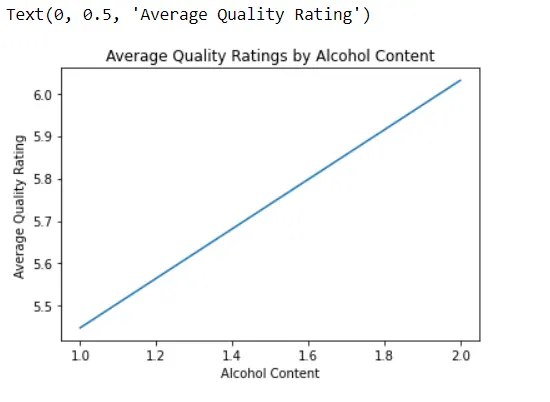
Interpretation:
With the line chart above, we can see the relationship between alcohol content and quality.
We can determine that higher the alcohol content, the higher the quality rating.
11. Correlation between citric acid content and PH

Interpretation:
The correlation coefficient is negative, this indicates that as 'citric acid' increases, 'pH' tends to decrease.
12. Regression of PH on citric acid
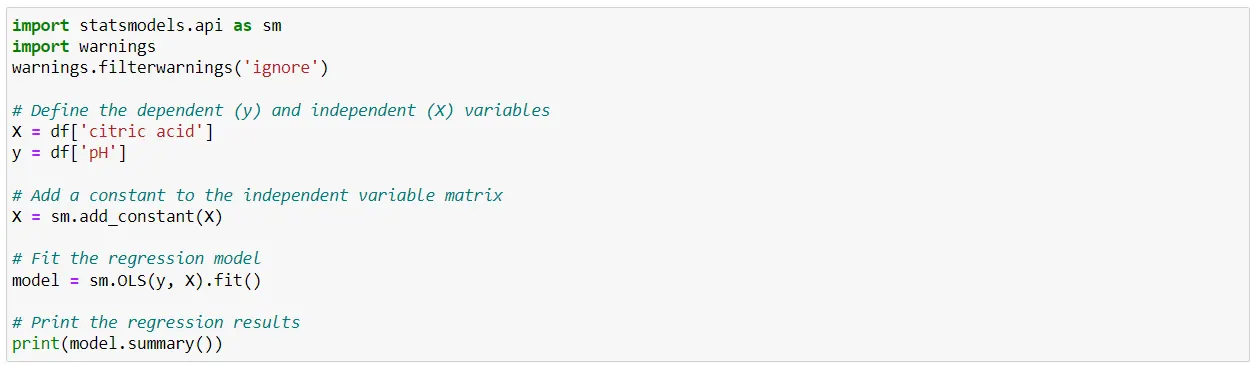
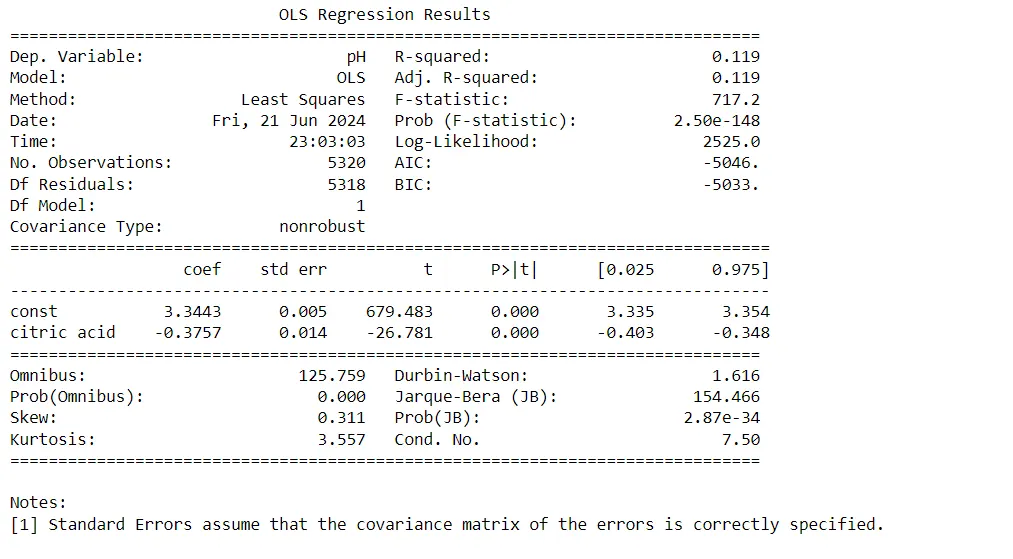
Interpretation:
There is statistically negative relationship between 'citric acid' and 'pH'. Specifically, for every unit increase in citric acid, pH decreases by 0.375 units.
The model explains only 11% of the variance in pH can be explained by citric acid content.
13. Checking the independence of values

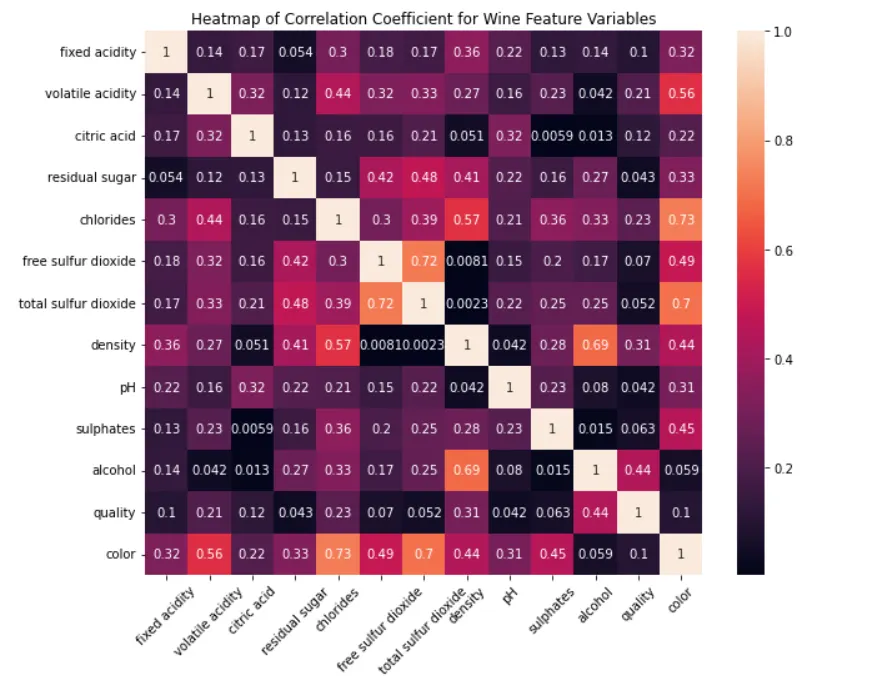
14. Creating a column for acidity levels
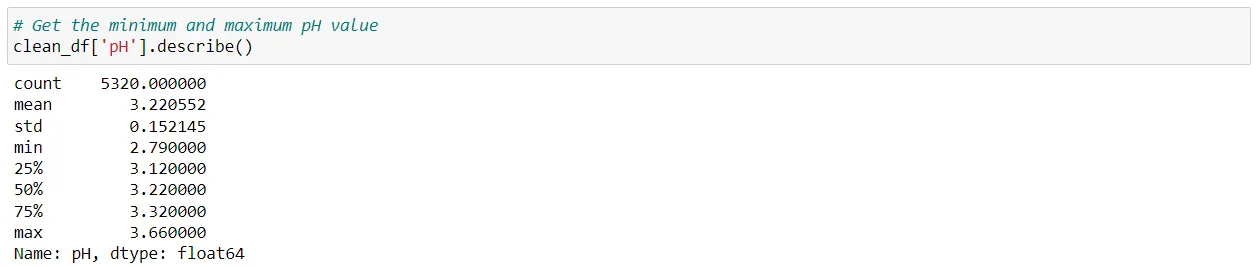
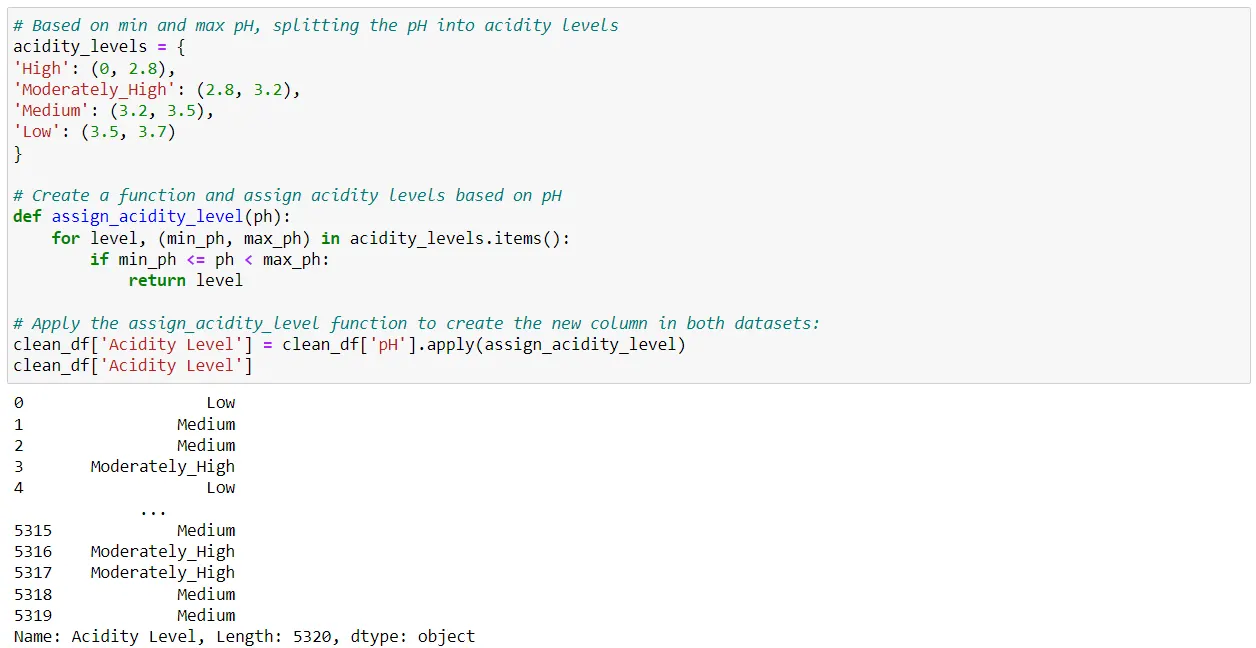
15. Mean quality of each acidity level

16. Association of wine color with quality ratings

Interpretation:
The average quality rating of white wine and red wine is almost the same.
This means the color of wine does not determine the quality of wine.
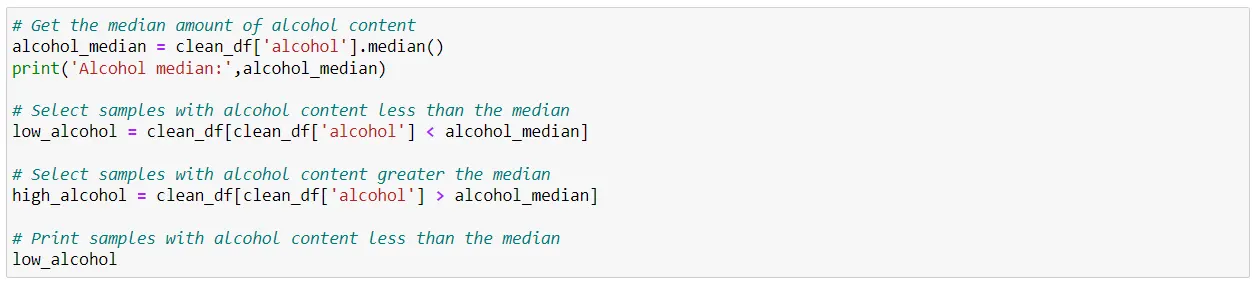
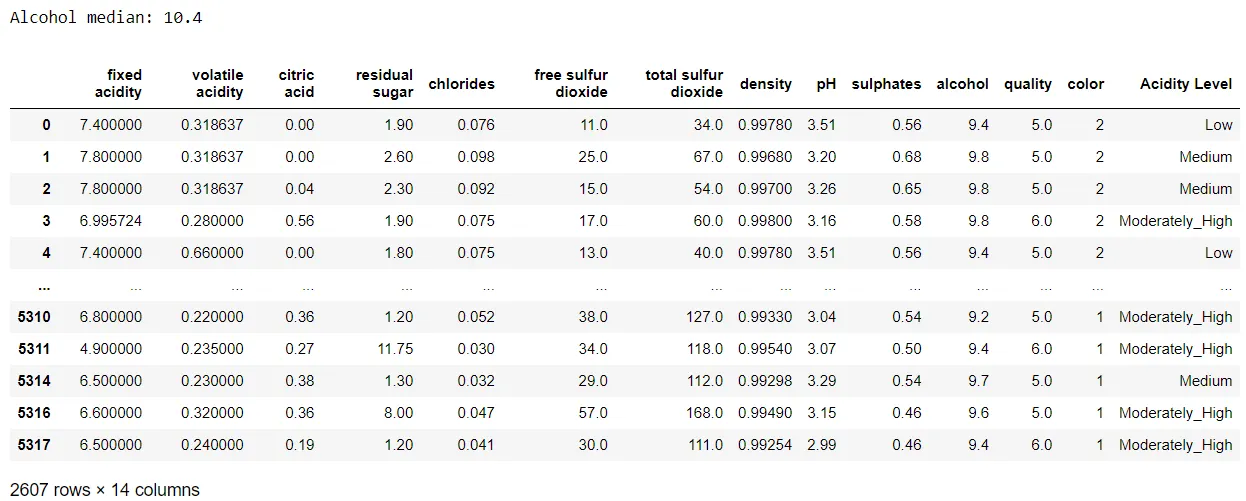
17. Samples with alcohol content less than the median
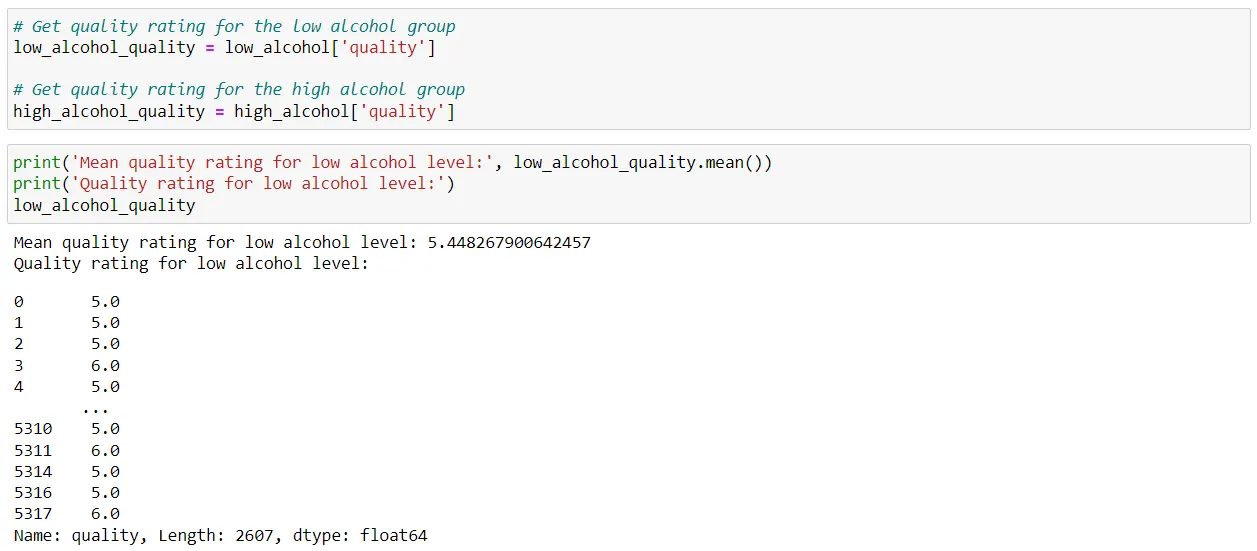
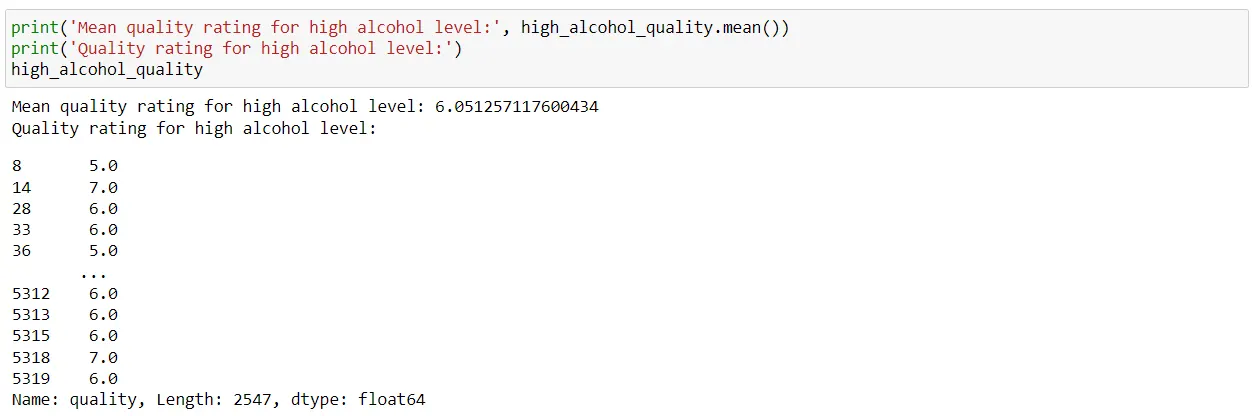
18. The quality rating for the low alcohol and high alcohol content
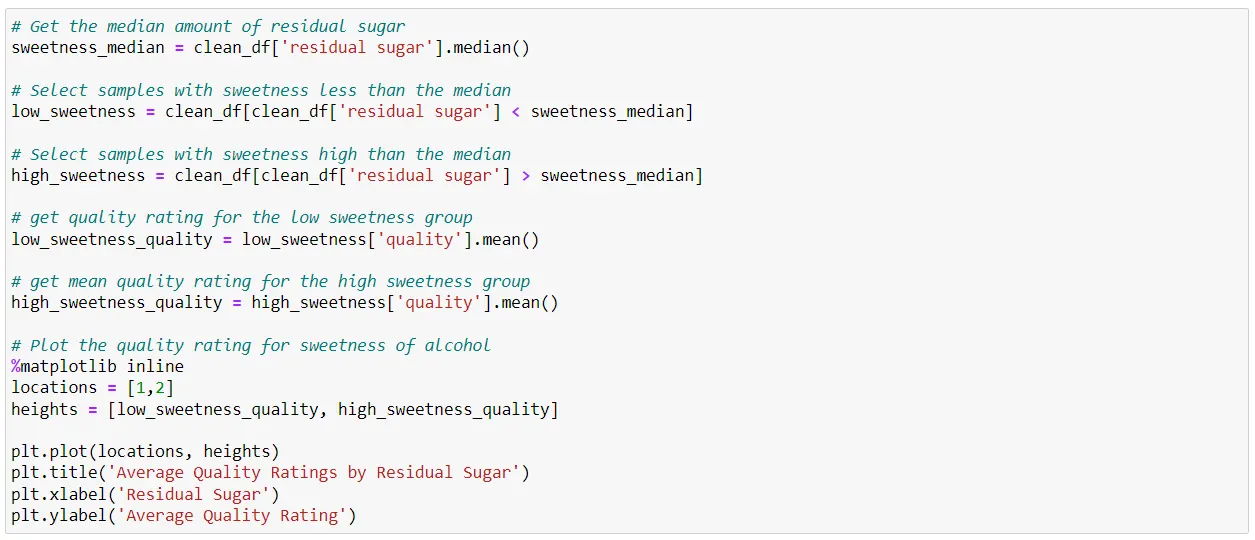
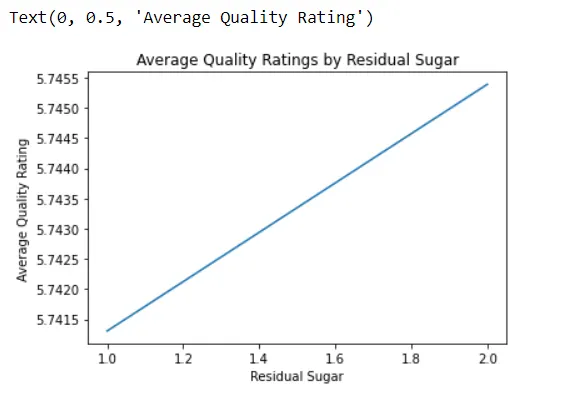
19. Comparing quality ratings based on sweetness of alcohol
Interpretation:
With the line chart above, we can see the relationship between alcohol sweetness and quality.
We can determine that higher the sweetness in alcohol, the higher the quality rating.
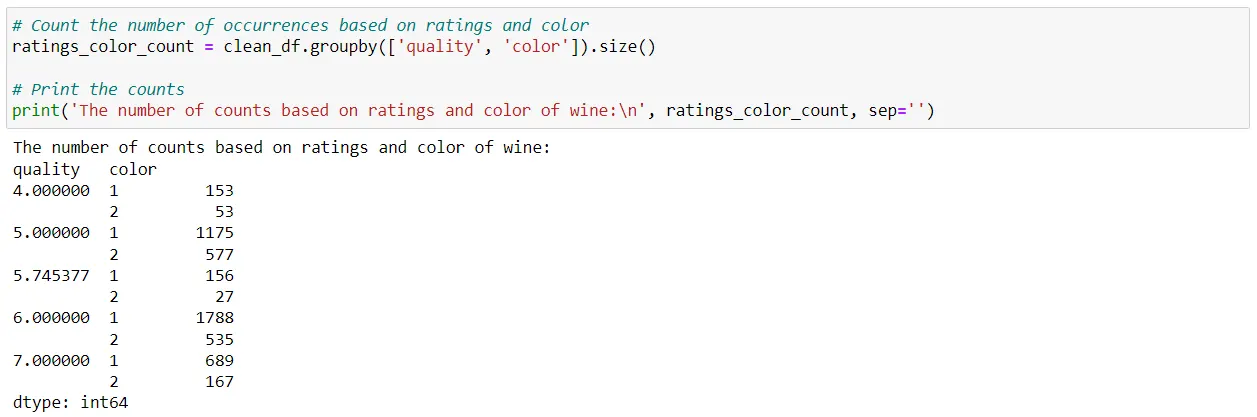
20. The number of counts based on ratings and color of wine
21. Comparing density of red wine and white wine

Interpretation:
From the above counts we can determine that the density of red wine and white wine are almost similar with red wine being a little denser (0.003 units) than white wine.
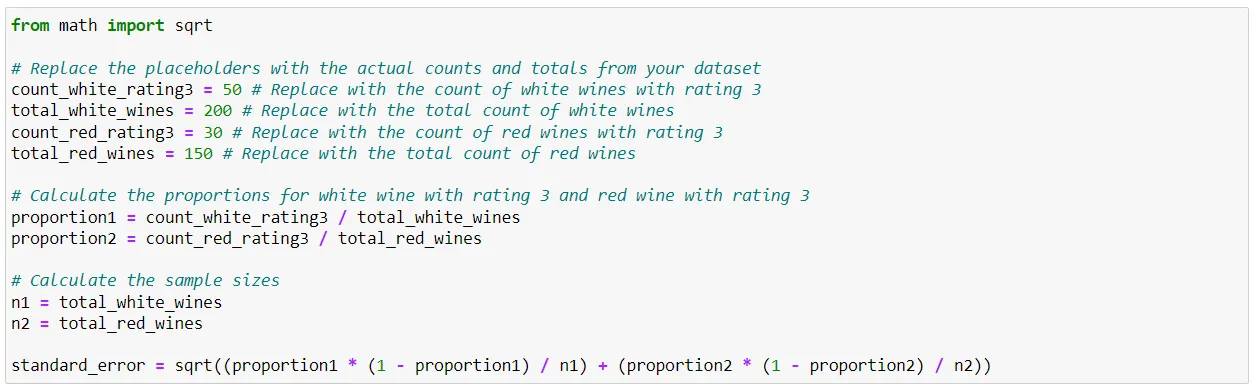
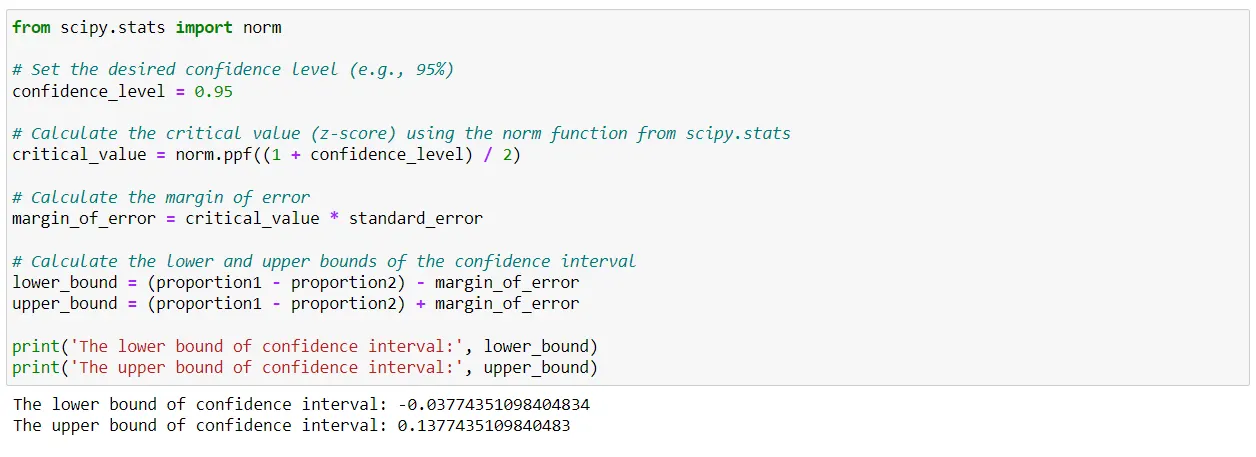
22. Confidence interval for the differences of the proportion of white wine with rating 3 and the proportion of red wine with rating
Interpretation:
The confidence interval for the difference of the proportion of white wine with rating 3 and the proportion of red wine with rating 3 is -0.0377 to 0.1377.