Basics of Probability and Statistics
Basics of Probability and Statistics
1. Sample Variance vs Population Variance
The formula to calculate population variance is:
`sigma ^2 = (sum (x_i - mu_x ) ^2)/N`
The formula to calculate sample variance is:
`s^2 = (sum (x_i - mu_x ) ^2)/(N-1)`
The difference between the two formulas is:
- When we calculate population variance, we divide by N and when we calculate sample variance, we divide by N-1
- The purpose of this little difference is to get a better and unbiased estimate of the population's variance.
- By using N-1, we compensate the fact that we are working only with a sample rather than the whole population.
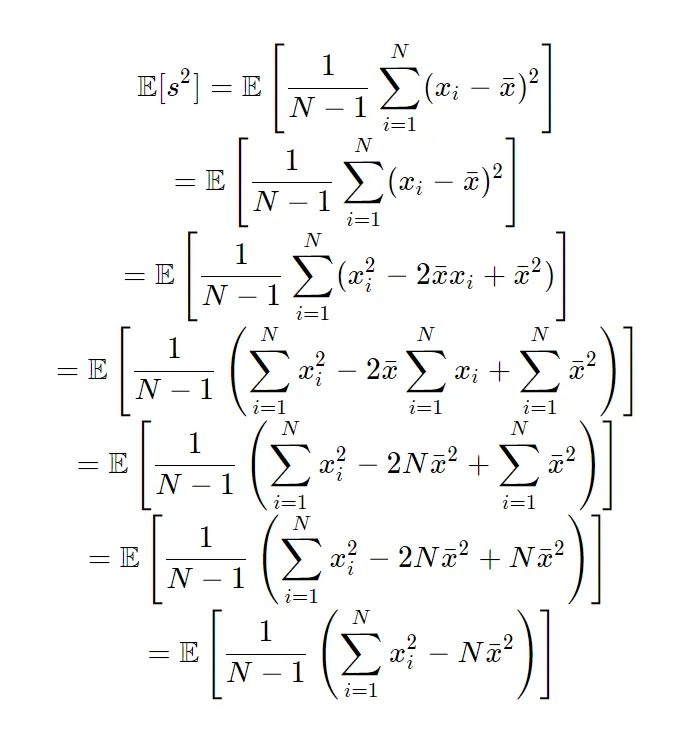
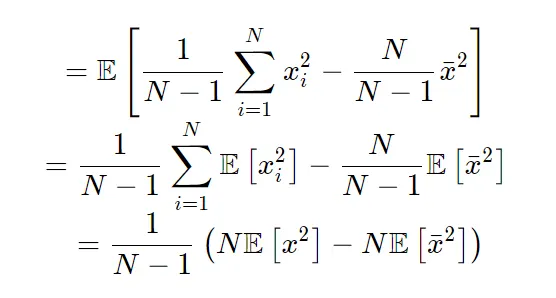
- This can be proved by the equation below:
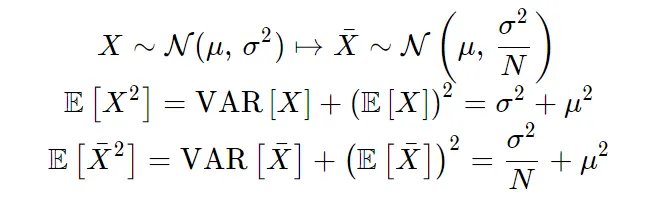
Now remembering that,
We have,
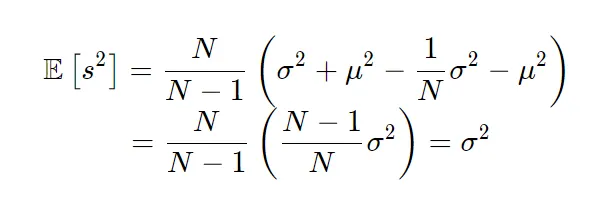
From this we understand that, using the formula with N-1 gives us a sample variance, which on average, is equal to the unknown population variance. Whereas, using only N rather than N-1 gives a biased variance. Thus N-1 gives an unbiased variance.
2. Difference between Stratified and Clustered Sampling
- The stratified sampling method is a sampling method wherein a population is divided into several strata, and a sample is taken from each stratum. Cluster sampling is a sampling method wherein the population is divided into clusters that already exist in a certain area, and a sample is taken from each cluster.
- Stratified sampling is very efficient and aims at providing precise statistical data while cluster sampling aims at increasing the efficiency of sampling.
- Stratified sampling takes a longer period of time to accomplish while cluster sampling is time efficient
- Stratified sampling requires a larger number of samples since the population is divided into several strata while cluster sampling does not.
- Cluster sampling is very cost efficient since samples are already specified while stratified sampling can be expensive.
- Stratified sampling allows researchers to use different approaches for each stratum and see which approach works best while cluster sampling does not.
3. Number of different samples created out of population of size n:
The formula of random sampling is, if that sample gets selected only once,
`P = 1 – ((N-1)/N)((N-2)/(N-1))....((N-n)/(N-(n-1)))`
Here,
P is the probability
n is the sample size
N represents the population
Now if we cancel 1-(N-n/n),
Then, P = n/N
Hence, the number of different samples created out of population of size is P = n/N
4. The probability of drawing 2 jacks from a pack of cards
Total number of cards in a pack = 52
Total number of jacks in a pack = 4
The probability of drawing a jack = 4/52
The probability that both are jack = (4/52).(3/51)
= (1/13).(1/17)
= 1/221
5. The probability that both the numbers on dice are same while rolling two dice is:
When two dice are rolled together then the total outcomes are 36.
The sample space is:
[(1,1) (1,2) (1,3) (1,4) (1,5) (1,6)
(2,1) (2,2) (2,3) (2,4) (2,5) (2,6)
(3,1) (3,2) (3,3) (3,4) (3,5) (3,6)
(4,1) (4,2) (4,3) (4,4) (4,5) (4,6)
(5,1) (5,2) (5,3) (5,4) (5,5) (5,6)
(6,1) (6,2) (6,3) (6,4) (6,5) (6,6)]
From the sample space, the pairs with same numbers are:
(1,1) (2,2) (3,3) (4,4) (5,5) (6,6)
Total number of pairs is 6
Hence,
Total outcomes = 36
Favourable outcomes = 6
Probability = 6/36 = 1/6
Therefore, the probability that both the numbers on dice are same while rolling two dice is 1/6.
6. Standard Deviation vs Variance
- The best measurement for dispersion is standard deviation
- Standard Deviation helps to make comparison between variability of two or more sets of data, testing the significance of random samples and in regression and correlation analysis.
- It is based on the values of all the observations which makes use of every item in a particular distribution.
- It is widely used measure of dispersion as all data distribution is nearer to the normal distribution.
- It enables algebraic treatment. It has corrected mathematical processes in comparison to range, quartile deviation and mean deviation.
- Whereas, The variance of an asset may not be reliable. Calculating variance can be lengthy and time-consuming, especially when there are many data points involved.
- Moreover, variance is often hard to use in a practical sense not only it is a squared value, there are individual data points involved, hence it makes calculations complicated.