Week 9 Tension and Torsion test challenge
Tension and Torsion Test Assignment –
Objective –
The objective of this assignment is to perform tension and torsion test on a solid steel bar specimen using explicit dynamic simulation in ANSYS
The analysis is performed on 2 different structural actions – tension and torsion and behaviour of each is studied for the same steel specimen with the similar analysis settings
Simulation for Tension Test – the specimen displaced by 18mm
Model and Analysis Set up
- Model Geometry
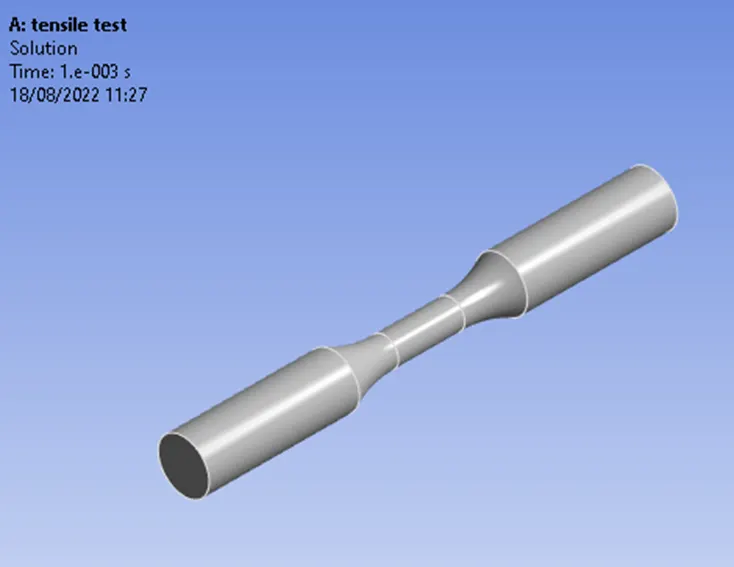
The model is created in a CAD software and imported in ANSYS, initially checked in Space claim
See below model snapshot.
- Materials
Explicit materials are used in this analysis, materials to be Explicit Steel 1006 for the specimen bar
- Meshing
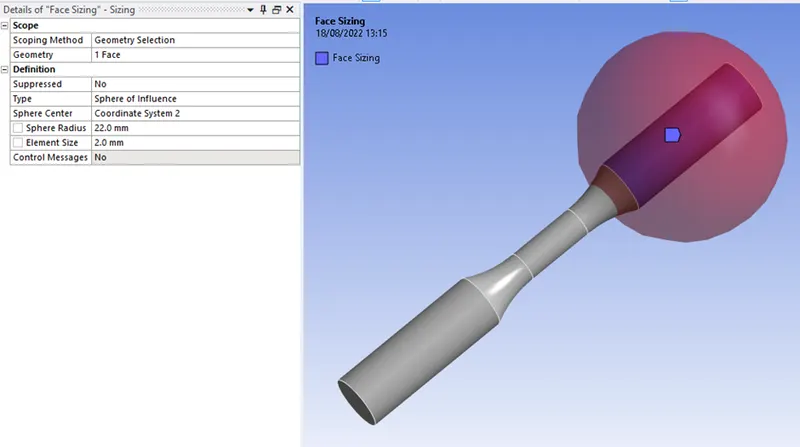
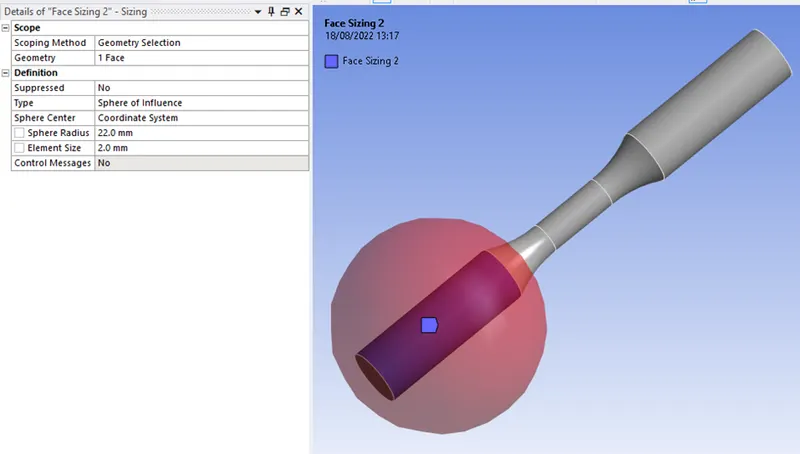
The model is meshed as shown below with the following parameters
Method – Tetrahedrons
End Faces – Sphere of Influence – Radius = 22mm and Element Size = 2mm
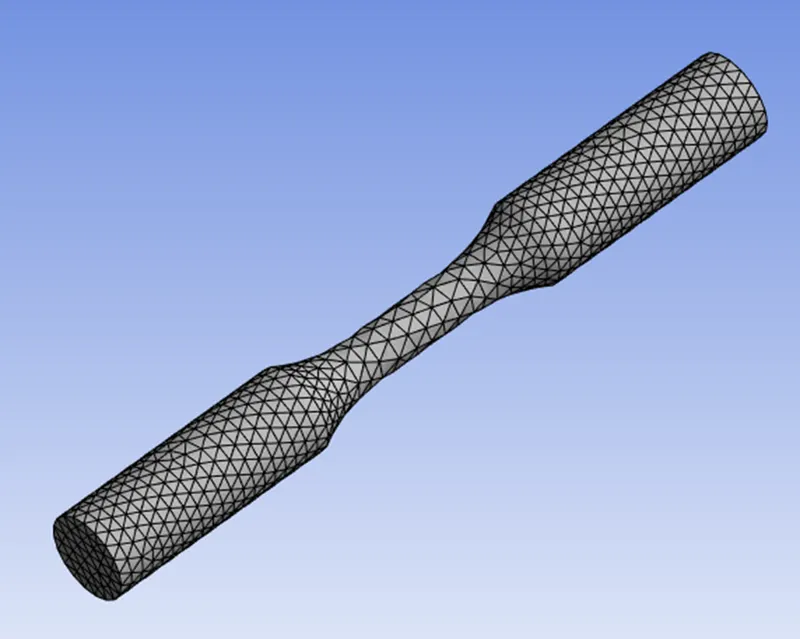
Final meshed model as below
- Analysis Settings
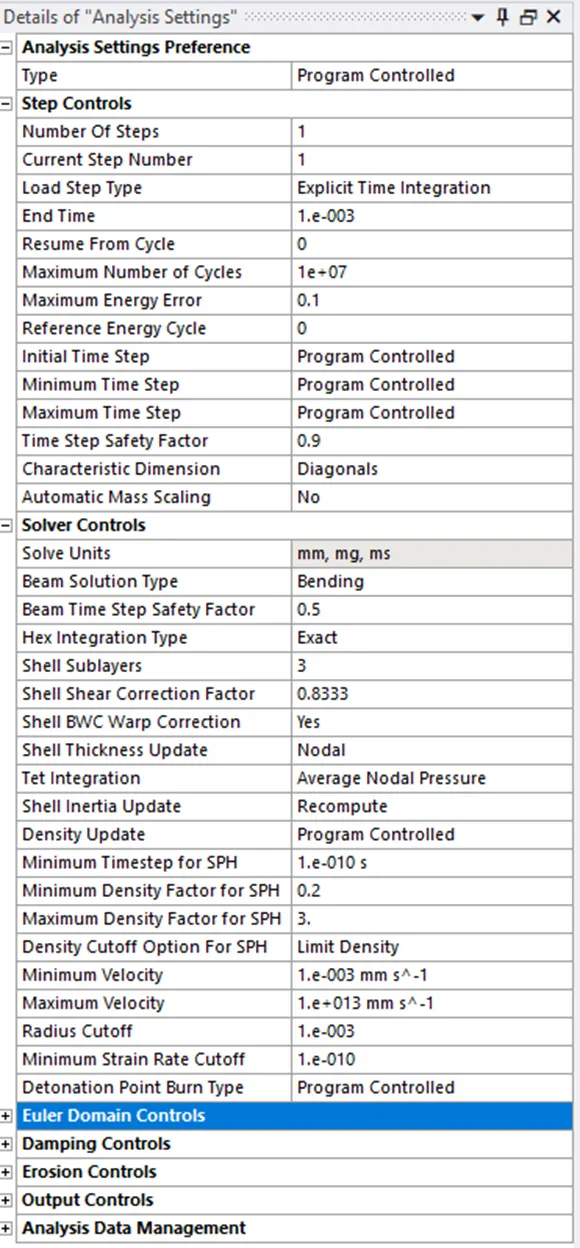
Since it’s an explicit dynamics analysis, it is performed on a very short end time step = 1e-3
The other time steps are kept as program controlled as we do not know the sound wave propagation over the each elements.
Rest of the setting are kept as default.
- Loads and Supports
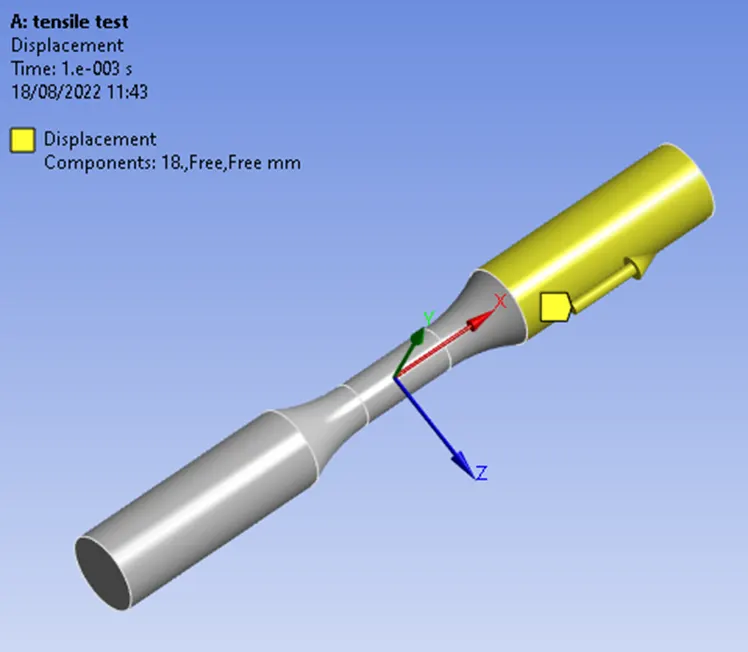
One end of the specimen is assigned with a displacement of 18mm in X-direction simulating a tension pull on the bar.
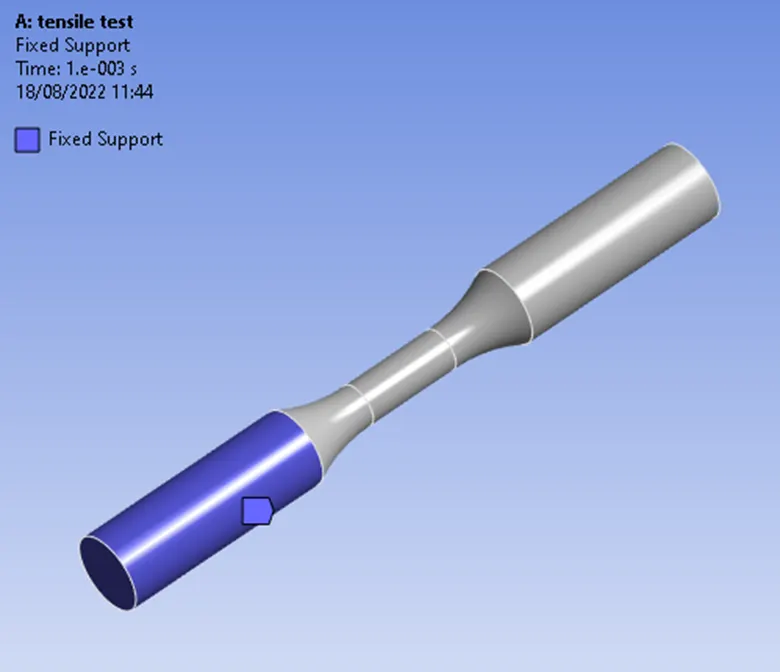
The other end of the specimen is assigned with fixed support so that equilibrium is maintained.
The model is solved for the results, and the required results are plotted as below
- Total Deformation
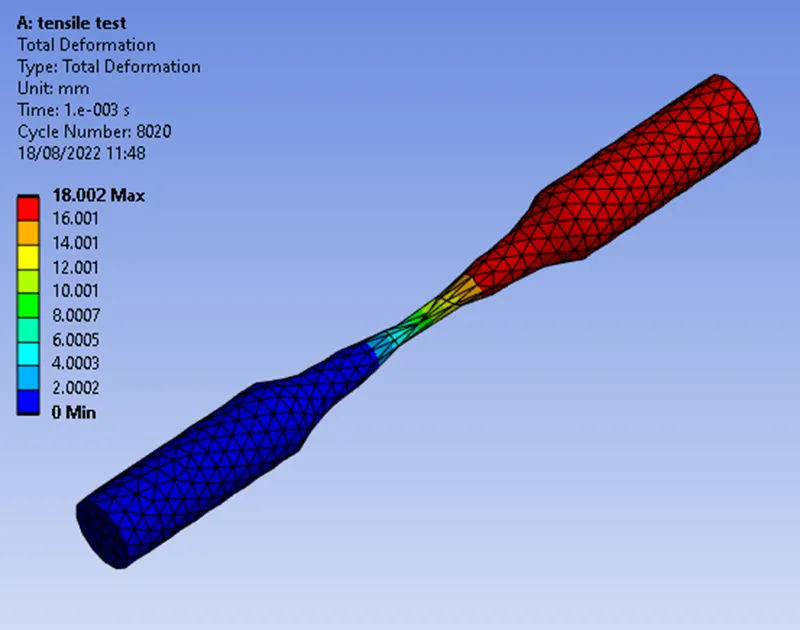
The total deformation = 18 mm which is equal to the applied value
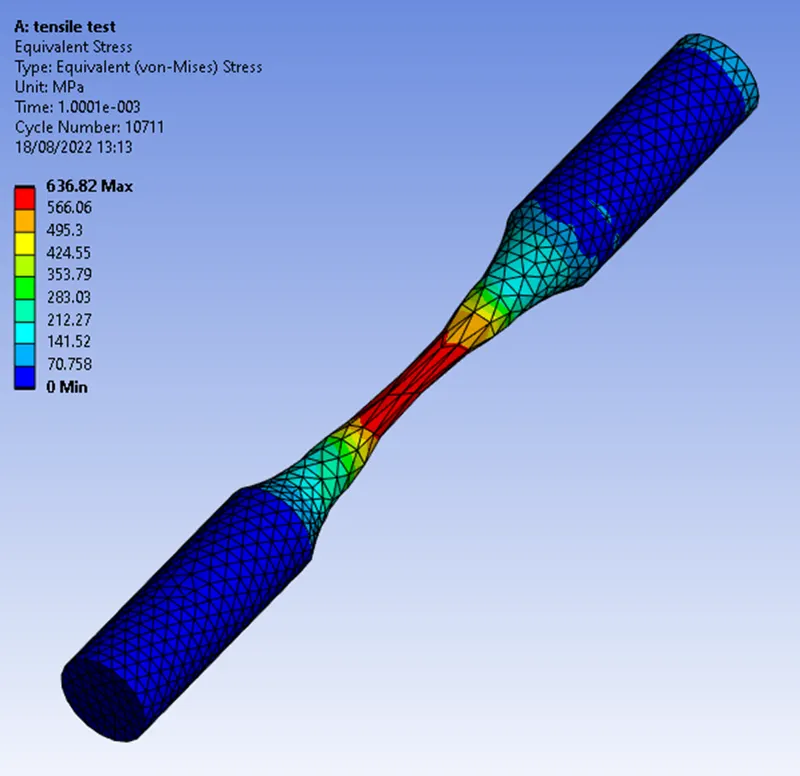
- Equivalent Stress
The maximum stress in the specimen – 636.82 MPa at end time step.
- Temperature of the Specimen
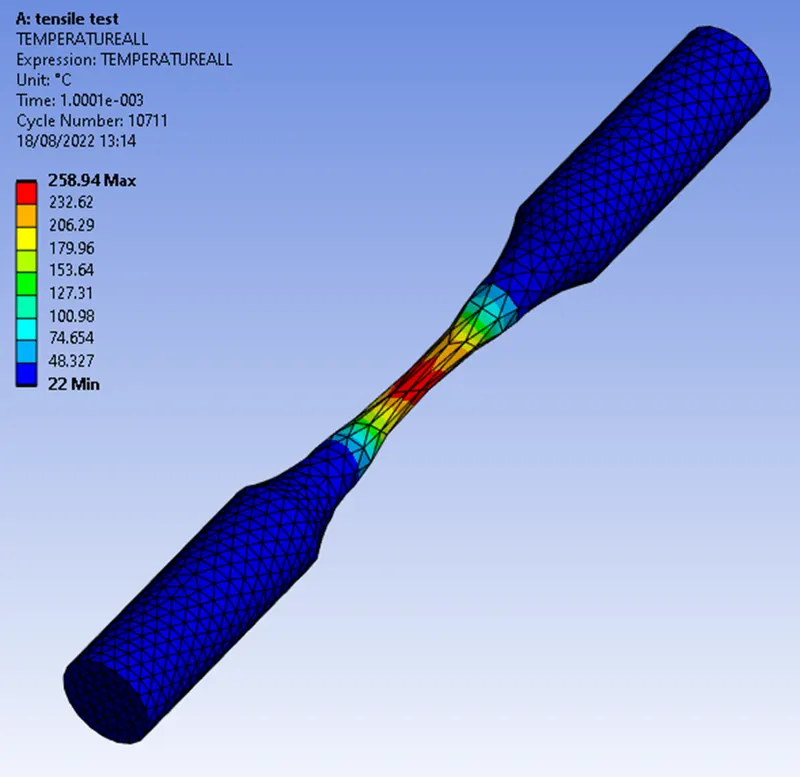
The maximum temperature in the specimen = 258.94 0C
It occurs in the necking zone
- Results and Conclusion
The results for the tension test is tabulated as below –
|
Design Case |
Deformation (mm) |
Maximum Stress (MPa) |
Temperature in the specimen 0C |
|
Tension Test |
18.002 |
636.82 |
258.94 |
- The total deformation is 18mm which is equal to the applied displacement which means there are no particles flying from the bar and the body is intact.
- Stress plot is symmetric in the central zone and stress increases in the weaker section of the bar and exceeds the elastic limit thus formation of the necking.
- Temperature rises in the central zone as plastic deformation occurs which alters the grain structure and intermolecular friction causes the rise of temperature.
- The temperature plot shows the gradual rise in temperature similar to the stress plot, as the stress nears or exceeds the plastic limit the temperature rises in the same proportion.
Simulation of Torsion Test – the specimen is rotated by 1200 deg.
Model and Analysis Set up
- Model Geometry
Same as the Tension Test
- Materials
Same as the Tension Test
- Meshing
Same as the Tension, plus additional parameters as below
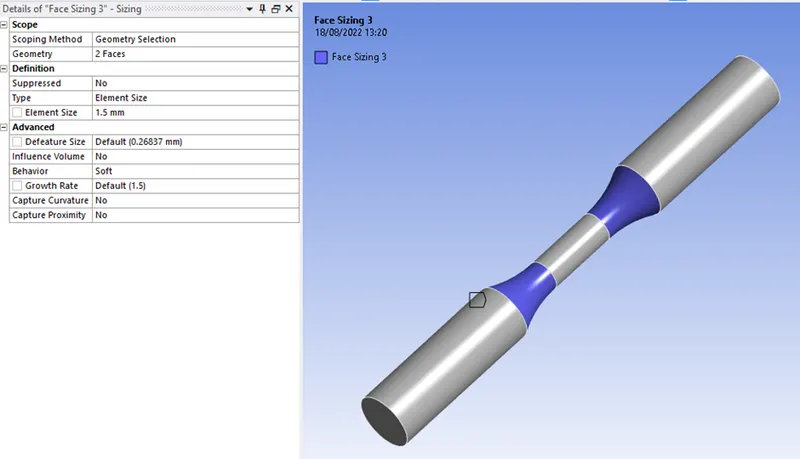
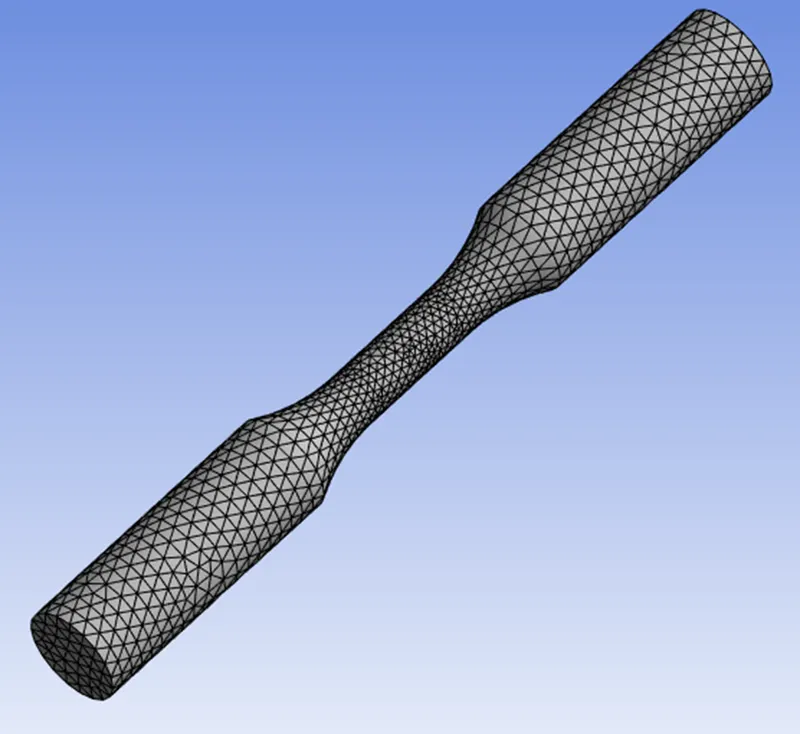
The middle potion of the specimen bar is meshed with additional parameters
The faces shown in the below sketch are meshed with element size = 1.5mm
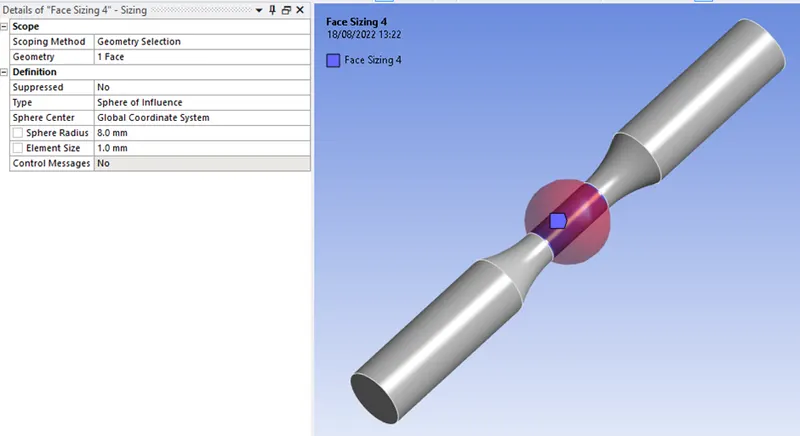
The centre part is meshed with sphere of influence – Radius = 8mm and element size – 1mm
Final meshed model as below
- Analysis Settings
Same as Tension Test
- Loads and Supports
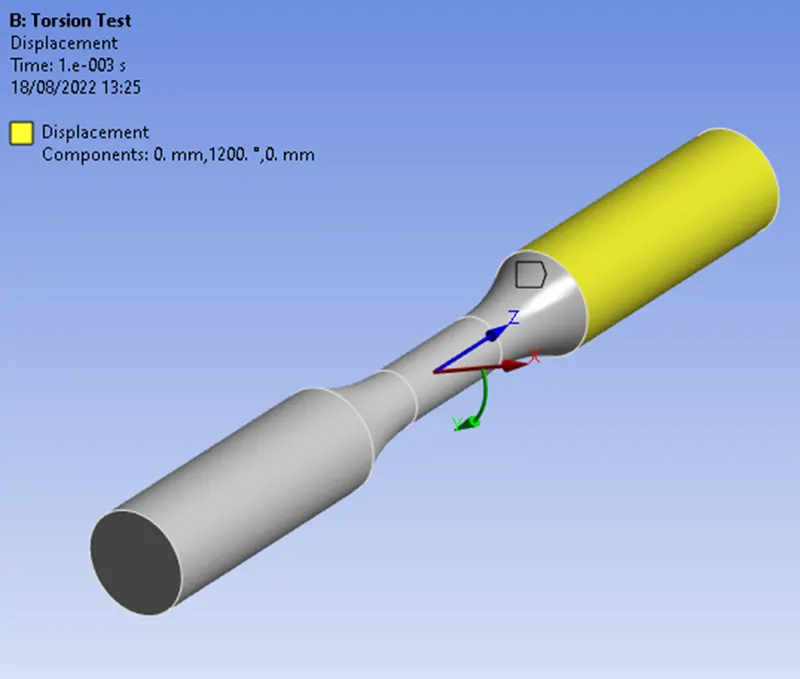
One end of the specimen is assigned with an angular displacement of 1200 deg. in cylindrical Y-direction simulating a torsional motion on the bar.
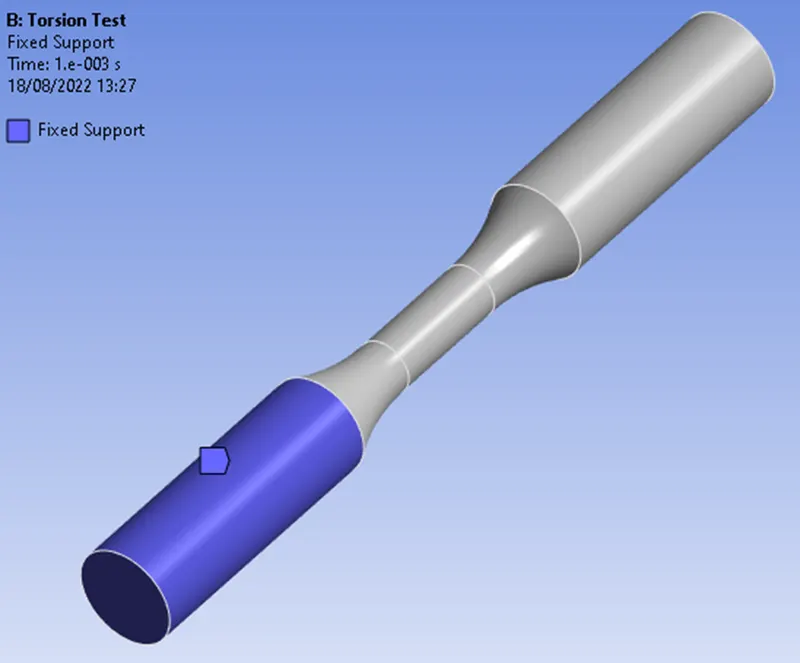
The other end of the specimen is assigned with fixed support so that equilibrium is maintained.
The model is solved for the results, and the required results are plotted as below
- Total Deformation
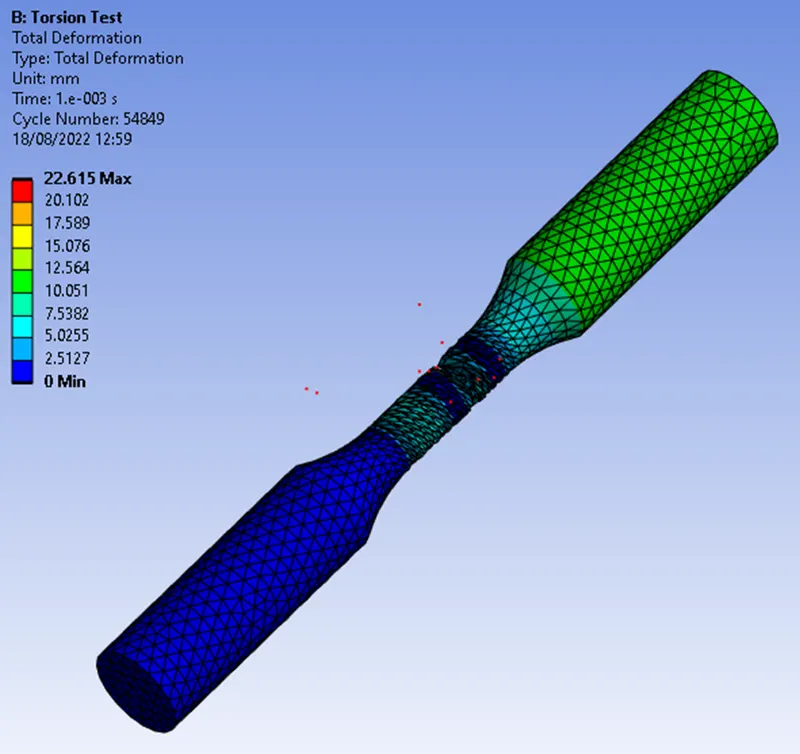
The total deformation = 22.615 mm which is of the pieces flying from the specimen
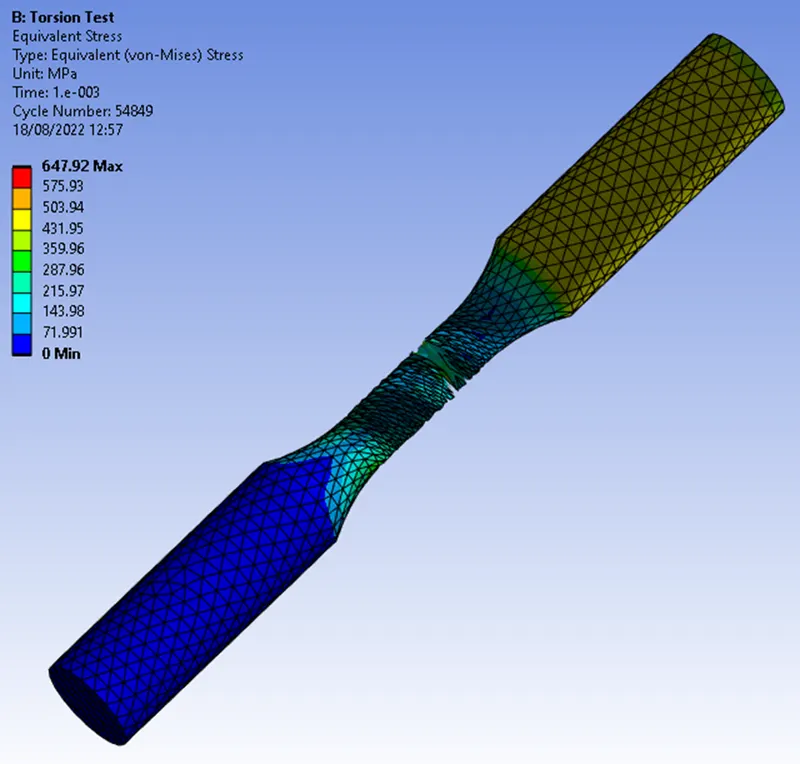
- Equivalent Stress
The maximum stress in the specimen – 647.92 MPa which is well beyond the elastic limit.
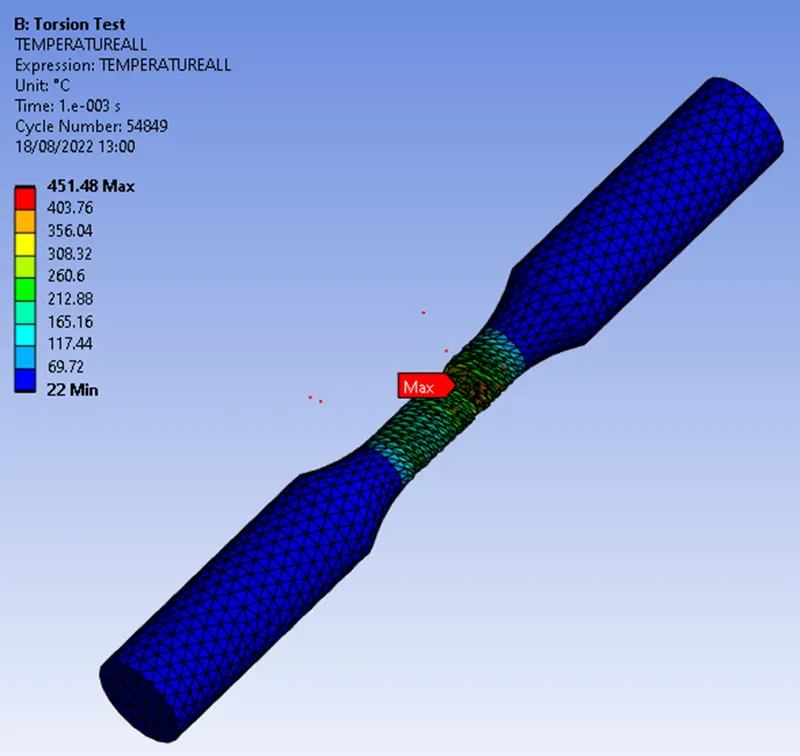
- Temperature of the Specimen
The maximum temperature in the specimen – 451.5 0C
- Results and Conclusion
The results for the torsion test is tabulated as below –
|
Design Case |
Deformation (mm) |
Maximum Stress (MPa) |
Temperature in the Specimen 0C |
|
Torsion Test |
22.615 |
647.92 |
451.48 |
- The total deformation is 22.615 mm and it is for the particles flying of the bar proving the bar has disintegrated under torsional force.
- The torsional force applied portion of the bar has stressed more than the fixed portion which is consistent with the principles of static.
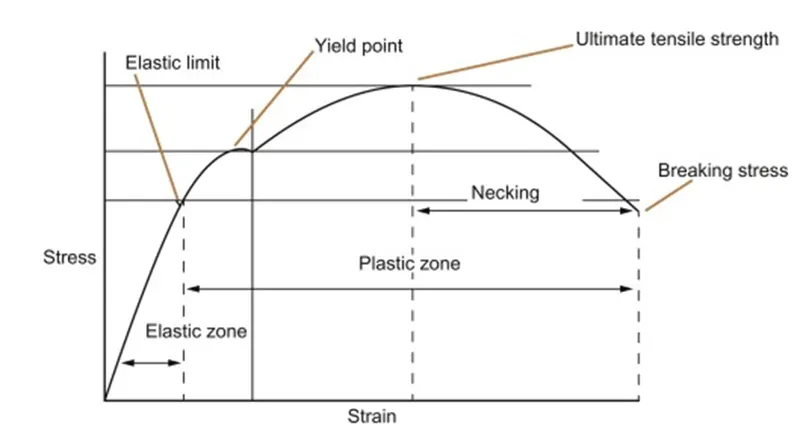
- The stress plot of the central zone shows interesting results, the stress animation shows the central zone reaches the plastic limit and then stress again drops which matches the stress-strain curve of the steel in the necking zone.
- Temperature rises in the central zone as plastic deformation occurs which alters the grain structure and intermolecular friction causes the rise of temperature.
- The temperature of the central zone is higher in the torsion test case than the tension test case because the bar specimen has undergone fracture and the probably the grain structure is broken in other direction causing increased friction.