Week 9:Super Charger Simulation Project
JORGE LOZANO
Advanced Turbomachinery Simulation using Converge
Super Charger Simulation Project
Complete Boundary Flagging and run NO HYDRO.
- Get Supercharger performance data (i.e total pressure ratio vs mass flow rate)
- Array of Pressure Ratio = [ 1.1 1.5 2.0 2.2]
- i.e for these 4 values of Pressure ratio get the mass flow rate and plot the graph between the total pressure ratio and mass flow rate for these 4 values.
- Compare results with total_energy_solver
- Check if mass is conserved.
- Make use of MS EXCEL to check whether mass is conserved or not.
- Import the data of mass flow rate at Inlet and Outlet and add them up.
- After adding, ideally it should be zero for mass to be conserved but it will not be exactly zero.
- The difference should not be more than 2e-4 kg/s.
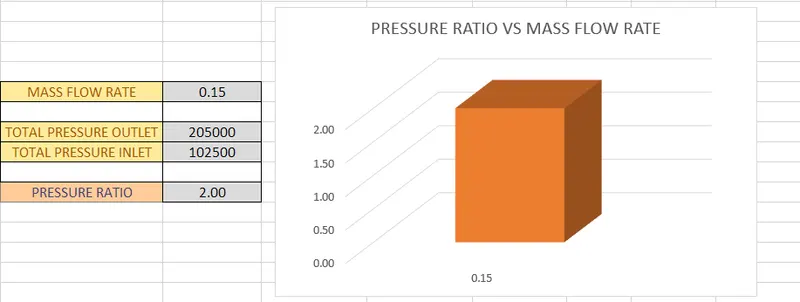
Due to computational limitations, only one simulation case will be performed of pressure ratio:2
Documentation [1][2]
A twin-screw supercharger is a positive displacement rotary compressor, the working cavity of which is enclosed by the casing bores, casing end plates and the helical surfaces of the male and female rotors. Due to the geometry of the meshing parts and the need for clearances between them, the supercharger has several leakage paths as follows: across the contact line between the male and female rotors, across the sealing lines between the rotor tips and casing, through the blow hole, and through the clearance between the end plate and the rotor end face at the discharge end [1]. As the performance of a twin-screw supercharger is influenced more by the internal air leakages than by any other thermo-fluid aspect of its behavior, it is important to quantify the leakage rate through each leakage pathway, and, the percentage by which it can reduce the efficiencies for the purpose of prioritizing design procedures in general and for improving the rotor lobe profile. The field of engineering design optimization using computational fluid dynamics (CFD) can improve the performance and quality of existing products and potentially lead to novel designs, which can be crucial in maintaining competitiveness in world markets. However, engineering design optimization can be very time-consuming when high-fidelity analysis models are involved. In this study, two essential elements are required in the optimization process: these are geometry design using computer-aided design (CAD), and CFD simulation and analysis [2]. These two elements construct a cycle for optimization design. Virtually, all computer-based design tasks commence with the use of CAD systems to create detailed geometrical models. These models serve as the point of departure for analysis tool, CFD. By integrating these essential elements, the optimization design process allows easy access to remote computational resources and data archive capabilities. By repeating this cycle, the optimization design is achieved. [2]
Reliable CFD Analysis of Lobe Blowers and Expanders [1]
And what can design engineers of lobe blower ore expander geometries expect from CFD simulation? CFD simulation results generated with TwinMesh, ANSYS CFD and CONVERGE provide design engineers of roots blowers, expanders and roots-type superchargers with essential information such as:
- Velocity, pressure, and temperature fields within the working chambers and in axial and radial clearances
- Flow rates and mass flow at different operation points
- Torques, moments, forces and machine efficiency (CoP)
- Leakage and losses
- Pulsation behaviour of the machine
- Mechanical wear, lubrication and cooling
- Duration and magnitude of acoustic sources (emission)
Preprocessing
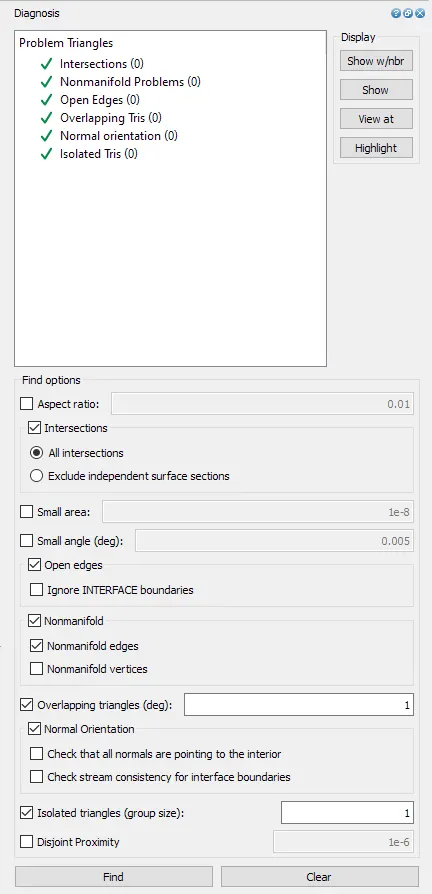
Before the set-up configuration, a cleanup must be perform checking all issues from the diagnosis ran, to produce a well and accurate to reality boundaries and geometry.
The following image shows the final geometry diagnosis ran:
The next most important selections will condition the simulation to a certain kind of flow, main material as mixture with oxygen and nitrogen, simulation parameters as what kind of simulation is, how many iterations, algorithm used, initial conditions with the boundaries, grid control, physical models and the post processing variables obtained from the simulation.
The pre-processing was realized in Converge Simple, while the processing of the simulation will be using the software Cygwin which allows systems to be recompiled and run natively on Windows that by using several processors the simulation will be run using the Converge Studio initial conditions.
After having all boundaries and geometry correct the general flow simulation is set to as in the right side in the image to generate and apply the equations needed.
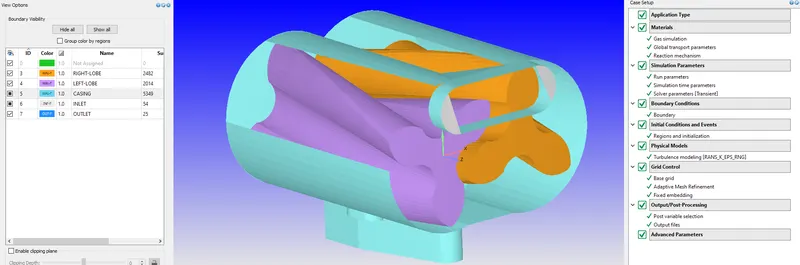
After it is pre-processed and before running the actual simulations no hydro simulations must be performed, the following shows a mesh generation in the total energy solver case, where the angular velocity is given at 216000 degrees per second at the right and left lobe at their proper direction.
Processing
Simulations
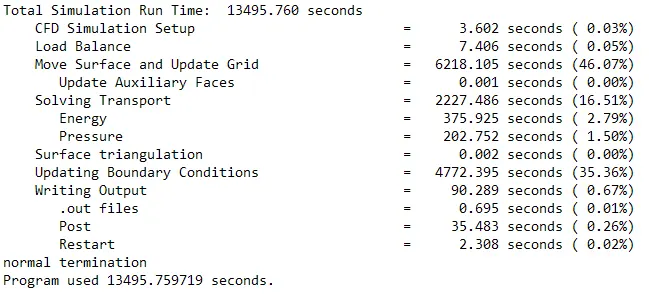
The following images present the overall timing of the simulation, containing the load balance and section time recording to see and be able to optimize the simulation if needed.
Simulation case
Postprocessing
The post processing was carried out using the Para view software and converge plot generation as required comparing the three cases simulated.
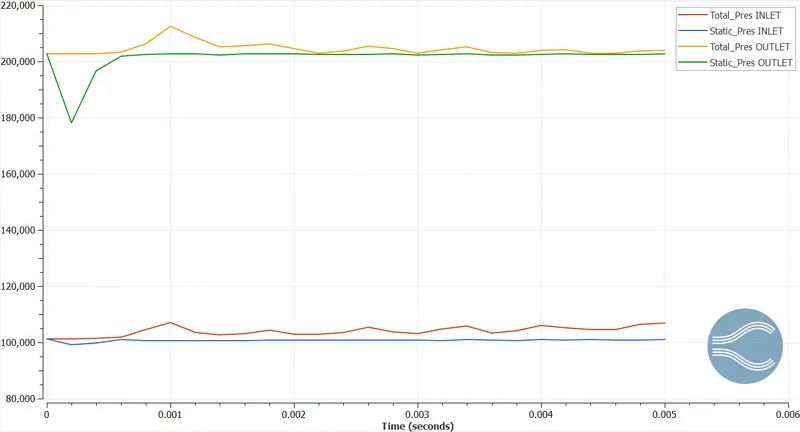
Pressure inlet and outlet Converge graph:
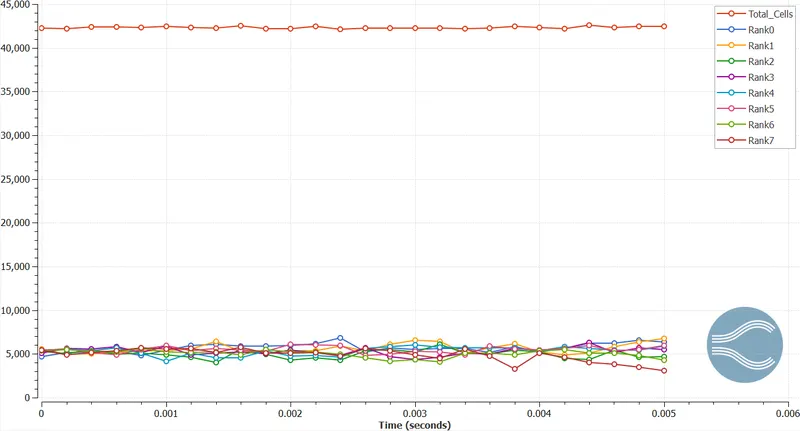
Total cells Converge graph:
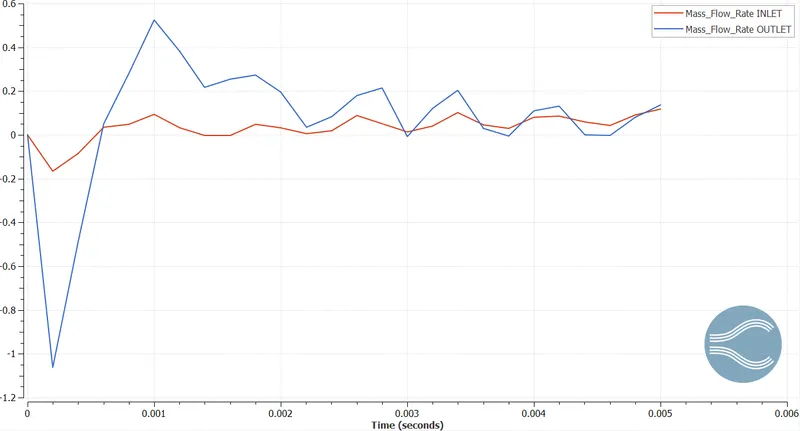
Mass flow rate Converge graph:
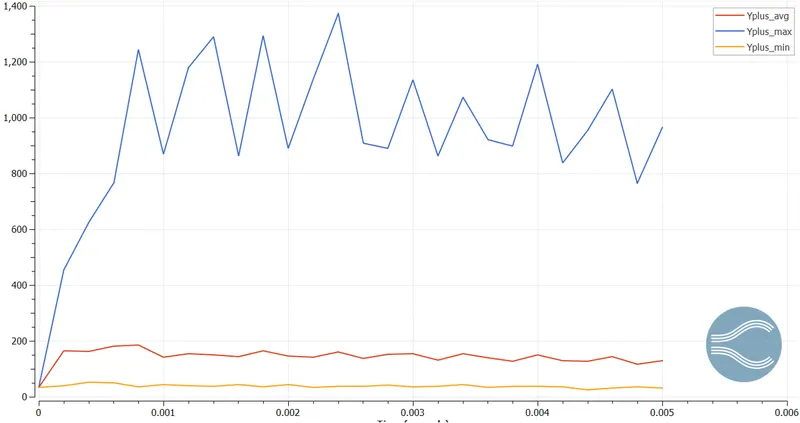
Y+ Converge graph:
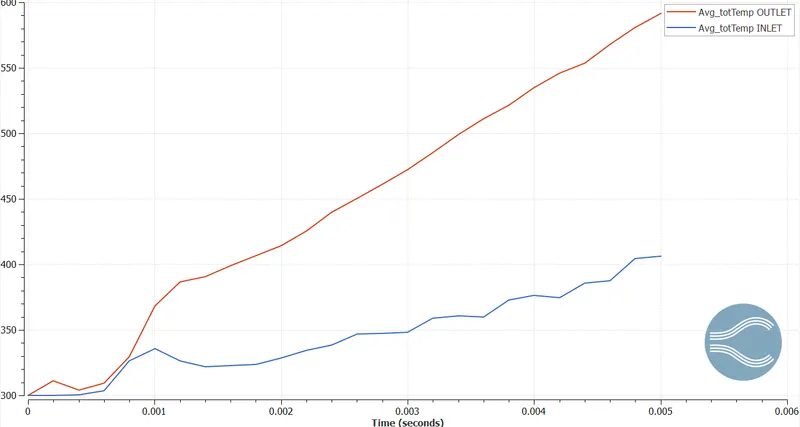
Temperature Converge graph:
Videos post processing:
Video 1 No hydrodynamic simulation, pressure ratio:2
Video 2 Complete simulation velocity contour, pressure ratio:2
Video 3 Complete simulation pressure contour, pressure ratio:2
Video 4 Complete simulation temperature contour, pressure ratio:2
Conclusion
Due to the requirement of high computational time expensive resources only one of the simulations was performed but was able to obtain valuable and recognizable results. It was able to see the convergence effects of the total energy solver as well as the y+ effect within the mesh applied which was an AMR and adaptive permanent mesh, having the moving rotating lobes at a pressure ratio of twice the initial total pressure. Converge shows a very efficient fast simulation as seen from the computational timing and other validations from users at the same pre-processing conditions and geometry.
Pressure ratio vs mass flow rate plot:
References
- https://www.twinmesh.com/project/reliable-cfd-analysis-of-lobe-blowers-and-expanders
- The leakage analysis in a twin-screw supercharger by using an integrated CAD/CFD three-dimensional model., Alexander Subic et al., May 2007, ResearchGate.