Week 9 - Senstivity Analysis Assignment
Aim: Using the Reactor Network in Cantera, determine the sensitivity factor for the GRI Mechanism.
Objective:
- The purpose of this research is to learn more about the significance of sensitivity analysis.
- To write the code for the GRI mechanism's sensitivity analysis.
- To write a program that displays reaction strings in the order of highest sensitivity to least sensitivity.
- To create a sensitivity analysis parametric code.
- To plot the result of the ignition delay in time vs. reaction temperature.
Introduction:
There are various reactions taking place in a typical natural gas combustion process in terms of temperature and duration. Some reactions have a significant impact on the ignition delay, whereas others do not. It's crucial to figure out which reaction is most sensitive to auto-ignition and ignition delay in order to tailor the reaction. Sensitivity analysis is used to see how response factors like species concentration, pressure, and temperature affect the outcome. The rate of change of temperature with regard to the molar fraction of species included in the reactions is the major focus of the sensitivity analysis. The sensitivity coefficients might be positive or negative, with each having its own meaning. Several reaction effects such as ignition delay are known to exist, depending on the chemical processes in which hydrocarbons are involved. The positive sensitivity coefficient of response indicates a shorter ignition delay time period, implying a shorter auto-ignition time.
In the same way, a negative sensitivity coefficient for a certain response indicates an increase in ignition delay time. Depending on the combustion phenomena, the sensitivity coefficient must be lowered or raised to tailor the response.
To assess the reaction's sensitivity, Canter employed a reactor network object that estimates the state of the reaction, such as temperature, pressure, and species concentration. It is necessary to establish a succession of reactor networks for a single reactor in order to generate the required data for the user.
Coding :
The code begins with key modules for mathematics, object-oriented programming, and graphing the results. The gas object, which depicts the natural gas combustion phenomena and its accompanying reactions, is then utilized from the GRI mechanism. It is necessary to provide beginning conditions for iterating the reaction, which is supplied as temperature and pressure, respectively. The reactor network was built using the reaction as an ideal gas constant pressure reactor mechanism. The network reaction is saved in the reactions variable, which may be utilized for iterations later. A variable named 'n' is generated to define the responses that will be used in the sensitivity analysis. Because the id of the reaction must be known, another variable named 'rid' is used.
Because it is necessary to identify the ten most sensitive responses from the combustion phenomena, the variable 'N' is established and coded as a parameter that may be changed according to the user's needs in order to obtain the maximum number of reactions from the mechanism. To determine the sensitivity of each reaction in variable 'n,' a loop is developed that reads all of the reactions and calculates their sensitivity. Absolute and relative limits for solution and sensitivity have been specified for convergence purposes. The highest temperature that the reaction will reach must be retrieved and kept in a variable called 'st max.'
The reaction variable 'states' is utilized to retrieve the temperature, pressure, and molar concentration of species, which is then calculated using the 'SolutionArray' class. The time for the answer is then calculated using the variable t' in code. A loop is built in which the 'advance method is employed for time integration function in reaction network to find out the state variable in the time domain. Another loop is formed inside the first time loop to store the highest temperature obtained in each reaction. As previously noted, these two loops function in tandem to extract state variables with regard to time and temperature.
The absolute temperature is used to obtain the results from the code. The variables 'r', 'rid number', and 's ' are used to specify reaction names, reaction ID numbers, and sensitivity coefficients, respectively. Various printing techniques are employed to view the sensitivity coefficient in the output panel to see the findings. Also constructed is a bar graph of the sensitivity index, as well as graphs of temperature vs. ignition delay and molar concentrations of 'CH4', '02, and 'H' vs. time in milliseconds. The following is the sensitivity analysis code:
Code :
import sys
import matplotlib.pyplot as plt
from matplotlib.pyplot import *
import cantera as ct
import numpy as np
from numpy import *

gas = ct.Solution('gri30.xml')
T0 = 1500
P0 = ct.one_atm
gas.TPX = T0,P0, {'CH4' : 1, 'O2' : 2, 'N2':7.52}

r=ct.IdealGasConstPressureReactor(gas)
sim = ct.ReactorNet([r])
reactions = gas.reaction_equations()

n = gas.n_reactions
rid = linspace(1,n,n).astype(int)
N = 10
for i in range(n):
	r.add_sensitivity_reaction(i)

sim.rtol = 1e-06
sim.atol = 1e-15
sim.rtol_sensitivity = 1e-06
sim.atol_sensitivity = 1e-06

sT_max = [0]*n

states = ct.SolutionArray(gas,extra=['t_in_ms'])

t=linspace(0,2e-3,401)

for i in range(len(t)):
	sim.advance(t[i])
	states.append(r.thermo.state,t_in_ms=t[i]*1e3)

	for j in range(n):
		sT = sim.sensitivity('temperature',j)
		if abs(sT) >= abs(sT_max[j]):
			sT_max[j] = sT

reaction = [r for s,r in sorted(zip(np.abs(sT_max),reactions), reverse = True)]
rid = [r for s,r in sorted(zip(np.abs(sT_max),rid),reverse = True)]
sT_max = [sT for abs_sT,sT in sorted(zip(np.abs(sT_max),sT_max),reverse=True)]

rplot = reaction[0:N]
rid_plot = rid[0:N]
splot = sT_max[0:N]

print("The top %d temperature sensitive reaction are : " %(N))
print("-------------------------------------------------------------------")
print("%8s %4s %18s %12s %12s" %('Reaction ID','|','Reaction','|','Sensitivity'))
print("-------------------------------------------------------------------")
for i in range(N):
	print("%7d %8s %26s %4s %10.4f" %(rid_plot[i],'|',rplot[i],'|',splot[i]))
print("-------------------------------------------------------------------")

OH = states.X[:,states.species_index('OH')]
H = states.X[:,states.species_index('H')]
CH4 = states.X[:,states.species_index('CH4')]

fig1,ax1 = subplots()
y_pos = arange(len(rplot))
plt.grid('both',linestyle = '--',linewidth = 1.2)
ax1.set_axisbelow(True)
ax1.barh(y_pos,splot,0.5,align= 'center',color = 'black')
ax1.set_yticks(y_pos)
ax1.set_yticklabels(rplot,rotation=0,fontweight = 'bold')
ax1.invert_yaxis()
xticks = [-20,-15,-10,-5,0,5,10,15,20]
ax1.set_xticklabels(xticks,rotation = 0,fontsize = 12)
ax1.set_xlabel('Temperature sensitivity', fontsize = 18 , fontweight  = 'bold')
title('10 most temperature sensitive reaction for the GRI 3.0 mechanism of CH4 combusion', fontsize = 20 , fontweight = 'bold')
savefig('temperature_sensitivity_ranks.png')
show()

fig2, ax2 = subplots(2,2)
subplot(2,2,1)
plot(states.t_in_ms,states.T,linewidth = 2)
grid('both',linestyle = '--', linewidth = 0.8)
xlabel('Time [ms]',fontweight = 'bold')
ylabel('Temperature [K]',fontweight = 'bold')
subplot(2,2,2)
plot(states.t_in_ms,OH,linewidth = 2)
grid('both',linestyle = '--',linewidth = 0.8)
xlabel('Time[ms]', fontweight = 'bold')
ylabel('OH mole fraction', fontweight = 'bold')
subplot(2,2,3)
plot(states.t_in_ms,H,linewidth = 2)
grid('both',linestyle = '--',linewidth = 0.8)
xlabel('Time[ms]', fontweight = 'bold')
ylabel('H mole fraction', fontweight = 'bold')
subplot(2,2,4)
plot(states.t_in_ms,CH4,linewidth = 2)
grid('both',linestyle = '--',linewidth = 0.8)
xlabel('Time[ms]', fontweight = 'bold')
ylabel('CH4 mole fraction', fontweight = 'bold')
tight_layout()
savefig("Sensitivities.png")
show()
Results :
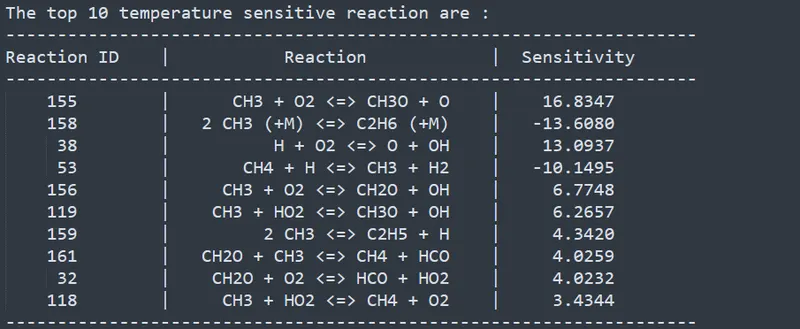
It can be observed from the above console output that this reaction is one of the most temperature-sensitive reactions in the GRI mechanism. This code does not normalize the sensitivity coefficient.
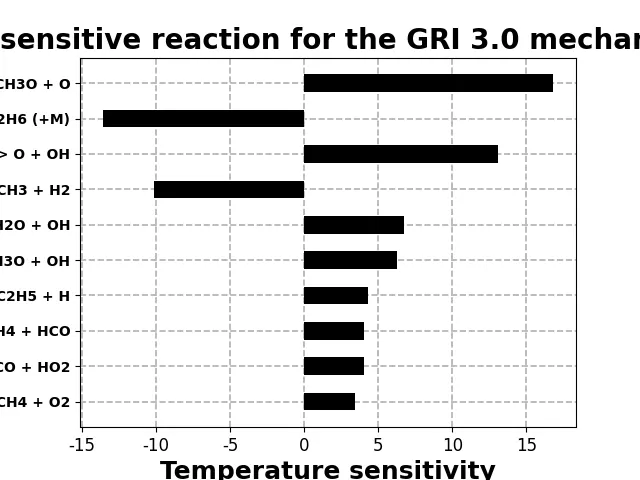
The following bar graph shows that the majority of the reactions from 10 of them have a positive sensitivity index, indicating that the ignition delay timing should be lowered. CH, + 0, # CH,O + O is the highest of all reactions. Positive sensitivity coefficients lower ignition time whereas negative sensitivity coefficients increase ignition delay time, as previously indicated.
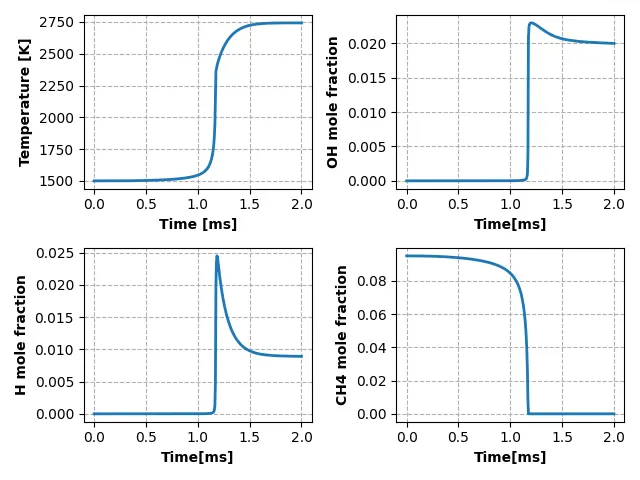
The ignition delay for the fuel and air combination at 1500 Kelvin and I atmospheric pressure is roughly 1.1 milliseconds, as seen in the graph above. Similar to that time, the mole fraction of oxygen and CH4 is decreasing due to combustion, whilst the mole fraction of monoatomic hydrogen is increasing, which then mixes with other species to generate a new species.
Discussion :
- We analyzed the sensitivity of reactions to temperature and identified the ten most sensitive reactions for auto-igniting methane.
- Because the code we've built here is extremely parametric, we can easily modify the parameter and perform sensitivity analysis for that parameter.
- We may also adjust the number necessary for the most sensitive reactions.