Week 9 - Senstivity Analysis Assignment
1.
Objective :
To carry out Sensitivity Analysis of GRI 3.0 Mechanism for finding out the Top 10 Reactions, upon which the Final System Temperature depend the most.
Introduction :
Sensitivity, in context of Chemical Kinetics is referred to as the dependence of an Output Variable (like Temperature), on an Input Parameter (say, a particular Reaction). Removing Reactions that have high Temperature Sensitivity values from the Reaction-Mechanism will hugely affect (increase or decrease, based on whether it's Sensitivity value is +ve or -ve) the Final Temperature of the System. Usually Mechanisms consist of large number of reactions, which may increase the Computational Cost significantly. Therefore, Sensitivity Analysis is used to reduce the size of the mechanism. Here, we shall try to find out the Top 10 Reactions in the GRI 3.0 Mechanism file, to which, the Final Temperature is most sensitive.
Code :
We achieve this with the following code :
# Program to carry out Sensitivity Analysis of GRI 3.0 Mechanism
# to find the Top 10 Temperature-Sensitive Reactions

"""
General ODE System for Sensitivity :
dZ/dt = f(Z, t; a)
where,
Z = [T, y_1, y_2, ..., y_k]
is a vector of Temperature & Species
y_(1, 2, ..., k) : Mass Fractions of all species
a : Net Reactant Rate Multiplier or Perturbation Factor

The Sensitivity Matrix is given by :
W_(j, i) = d(Z_j)/d(a_i)
where,
a_i : Reacton Rate Constant

The size of the Sensitivity Matrix is (k+1)*(n)
where, k represents Species & n represents Reactions

"""
import numpy as np
import cantera as ct
import matplotlib.pyplot as plt

#################################################################

gas = ct.Solution('gri30.xml')

gas.TPX = 1500, ct.one_atm, {'CH4' : 1, 'O2' : 2, 'N2' : 7.52}

reac = ct.IdealGasConstPressureReactor(gas, name = 'R1')

reac_net = ct.ReactorNet([reac])

# Saving all the Reactions in GRI 3.0 as strings
reactions = gas.reaction_equations()

# Saving Total Number of Reactions present in Mechanism File
n_reactions = gas.n_reactions

# We are interested in finding out the Top 10 Reactions that
# have the maximum effect on Temperature
n = 10

# At each t (user-defined), we shall have a sensitivity value
# (for every reaction). We want the following array to store the
# maximum of all those values
S_max = [0] * n_reactions

# Reactions to be considered for Sensitivity Analysis
for i in range (n_reactions) :
    reac.add_sensitivity_reaction(i)

# Relative & Absolute Tolerances for Species ODEs
reac_net.rtol = 1e-6
reac_net.atol = 1e-15

# Relative & Absolute Tolerances for Sensitivity ODEs
reac_net.rtol_sensitivity = 1e-6
reac_net.atol_sensitivity = 1e-6

states = ct.SolutionArray(gas, extra = ['t_ms'])

# Creating an Array for all Reaction Indices
reaction_number = np.arange(1, n_reactions+1)

#################################################################

# Loop 1 : Time Integration Loop
for t in np.arange(0, 2e-3, 5e-6) :
    reac_net.advance(t)
    states.append(reac.thermo.state, t_ms = 1000*t)

    # Loop 2 : Reaction Loop : will calculate Max Sensitivity
    # of individual reactions on Temp, for each user-defined t
    for j in range (n_reactions) :
        S = reac_net.sensitivity('temperature', j)

        # To Store Maximum Sensitivity Value for each reaction
        # over all user-defined t
        if np.abs(S) > np.abs(S_max[j]) :
            S_max[j] = S

# Creating an array containing the absolute values of S_max Matrix
S_max_abs = np.abs(S_max)

# Using the sorted function for descending order sort. We create the zip data-type
# so as to group S_max_abs with (reactions, n_reactions & S_max), as the sorting will
# take place based on the value of S_max_abs
reactions = [a for b, a in sorted(zip(S_max_abs, reactions), reverse = True)]
reaction_number = [a for b, a in sorted(zip(S_max_abs, reaction_number), reverse = True)]
S_max = [a for b, a in sorted(zip(S_max_abs, S_max), reverse = True)]

# We are only interested in Top n reactions (10, in this case)
max_sensitiv_reactions = reactions[0:n]
max_sensitiv_reaction_numbers = reaction_number[0:n]
max_sensitivity = S_max[0:n]

#################################################################

# Plotting Top 10 Reactions VS their Sensitivities
plt.figure(1)
plt.barh(max_sensitiv_reactions, max_sensitivity, color = 'black')
plt.gca().invert_yaxis()
plt.tight_layout()
plt.grid('on')
plt.xlabel('Temperature Sensitivity', fontweight = 'bold')
plt.ylabel('Reactions', fontweight = 'bold')
plt.title('10 Most Temperature Sensetive Reactions in GRI 3.0 for Methane Combustion',
           fontweight = 'bold')

# Plotting Temperature & Mole Fractions VS Time(ms)
plt.figure(2)
plt.suptitle('Variation of Temperature & Species Mole Fractions over Time',
              fontweight = 'bold')

plt.subplot(2, 4, 1)
plt.plot(states.t_ms, states.T)
plt.xlabel('Time [ms]')
plt.ylabel('Temperature [K]')
plt.tight_layout()
plt.grid('on')

plt.subplot(2, 4, 2)
plt.plot(states.t_ms, states('CH4').X)
plt.xlabel('Time [ms]')
plt.title('Mole Fraction of CH4')
plt.tight_layout()
plt.grid('on')

plt.subplot(2, 4, 3)
plt.plot(states.t_ms, states('O2').X)
plt.xlabel('Time [ms]')
plt.title('Mole Fraction of O2')
plt.tight_layout()
plt.grid('on')

plt.subplot(2, 4, 4)
plt.plot(states.t_ms, states('N2').X)
plt.xlabel('Time [ms]')
plt.title('Mole Fraction of N2')
plt.tight_layout()
plt.grid('on')

plt.subplot(2, 4, 5)
plt.plot(states.t_ms, states('CO2').X)
plt.xlabel('Time [ms]')
plt.title('Mole Fraction of CO2')
plt.tight_layout()
plt.grid('on')

plt.subplot(2, 4, 6)
plt.plot(states.t_ms, states('H2O').X)
plt.xlabel('Time [ms]')
plt.title('Mole Fraction of H2O')
plt.tight_layout()
plt.grid('on')

plt.subplot(2, 4, 7)
plt.plot(states.t_ms, states('OH').X)
plt.xlabel('Time [ms]')
plt.title('Mole Fraction of OH')
plt.tight_layout()
plt.grid('on')

plt.subplot(2, 4, 8)
plt.plot(states.t_ms, states('CO').X)
plt.xlabel('Time [ms]')
plt.title('Mole Fraction of CO')
plt.tight_layout()
plt.grid('on')

plt.show()
Results & Observations :
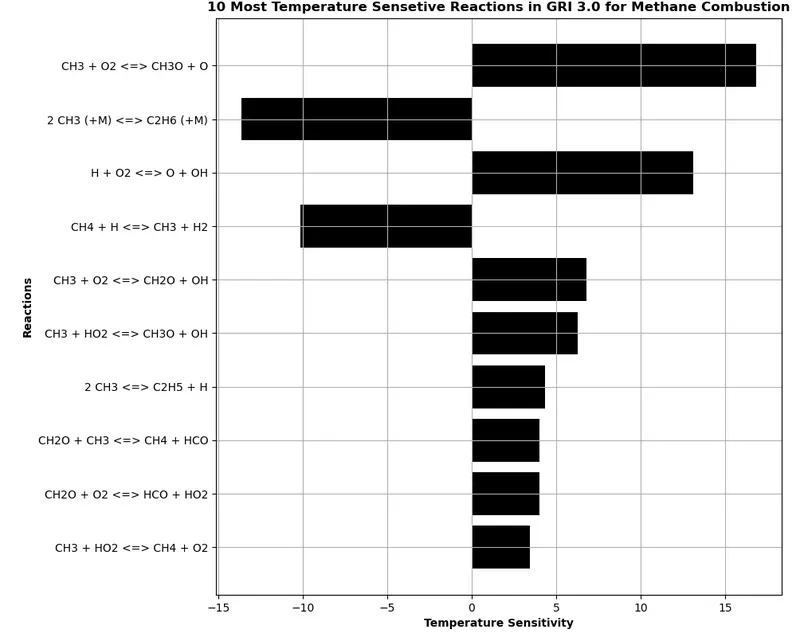
Here, we can clearly visualize the most important reactions upon which Final temperature depends. If we were to increase the rate of the first reaction, the final temperature would increase, whereas, upon increasing the rate of the second reaction, the final temperature would decrease, as it has a negative sensitivity value.
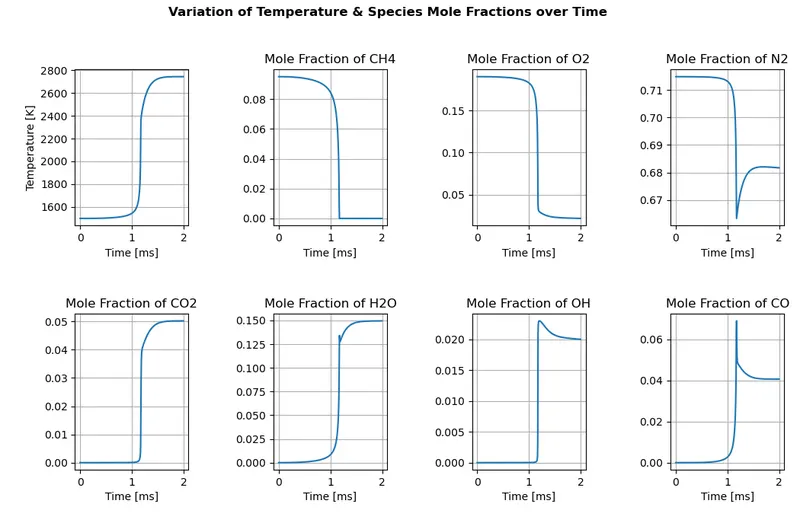
Here, we can observe the variation of Temperature & other species w.r.t time.
Conclusion :
Out of 325 reactions that make up the GRI 3.0 Mechanism, we were able to find the top 10 reactions which have the greatest effect on the Final System Temperature.