Week 9 - Senstivity Analysis Assignment
AIM - Sensitivity analysis with respect to temerature for the auto ignition of methane.
OBJECTIVE -
- To write a code that takes all the reaction from the GRI mechanism and calculates the 10 most sensitive reactions.
- The sensitivity parameter is with respect to the temperature but we will design the code in such a way the we can change the sensitivity with respect to any parameter easliy just by small tweaks .
- Also we with make sure that we can find any number of sensitive reactions easliy as well and the order of these reactions will be in the decreasing order of the sensitivities.
THEORY -
We can easily simulate auto ignition for methane and the ignition delay using cantera as a tool. Reactor class helps to store the information for each state and ReactorNet class that helps to advance and simulate the reaction for each time step. Now we will be analysis the sensitivity of the intermidiate reaction during the combustion of methane with respect to the temperature and this analysis will be done using sensitivity method within the ReactorNet class.
The sensitivity(self,component,int p, int r=0) method/function returns the sensitivity of a solution variable component in a reactor r with respect to parameter p. the component can be a string or interger. also by default r = 0 that is the first reactor.
The step that are followed to code this analysis are as follows:
- import cantera, numpy, matplotlib.pyplot modules in the code
- create a gas instance of the solution class using the GRI Mech 3.0 file , set temperature as 1500K pressure as 1 atm and give species Dict for the mole fractions of the reacting species as {'CH4': 1, 'O2': 2, 'N2': 7.56} .
- create r instance for the reactor IdealGasConstPressureReactor class using the gas and give it a name as 'R1'
- create sim instance for the ReactorNet class using r reactor
- enable sensitivity for each reaction , add tolerance values for the solution as well as the sensitivity coefficients.
- create states as an instance of the SolutionArray class that stores the state at each time step.
- create a time loop with a time step of 5e-6 sec and run time as 2e-3 sec. use advacne method to simulate the reaction at each time step store the sensitivities for all the reaction with respect to the temperature in an array and also store the maximum value of sensitivity for eacah reaction in another array. finally store the state for each reaction
- Now using the sorted zip method we can arrange all the reaction in decreasing order of their sensitivity in a given array
- printing the top N ( in our case N = 10) reaction on the output window
- plotting various plots for the reaction time vs parameters like temperature and concentration.
- also plot a bar graph that represents the top N sensitive reactions.
CODE -
The code for our analysis for the sensitivity with respect to the temperature for the auto ignition of Methane is given below:
"""
Sensitivity analysis code for Methane with respect to temperature
"""

import numpy as np
import cantera as ct

gas = ct.Solution('gri30.xml')
temp = 1500
pres = ct.one_atm

gas.TPX = temp,pres,{'CH4':1,'O2':2,'N2':7.56}
r = ct.IdealGasConstPressureReactor(gas,name = 'R1')
sim = ct.ReactorNet([r])


# enable sensitivity with respect to the rates for all reactions
for i in range(gas.n_reactions):
	r.add_sensitivity_reaction(i)

# Setting the tolerance for the solution
sim.rtol = 1e-6 # relative change in solution should be less than this value (relative => Xold - Xnew/Xold)
sim.atol = 1e-15 # absolute change in solution should be less than this value (abs0lute => Xold -X new)

# setting the tolerance for the sensitivity coefficients
sim.rtol_sensitivity = 1e-6 # relative change should be less than this value
sim.atol_sensitivity = 1e-6 # absolute change should be less than this value

# empty array to store sensitivity for each reaction
s =np.zeros(gas.n_reactions)
# empty array to store the maximum sensitivity of each reaction
sens_max = np.zeros(gas.n_reactions)

# empty array to store the reactions
reaction_list = []
# array to store the id of each reaction
reaction_id = np.linspace(1,325,325).astype(int)

# appending the reactions in the reaction_list array
for i in range(gas.n_reactions):
	reaction_list.append(sim.sensitivity_parameter_name(i))

# to store the state at each time step
states = ct.SolutionArray(gas, extra = ['t','sens'])

# time loop with time step 5e-6 and total time 2e-3
for t in np.arange(0,2e-3,5e-6):
	# simulating using the advance method
	sim.advance(t)
	# to find the sensitivity with respect to temperature for each reaction
	for j in range(gas.n_reactions):
		s[j] = sim.sensitivity(r.component_index('temperature'),j)
		# to update the maximum value of the sensitivity for each reaction
		if np.abs(sens_max[j]) < np.abs(s[j]):
			sens_max[j] = s[j]

	# appending the state at each time step
	states.append(r.thermo.state,t = 1000*t,sens = s)


# using the sorted zip method
# to store the reaction in decreasing order
reac_n = [a for b, a in sorted(zip(np.abs(sens_max),reaction_list), reverse = True)]
# to store the sensitivity in decreasing order
s_max = [a for b, a in sorted(zip(np.abs(sens_max),sens_max), reverse = True)]

# top N sensitive reactions
N=10

# Array to store top N sensitive reactions
max_reactions = reac_n[0:N]
#Array to store top N sensitivities
max_sensitivity = s_max[0:N]


# Loop to print top N sensitive reactions with their sensitivities
print(str(N)+' most sensitive reactions in GRI3.0 mechanism in '+str(gas.n_reactions)+' reactions are as follows:')
for i in range(N):
	print('For reaction ' +str(max_reactions[i])+' sensitivity is '+str(max_sensitivity[i]))


# plotting
import matplotlib.pyplot as plt
plt.figure(1)
plt.subplot(3,2,1)
plt.plot(states.t,states.T)
plt.xlabel('time(ms)')
plt.ylabel('temperature(K)')
plt.subplot(3,2,2)
plt.plot(states.t, states('OH').X)
plt.xlabel('time(ms)')
plt.ylabel('OH mole fraction')
plt.subplot(3,2,3)
plt.plot(states.t, states('H').X)
plt.xlabel('time(ms)')
plt.ylabel('H mole fraction')
plt.subplot(3,2,4)
plt.plot(states.t, states('O2').X)
plt.xlabel('time(ms)')
plt.ylabel('O2 mole fraction')
plt.subplot(3,2,5)
plt.plot(states.t,states('CH3').X)
plt.xlabel('time(ms)')
plt.ylabel('CH3 mole fraction')
plt.subplot(3,2,6)
plt.plot(states.t,states('CH4').X)
plt.xlabel('time(ms)')
plt.ylabel('CH4 mole fraction')
plt.tight_layout()

plt.figure(2)
plt.plot(states.t,states.sens)
plt.xlabel('time(ms)')
plt.ylabel('Temperature sensitivity')


plt.figure(3)
plt.gca().invert_yaxis()
plt.barh(range(N), max_sensitivity)
plt.yticks(range(N),max_reactions)
plt.grid()
plt.ylabel('Chemical Reactions')
plt.xlabel('Temperature Sensitivity')
plt.suptitle('Top '+str(N)+' reactions with higher sensitivities')
plt.tight_layout()

plt.show()
Output:
the output window gives us the top 10 sensitive reaction with respect to temperature in decreasing order
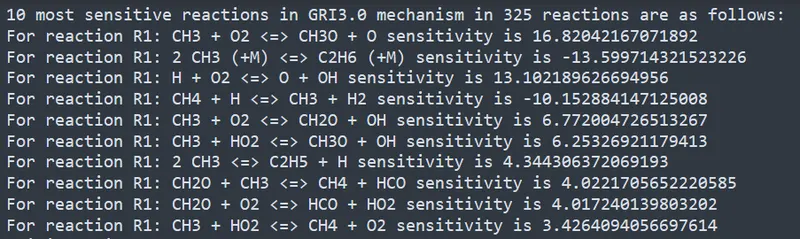
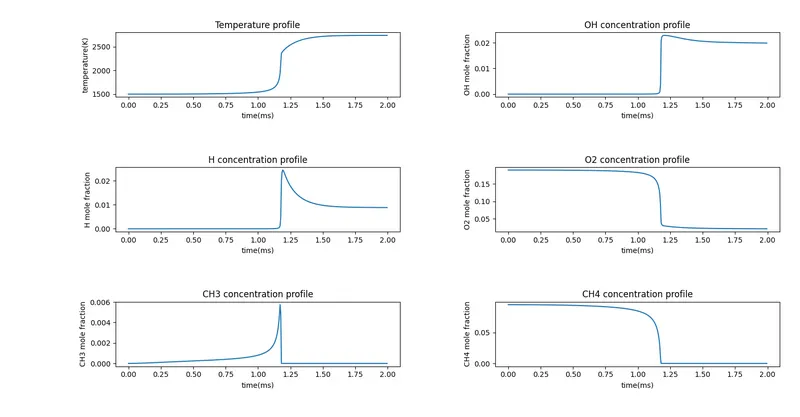
and the output plots are shown below:
Plot 1: It gives the temperature and concentration porfiles during the simulation
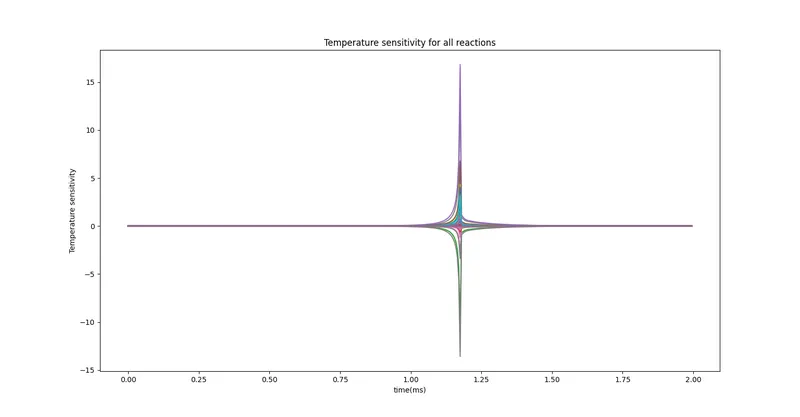
Plot 2: Plot for the temperature sensitivity for each of the reactions during the simulation
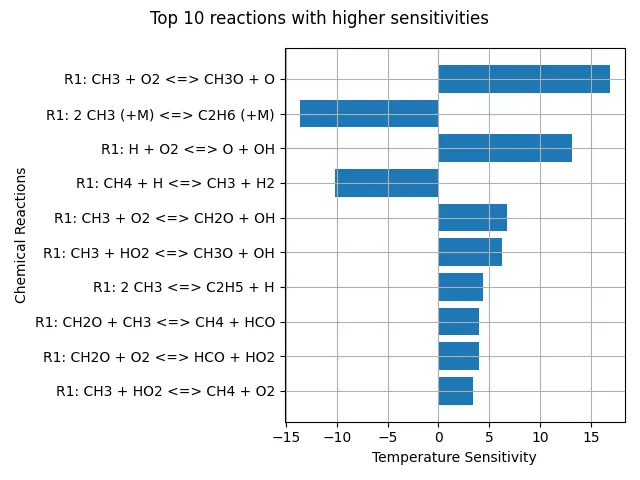
Plot 3: Bar plot that shown the 10 most sensitive reaction with respect to temperature
Now if we want to find the sensitivity with respect to any other parameter we can do it easliy just by changing the parameter in line number 52 and if we want to change the value of N that gives the top N reaction we can tweak it in like number 68 of our code.
Thought we might need to change some title and subtitles in the plotting section but that all needed. So this code is quite intutive and parametric according to our need .
CONCLUSION -
- We have done the analysis for the sensitivity of the reactions with respect to temperature and we have find out the 10 most sensitive reactions for the auto ignition of methane.
- the code that we have written here is very parametric so we can easliy change the parameter and do the analysis for the sensitivity wiith respect to that parameter.
- also we can change the number for the highest sensitive reactions required.