Week 9 - Senstivity Analysis Assignment
program to calculate sensitivity
Following steps are taken.
1. initialize the gas instance from the gri30 mechanism file and set the initial temperature to 1500k and pressure 1 atm and species concentration for CH4, O2, and N2 at stoichiometric conditions.
2. The ideal gas constant pressure reactor ‘r’ from the gas instance and a reactor network ‘sim’ from the ‘r’ instance.
3. Select the number of most sensitive reactions to be considered from the sensitivity analysis calculation. For time being N = 10
4. Total reactions equations and their numbers from the input file.
5. Input reactions from mechanism file for sensitivity analysis
6.Relative (rtol) and Absolute (atol) tolerance are given for the solution to converge.
7.Number of sensitive reactions to be displayed.
8. solution array that stores the reaction at each time step and define time for the time loop.
9. sorting the reactions using zip function and assigning the N sensitive values.
10. Plot the graphs in the required format.
"""
program to calculate sensitivity
"""
#importing modules
import matplotlib.pyplot as plt
import cantera as ct
import numpy as np
""" 1. initialize the gas instance from the gri30 mechanism file and
    set the initial temperature to 1500k and pressure 1 atm and
    species concentration for CH4, O2 and N2 at stoichiometric condition.
"""
gas = ct.Solution('gri30.cti')
T = 1500
P = ct.one_atm
gas.TPX = T,P,{'CH4':1,'O2':2,'N2':7.52}

# The ideal gas constant pressure reactor ‘r’ from the gas instance and
# a rectornetwork ‘sim’ from the ‘r’ instance.

r = ct.IdealGasConstPressureReactor(gas)
sim = ct.ReactorNet([r])

#Select number of most sensitive reactions to be consider from sensitivity analysis calculation.

N = 10

#total reactions equations and their numbers from input file.

reactions = gas.reaction_equations()
n = gas.n_reactions

#input reactions from mechanism file for sensitivity analysis
for i in range(n):
    r.add_sensitivity_reaction(i)

#Relative (rtol) and Absolute (atol) tolerance are given for the solution to converge.

sim.rtol = 1e-6
sim.atol = 1e-15
sim.rtol_sensitivity = 1e-6
sim.atol_sensitivity = 1e-6

#number of sensitive reactions to be displayed
sT_max = [0]*n

#solution array that stores the reaction at each time step
states = ct.SolutionArray(gas,extra='time')
reac_num = np.arange(1,n+1)

#outer time loop
for t in np.arange(0,2e-3,5e-6):
    sim.advance(t)
    states.append(r.thermo.state,time = t*1e3)
    for j in range(n):
        sT = sim.sensitivity('temperature',j)
        if abs(sT)>=abs(sT_max[j]):
            sT_max[j] = sT

s_abs = np.abs(sT_max)

#sorting the reactions

reactions = [a for b, a in sorted(zip(s_abs,reactions),reverse = True)]
reac_num = [a for b, a in sorted(zip(s_abs,reac_num),reverse = True)]
sT_max = [a for b, a in sorted(zip(s_abs,sT_max),reverse = True)]#table creation


#assigning the N sensitive values

max_r = reactions[0:N]
max_n = reac_num[0:N]
max_s = sT_max[0:N]


print("The Top %d Most Temperature Sensitive Reactions :"%(N))
print("------------------------------------------------------------------")
print("%1s %8s %4s %18s %12s %12s %4s"%('|','RACTION ID','|','REACTION','|','SENSITIVITY','|'))
print("")

print("------------------------------------------------------------------")
for i in range(N):
    print("%7d %10s %26s %4s %10.4f"%(max_n[i],'|',max_r[i],'|',sT_max[i]))
print("------------------------------------------------------------------")
#plotting
#time vs temperature
plt.subplot(2,2,1)
plt.plot(states.time,states.T)
plt.xlabel('time in ms')
plt.ylabel('temperature k')
#time vs OH mole fraction
plt.subplot(2,2,2)
plt.plot(states.time,states('OH').X)
plt.xlabel('time in ms')
plt.ylabel('OH mole fraction')
#time vs H mole fraction
plt.subplot(2,2,3)
plt.plot(states.time,states('H').X)
plt.xlabel('time in ms')
plt.ylabel('H mole fraction')
#time vs CH4 mole fraction
plt.subplot(2,2,4)
plt.plot(states.time,states('CH4').X)
plt.xlabel('time in ms')
plt.ylabel('CH4 mole fraction')
plt.tight_layout()
#bar graph showing 10 sensitive reactions
plt.figure(2)
plt.barh(max_r,max_s,0.4,color='brown')
plt.xlabel('sensitivity')
plt.ylabel('Reactions')
plt.title('Top 10 Temperature Sensitive Reactions of grimech 3.0')
plt.gca().invert_yaxis()
plt.grid()
plt.tight_layout()
plt.show()
output:
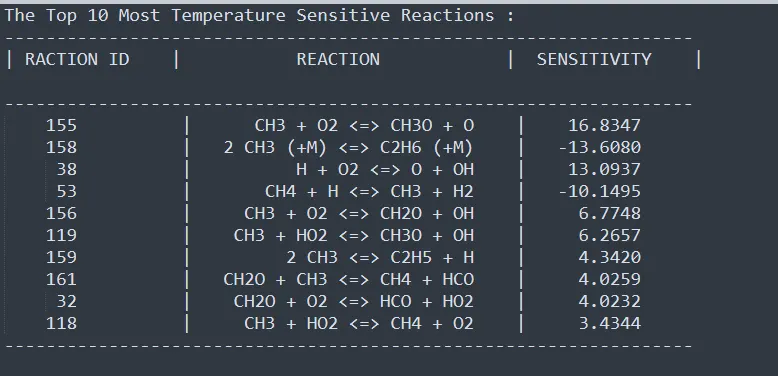
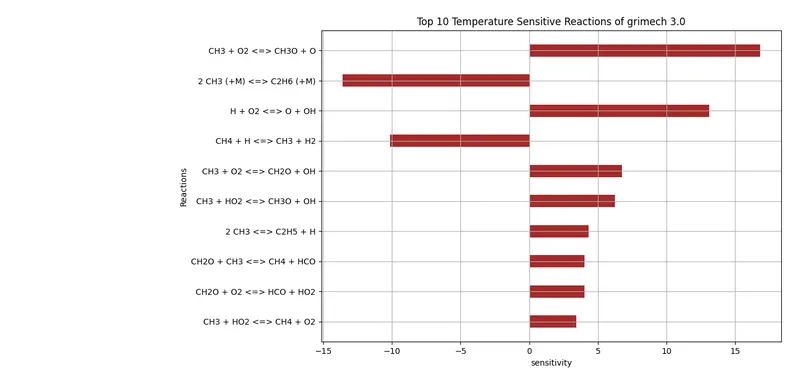
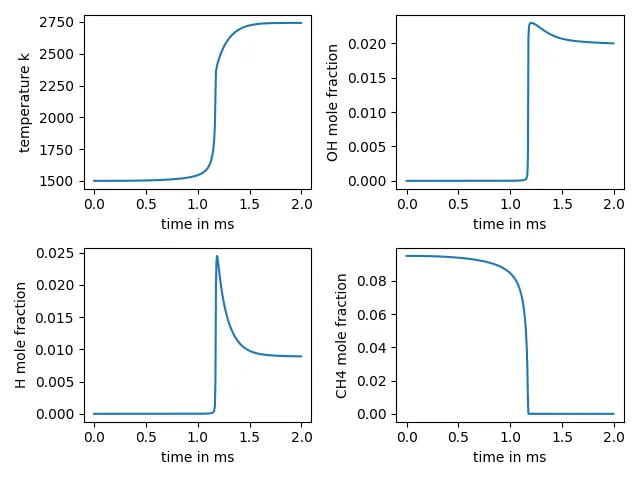
The positive sensitivity indicates that with the increment in reaction variable i.e, the temperature the rate of reaction will increase which leads to faster combustion due to a decrease in the ignition delay. Whereas for negative sensitivity indicates the rate of reaction will decrease and leads to slower combustion due to increasing the ignition delay.